Life Cycle Assessment of Solid Oxide Fuel Cells and Polymer Electrolyte Membrane Fuel Cells
A Review
Sonia Longo1, Maurizio Cellura1, Francesco Guarino1, Marco Ferraro2, Vincenzo Antonucci2 and Gaetano Squadrito2, 1University of Palermo, Palermo, Italy, 2National Research Council, Institute for advanced energy technologies “Nicola Giordano” Messina, Italy
Abstract
Fuel cells (FCs) are among the key technologies that Europe will have to rely on in order to comply with the most recent environmental targets inspired by decarbonization and circular economy. The assessment of the real advantages of using FCs for producing energy must include a reliable analysis of the energy and environmental impacts during the life cycle of these systems, including the raw materials supply, production, use, and disposal. In this context, the life cycle assessment (LCA) is a well-established methodology for assessing the eco-profile of products and services and for identifying the components and the life cycle steps having the largest contribution to energy and environmental impacts.
In the chapter, authors focus on the analysis of two types of FCs: solid oxide FCs and polymer electrolyte membrane FCs. Authors describe the FC technology, the sectors of application, and the FC materials and components. A literature review of available LCA researches is also discussed to point out the environmental impacts of the FCs and the methodological issues that can arise in the study of a FC.
Keywords
Fuel cell; life cycle assessment; PEMFC; SOFC
1 Nomenclature
| Acronym | Name |
| AFC | Alkaline fuel cell |
| AP | Acidification potential |
| APU | Auxiliary power units |
| BoP | Balance of plant |
| CL | Catalyst layer |
| CHP | Combined heat and power |
| DMFC | Direct methanol fuel cell |
| EP | Eutrophication potential |
| FC | Fuel cell |
| FCV | Fuel cell vehicle |
| FU | Functional unit |
| GDL | Gas diffusion layer |
| GHG | Greenhouse gas |
| GWP | Global warming potential |
| HEV | Hybrid electric vehicle |
| HOR | Hydrogen oxidation reaction |
| HT-PEMFC | High temperature polymer electrolyte membrane fuel cell |
| IEA | International Energy Agency |
| ICEs | Internal combustion engines |
| IEC | International Electrotechnical Committee |
| LCA | Life cycle assessment |
| LCIA | Life cycle impact assessment |
| MEA | Membrane electrode assembly |
| MCFC | Molten carbonate fuel cells |
| MIECs | Mixed ionic/electronic conductors |
| MPL | Microporous layer |
| Ni–YSZ | Nickel–yttria-stabilized zirconia |
| NPMC | Nonprecious metal catalyst |
| ODP | Ozone depletion potential |
| ORR | Oxygen reduction reaction |
| PAFC | Phosphoric acid fuel cell |
| PBI | Polybenzimidazole |
| PED | Primary energy demand |
| PEMFC | Polymer electrolyte membrane fuel cell |
| PEN | Positive–electrolyte–negative |
| PTFE | Polytetrafluoroethylene |
| PGM | Platinum group metals |
| POCP | Photochemical ozone creation potential |
| RES | Renewable energy sources |
| SOFC | Solid oxide fuel cell |
| SYT | Yttrium-doped strontium titanate |
| YSZ | Yttria-stabilized zirconia |
2 Introduction
The 2030 European framework for climate and energy established the following targets, aiming to help the European Union to achieve a more competitive, secure, and sustainable energy system: a 40% cut in greenhouse gas (GHG) emissions compared to 1990 levels, at least 27% share of renewable energy consumption, a 30% improvement in energy efficiency (European Council, 2014).
Energy systems have to face priority challenges, which are the security of energy supply, the reduction of fossil fuel consumption, carbon footprint, and other environmental impacts linked to the fossil energy use (Cellura et al., 2013). This requires a shift in the way energy is generated and consumed and the introduction of new low carbon, distributed power generation technologies in the market (Zachmann et al., 2012).
Fuel cells (FCs) and hydrogen technologies are among the key technologies that Europe will have to rely on in order advance toward low-carbon and circular economy (New-Ig, 2011).
The assessment of the real energy and environmental advantages of using FCs must include an analysis of the energy and environmental impacts during the life cycle of these systems. In fact, even if FCs have low impacts during the operation step and can operate with hydrogen produced by renewable energy technologies, they cannot be considered totally clean. To include the entire life cycle in the analysis allows assessing the “hidden” impacts of FCs (Beccali et al., 2012a).
A well established and standardized method to fulfill this task is the life cycle assessment (LCA), which considers the environmental impact of goods and services while considering the primary renewable and nonrenewable energy consumption, resources, and materials use and emissions during the entire life cycle (Beccali et al., 2012b).
In this context, in the following sections, the authors develop a review of LCA studies applied to FCs, with a focus on solid oxide fuel cells (SOFCs) and polymer electrolyte membrane fuel cells (PEMFCs). Section 2 describes the FC technology, the sectors of application, and the FC materials and components Then, Section 3 discusses a literature review on LCA studies of SOFCs and PEMFCs, pointing out relevant environmental key issues and methodological insights. The last section reports some final conclusions.
3 The Fuel Cell Technology
3.1 Technology Description
Although their basic principle was reported by Sir William Grove in 1839, and different kinds of FCs were described by different authors, their first practical application started with the space exploration. FCs have been the electricity, heat, and water producers for the Gemini and Apollo programs of NASA.
The main component of a FC is an electrolyte layer, acid or basic, in contact with two porous electrodes, one on either side. Hydrogen molecules are oxidized to obtain protons and electrons on the anode, the electrons reach the cathode through an external circuit, allowing oxygen molecules reduction and the formation of oxygen-based anions.
The features of the electrolyte are the main cause of differentiation among the FCs applications. In the case of acidic electrolytes (like in PEMFCs and phosphoric acid fuel cells [PAFCs]), the protons formed at the anode are transported to the cathode through the electrolyte. Here, protons react with oxygen/hydroxyl ions producing water. In the case of basic electrolyte (like in SOFCs and alkaline FCs), anions are transported from the cathode to the anode through the electrolyte, where they react with protons generating water.
Every single cell cannot have guarantee voltages higher than 1.2 V (the reversible potential for water formation); consequently to reach higher voltages, more elements must be connected in series.
The basic electrochemical structure must be enclosed into a shell allowing supplying reactant, removing exhausts, and allowing electron recovery. The single cell is the structure formed by a single electrochemical basic structure enclosed in its shell. A stack is formed by connecting in series a number of cells to reach the required voltage. To reach a suitable power density, the mechanical stability of the stack, and performance endurance, in addition to the electrochemical performances optimization, a number of issues related to materials properties, architecture optimization, fluid dynamics, and safety must be considered.
In addition, to grant continuous power production, a constant reactant supply and product removing needs to be assured by a number of auxiliaries controlled by a central unit.
Consequently, FC systems are complex power plants involving both innovative and well-known technologies using a variety of materials and components that at the end of their useful life must be appropriately managed.
FC efficiency can be as high as 60% in electrical energy conversion and 85% in terms of cogeneration of electrical and thermal energies efficiency, with more than 90% reduction in pollutants emission respect to conventional oil/carbon fueled electrical generators (Antonucci et al., 2015; Briguglio et al., 2011; Frazzica et al., 2015).
Using pure hydrogen as fuel, the only output to the environment of FCs is water; this means that the effects of releasing particulates, toxic substances, or gases contributing to the greenhouse effect are avoided.
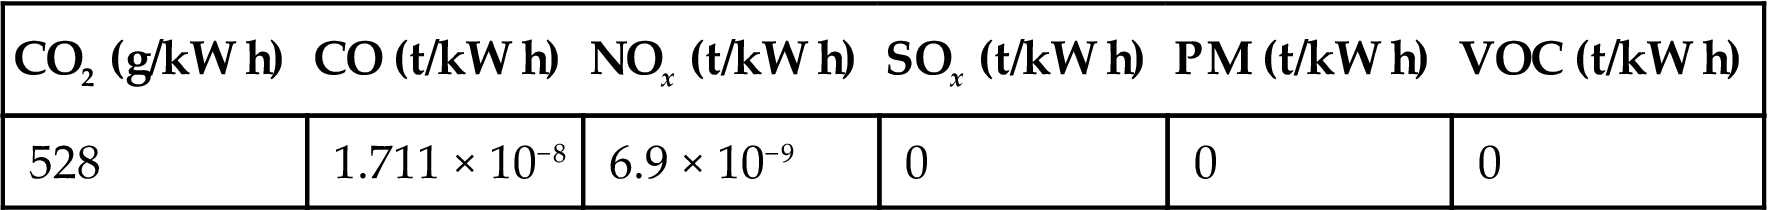
FCs are, however, fueled not only by pure hydrogen; in addition to reformate gas, they may be fueled directly by methane (SOFC) or light alcohols (PEMFC and SOFC). The exhaust gas composition from a FC system is composed by carbon dioxide (CO2), carbon monoxide (CO), and nitrogen oxides (NOx). Conversely from other combined heat and power (CHP) technologies, particulate matter (PM), sulfur oxides (SOx), and volatile organic compounds (VOCs) are not present. Table 6.1 shows emissions of a FC system based on PEMFC and fueled by natural gas (Brooks et al., 2013).
Table 6.1
Emissions of a Fuel Cell System Fed by Natural Gas (Brooks et al., 2013)
| CO2 (g/kW h) | CO (t/kW h) | NOx (t/kW h) | SOx (t/kW h) | PM (t/kW h) | VOC (t/kW h) |
| 528 | 1.711 × 10⁻⁸ | 6.9 × 10⁻⁹ | 0 | 0 | 0 |
3.2 Applications
FCs in stationary applications cover a wide range of power, from a few kilowatts, specific for home applications, to hundreds of megawatts for industrial applications. CHP applications combine on site electric energy generation with the recovering and use of waste heat. For these applications, different kinds of FCs are used, according to the specific application and power requirements. In fact, the usefulness of the recovered heat depends on the FC operating temperature; the lowest quality heat is supplied by PEMFC that work at temperatures below 100°C. FC system efficiency increases with working temperatures, although the thermodynamic efficiency of water formation decreases with temperature. Moreover, the efficiency increases working at low load, while subsidiaries have the highest efficiency working in a range close to the rated load; consequently, the FC-based power system is able to maintain a quite flat efficiency on a wide range, usually between 40% and 100% of the rated load.
For these reasons, PEMFCs are usually preferred for their low working temperature (40–90°C) in home applications (1–10 kW), although SOFC has also been recently considered, while in industrial applications (100–1500 kW), FCs operating at higher temperatures are preferred. PAFC systems are the oldest and best known, although molten carbonate fuel cells (MCFC) systems are being increasingly used. SOFC and PEMFC have also been considered for industrial applications, but the number of existing systems is limited. For large centralized power production, MCFCs and SOFCs have been considered due to their high working temperatures, allowing an increase in electric power production efficiency by waste heat recovery (typically, to power a steam turbine). Due to their high production costs in respect to conventional power generation systems, however, these systems were mostly considered as proof-of-concept implementations.
In CHP applications, the main feature driving market acceptance – despite higher costs – is the capability of FC systems to provide reliable and high-quality power on demand. Users who need these higher levels of power quality and reliability often find some form of CHP to be advantageous and are often less concerned about the installation costs of such generators in comparison to other groups of consumers. FC-based systems additionally allow high efficiency over a broad load profile, while maintaining low emission, vibration, and noise levels, without additional components or controls. These last characteristics make FC systems particularly attractive. In fact, FC systems could be designed for both indoor and outdoor installation and could be placed in close proximity to sensitive environments, people, and animals. Finally, although FCs require significant power-conditioning equipment for converting direct current (DC) into alternate current (AC), power from FC systems is clean and exhibits none of the signal disturbances usually observed from electric grid sources.
The electrical output of FC systems, being DC, must be inverted to AC for practical application. Inverters work better when converting higher DC voltage to lower AC voltage; for this reason, FC system output is usually between 200 and 400 V, as inverter efficiency reaches 92%–96% in these conditions (depending on input current–voltage characteristics).
A better indication of FC-based CHP systems’ maturity and competitiveness is the progressive increase in the number of such installations (Fuel Cell Industry Review, 2016). An increasing number of companies installed FC-based CHP systems for their production and commercial sites since 2000, showing an interesting growth from 2010 (Fuel Cell Industry Review, 2016), with more than 60,000 systems shipped in 2015.
More recently, the commercialization of micro-CHP for single residential units has begun, although their cost is relatively high. The fuel – natural gas – supplied by city pipeline networks is reformed inside the micro-CHP module where the reforming section is integrated with the FC and heat recovery sections; such units produce electric power of about 1 kW, with corresponding thermal outputs from the reformer and the FC of about 1.5 kW. These modules also include a boiler (20–35 kW) for heating and hot water provision.
The installation of these domestic micro-CHP systems could be undertaken only with strong support by national governments. The governments providing such support are those of Japan (Ene-Farm program), South Korea, Germany (Callux field test project), and Europe (ene.field and PACE projects). In Europe, the ene.field and PACE projects aiming at trial of thousands of micro-CHP units in Europe. These units comprise both PEMFC- and SOFC-based systems having an electrical power of 1–6 kW, and a thermal power of 1.4–25 kW for a global efficiency in the range 80%–95% (on HHV).
FCs in transportation applications are oriented toward new concepts of sustainable mobility, in terms of the increased availability of shared and public transport. The use of information and communication technologies, linked to advances in car technology, has only allowed the partial covering of market demands. The introduction of electric vehicles has not been fully successful, as the public at large has not been convinced yet. The car producers’ answer to this situation lay by the introduction of hybrid cars, where an internal combustion engine (ICE) is coupled with an electric motor and batteries to increase efficiency in the urban cycle; while this reduces urban pollution and overcomes the limits of battery-powered electric vehicles, it is not a complete solution, due to the remaining low efficiency of traditional technologies (i.e., ICE), their associated pollutants (CO2, NOx, SO2, particulate, VOC) and their acoustic emissions. The introduction of ICE/battery hybrid technologies opens the path to hybrid electric vehicles (HEV) based on both FCs and batteries. HEVs’ energy sources may be primarily battery or FC based; the main electric source may be the battery pack, with the FCs acting as range extenders, or the source of power can be the FC stack and batteries and/or super-capacitors, used to satisfy peak power demands and to store energy (whether produced in excess by the FC or recovered from brakes).
In this context, the PEMFC technology is especially suitable in automotive applications. This is due to their fast start-up times, low noise, and relatively small size, making PEMFCs suitable for use in vehicles characterized by limited space. As FC-based power trains are able to reach high efficiency (>40%) with respect to conventional thermal technologies (16%), PEMFCs provide a means of achieving objectives set for the short–medium term: reduction of pollutant emissions into the atmosphere, high flexibility, and independence from conventional available resources.
This is demonstrated also by the industry’s favored use of PEMFCs for their high power density and excellent dynamic characteristics, if compared to other types of FCs. For transportation, the preferred fuel is hydrogen, mainly stored under pressure at 350 or 700 bar; up to now, there are few models of FC that use liquid hydrogen or on board reforming.
Although FC applications are mostly closer to road transportation applications – due to its associations with pollution – it is also relevant to other transport modalities (ships, rail and aircraft). Naval applications concern both military, surface commercial ships, and small and medium size ships (Han et al., 2012). FCs can meet the high-level requirements of those naval systems in terms of efficiency, reliability, maintainability, endurance, vibration and noise levels, modular and flexible design, as well as a range of power output ranging from about 1 kW – for a small boat’s auxiliary power unit (APU) – to many MW, to propel large ships (Satlter, 2000). The same power systems that have been developed for stationary applications may be considered for installation on board; such systems provide the required power and are developed to be safely run in indoor applications (ships power units are usually located in enclosed spaces).
Most rail locomotives are – contrary to appearances – not electrically powered; more than 50% of the railway lines in European countries and more than 60% worldwide depend on diesel, and the cost of electrifying a rail line is high. There is also a growing interest in alternative fuels, where hydrogen and FCs represent a plausible option. In the European context, while some European countries have over 70% electrification of their rail lines, different national lines and, occasionally, different lines in the same countries, present differences in voltages. For this application, adopting FCs could become a key technology in realizing a unified European railway network. Such adoption might also result in lower maintenance costs, and lower visual impact of electrification, as overhead power supply would no longer be needed. Finally, due to their modularity, FC power systems could be easily adapted for multiunit train application.
An increasing interest is registered in airborne vehicles, where research has been concentrated around unmanned aerial vehicles and very small manned aircraft. Design priorities for unmanned aircraft are silence, thermal untraceability, and long range, in order to ensure tactical flexibility (Donateo et al., 2017).
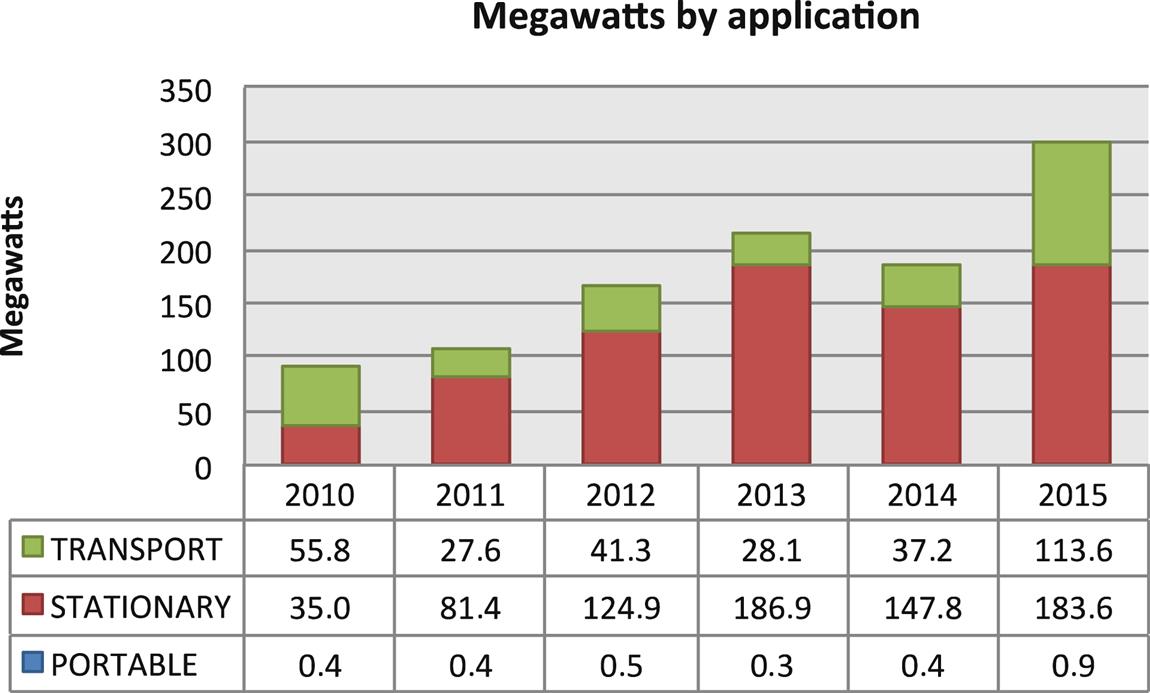
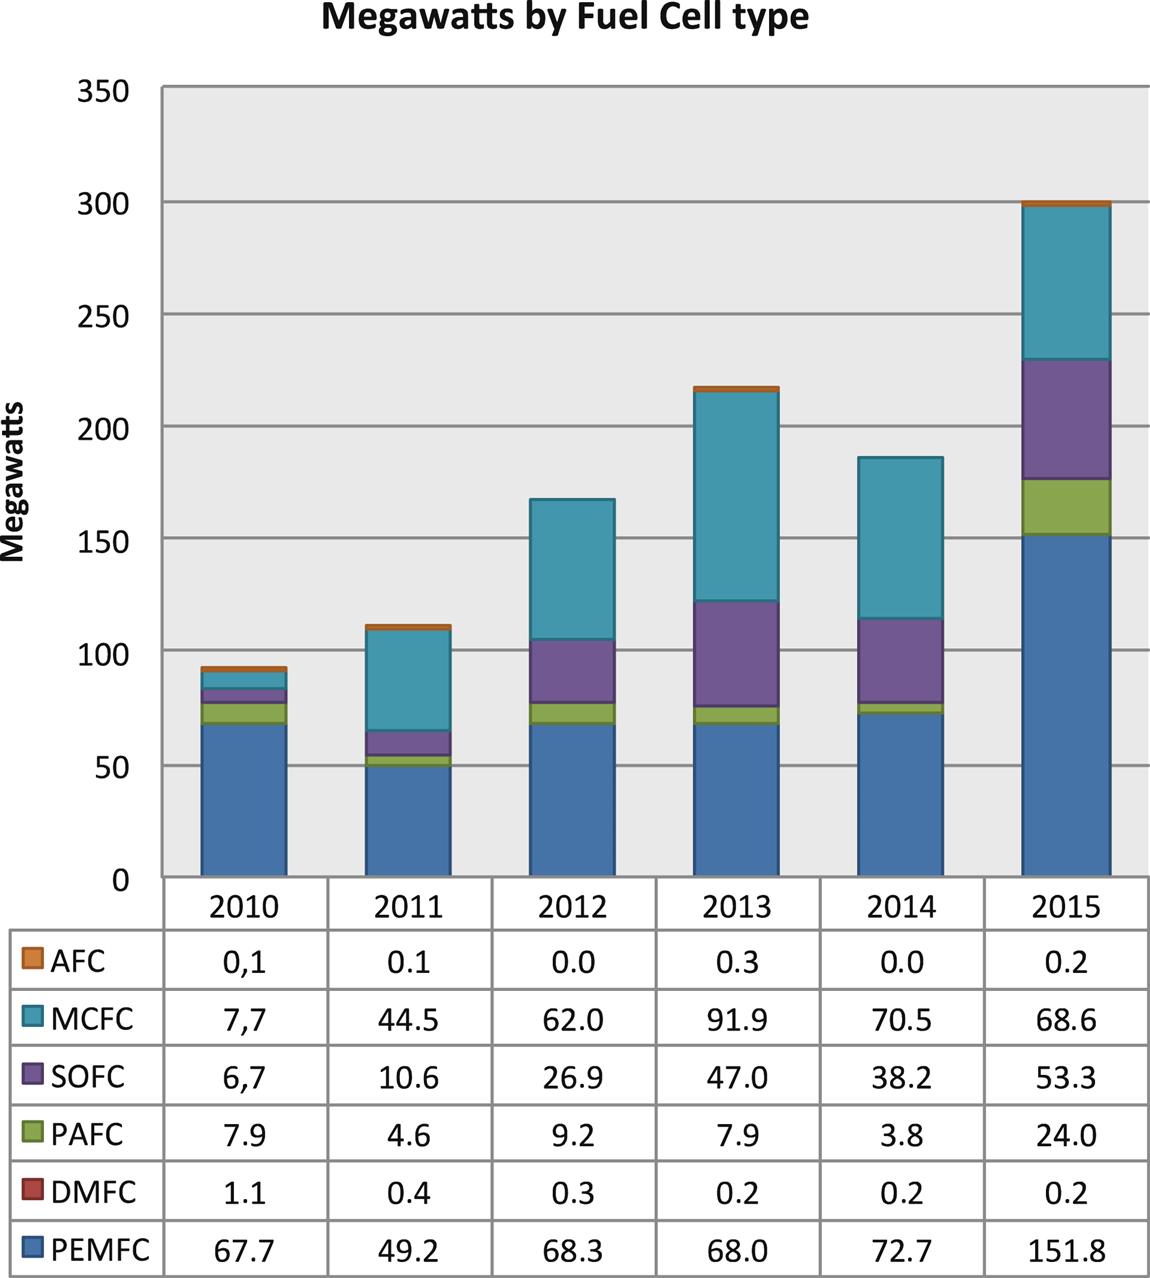
Another rapidly developing FC application market is portable power supply, as the limited energy capacity of batteries is unlikely to meet the fast-growing demand for portable electric devices.
In addition to the usual drivers for FC application – off-grid operation, longer run-times compared with batteries and quick recharging – there are additional reasons to use FCs rather than batteries in portable application: potentially significant weight reduction (very important in military applications), convenience, reliability and lower operating costs. Consequently, global production of portable FCs has continuously grown. More than 90% of these units are based on hydrogen- or methanol-fueled PEMFCs, the latter increasingly important, especially for micro units (Figs. 6.1–6.2).
3.3 Fuel Cell Materials and Components
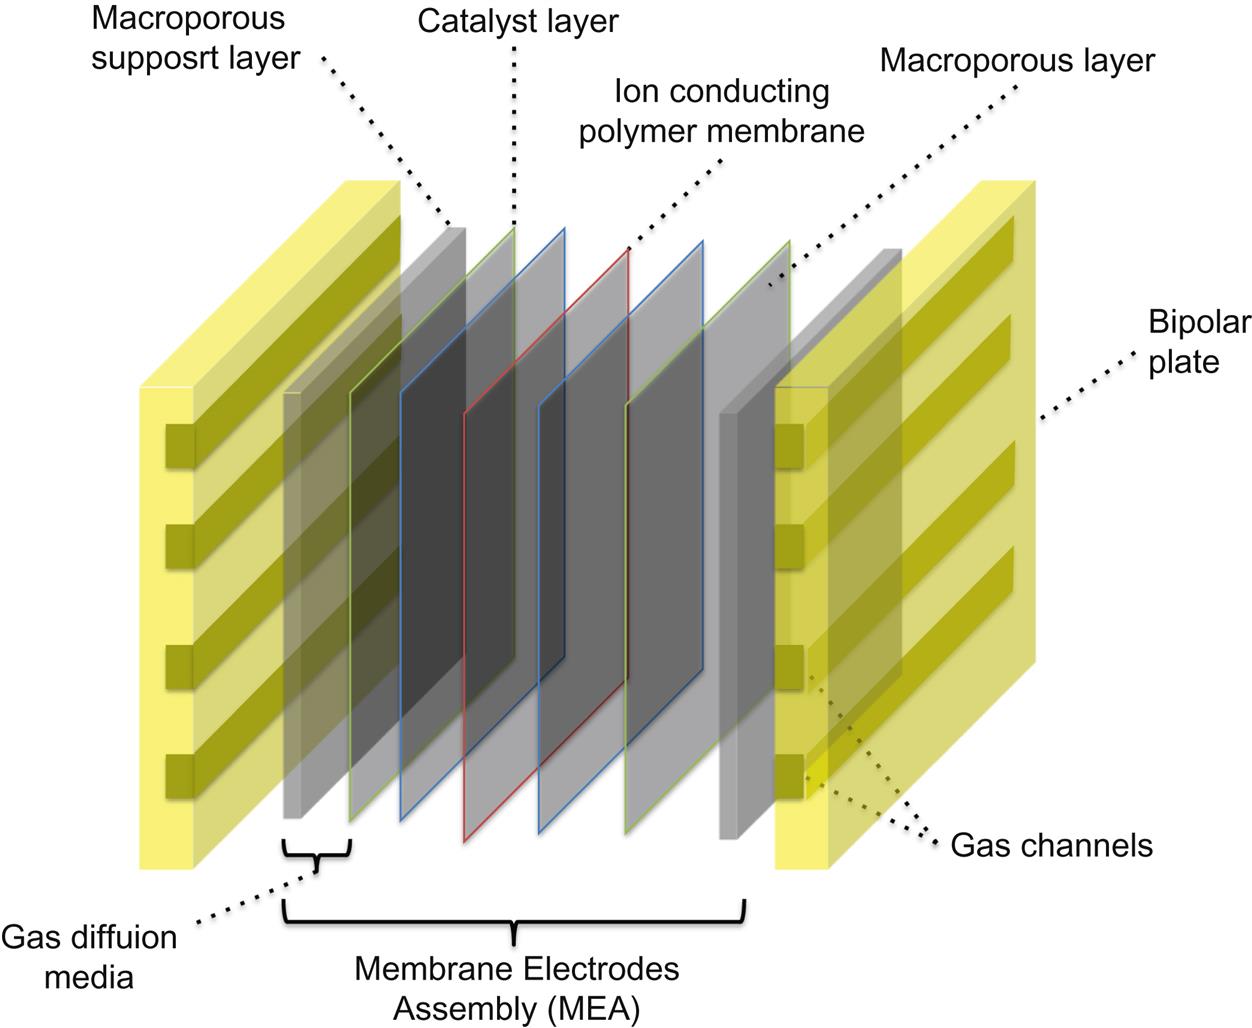
3.3.1 Polymer Electrolyte Membrane Fuel Cell (Fig. 6.3)
3.3.1.1 Electrolyte
The polymer electrolyte membrane is the heart of the cell. It must satisfy the following requirements: high ionic conduction without electron transport and reactant crossover, chemical stability in an environment with HO• and HOO• radicals, thermal stability in the operating range, and mechanical strength (Doyle and Rajendran, 2003; Hickner et al., 2004). On both sides of the membrane, there are two catalyst layers (CLs); this is the location where electrochemical reactions take place. The catalyst particles must be in contact with both electron and proton-conducting materials and must be accessible to the reactants; a path for the removal of water, produced as part of the reaction, must also be available (Passalacqua et al., 2001a).
The polymer electrolyte membranes are currently mainly based on perfluorosulfonic acid. The best known of these is nafion, which was first developed by the DuPont Company in 1960s, with a backbone structure of polytetrafluoroethylene (also known as Teflon). Other perfluorinated polymer materials such as Aciplex (Asahi Chemical Industry), Flemion (Asahi Glass Company), Gore-Select (W.L. Gore and Associates, Inc.), and Neosepta-F (Tokuyama) are also adopted in PEM FC applications. These membranes could operate easily up to 90°C; other membrane materials that can operate at high temperatures (100–200°C) are preferred for high temperatures PEMFC. The latter have the advantages of better catalyst tolerance to CO, cooling strategy, and waste heat recovery (Li et al., 2009; Ma et al., 2004; Zhang et al., 2006).
3.3.1.2 Membrane Electrode Assembly
The membrane electrode assembly (MEA) is obtained by sandwiching the membrane, the CL, and the gas diffusion layer (GDL). Consequently, it is a multilayer system, in which each layer strongly interacts with the others; the materials used and its final structure are both of great importance to its efficiency and functionality.
3.3.1.3 Gas Diffusion Layer
The GDL, sometimes called the “diffusion media,” lies in between the CL and the flow field (FF). It plays an important role in PEMFC performance and has several functions: transport and distribution of reactants and liquid water, electron conduction, mechanical support, and heat conduction (Passalacqua et al., 2001b). Usually, it has a dual layer structure with a macroporous substrate layer (SL) and a thinner microporous layer (MPL) coated on SL and in contact with the CL. A high-quality SL should have excellent gas permeability, high electron and heat conductivity, smooth surfaces, good mechanical strength, appropriate wettability, and stable chemical and thermal properties. A MPL must be structured to grant a better interface between CL and SL in order to provide the best water management and gas supply.
GDL is not an electrochemically active component, but in it, a number of physical processes that greatly influence cell performance take place (Park et al., 2012; Thoben and Siebke, 2004). In addition to diffusive transport, the most relevant are bypass flows induced by in-plane pressure differences between neighboring channels, through-plane flows, induced by mass source/sink due to electrochemical reactions, heat transfer, two-phase flows, and electron transport. These transport phenomena are related both to the material properties and GDL structure and their correct balance is the key for maintaining the correct water balance inside the cell.
3.3.1.4 Catalyst Layer
The CL is the most expensive part of the MEA. It is usually very thin (about 10 µm) and consists of three phases of interpenetrated, percolated structures (Passalacqua et al., 2001a): grains of a supported metal catalyst (usually Pt) for enhancing the reaction rate and electronic conduction, a ionomer for ion conduction, and a void for reactant gas and water transport. CL contributes to a significant extent to the cost of MEA because platinum and several of its alloys are the usual catalysts for both the oxygen reduction reaction and hydrogen oxidation reaction. Consequently, platinum-loading reduction and the development of nonplatinum-based catalysts are priorities in CL development.
3.3.1.5 Bipolar Plates
Bipolar plates (BPs) are the electrical connections between cells; typically, these are also used for distributing the fuel and the oxidant to anode and cathode, respectively. Consequently, these are subject to oxidizing conditions on one face and reducing conditions on the opposite one. This limits the materials that could be used for their construction, due to the necessity to have both good conductivity and high resistance to corrosion in a wide oxidizing potential range. The BPs also provide mechanical support over MEA and conductive passages for both heat and electron transport. The materials for BP must be easy to manufacture, stiff, be of low weight, and produced at low cost – characteristics that are difficult to satisfy concurrently.
BPs contribute to a significant extent to the cost and weight of a FC; gas distribution FFs and cooling paths are usually built in BPs, creating the necessity of appropriate manufacturing processes.
Today, graphite-based BPs are largely used, because graphite is chemically stable, light, and conducts adequate electricity and heat. Its brittleness and manufacturing costs are important limiting factors; research for alternative materials has long been established, looking at metals such as aluminum, iron, stainless steel, titanium, and nickel are object of research; other materials, like polymer composites, silicon (mainly for micro-FCs), and carbon-based materials have also been examined.
Metallic alloys are particularly attractive, due to their low cost and high-volume manufacturing availability, high thermal and electrical conductivities, and because they allow for thin BP (<1 mm thick) production. Metallic BPs are not very common, as metals undergo corrosion more easily than graphite, thus requiring protective treatments. Coating is considered as the most effective solution to the improvement of the corrosion resistance of metallic BPs, but its additional cost must be reduced for an effective utilization. Moreover, coatings may also introduce potential problems, such as pinhole defects, that result in local corrosion and metallic ion contamination of the membrane.
Cooling path channels must be added to keep FCs at their optimal temperature when a large amount of waste heat is generated. Cooling channel designs have received relatively little attention in comparison to other components, as they have not historically been seen as a particularly high priority in themselves.
Finally, the single units have to be connected in series, to reach the requested voltage and power outputs.
3.3.1.6 Sealing
Finally, gas tightening is assured by a sealing system, usually based on conventional elastomers. Each PEMFC developer has evolved its own approach to sealing, and this aspect is considered as a consolidated aspect although further evolution may be possible.
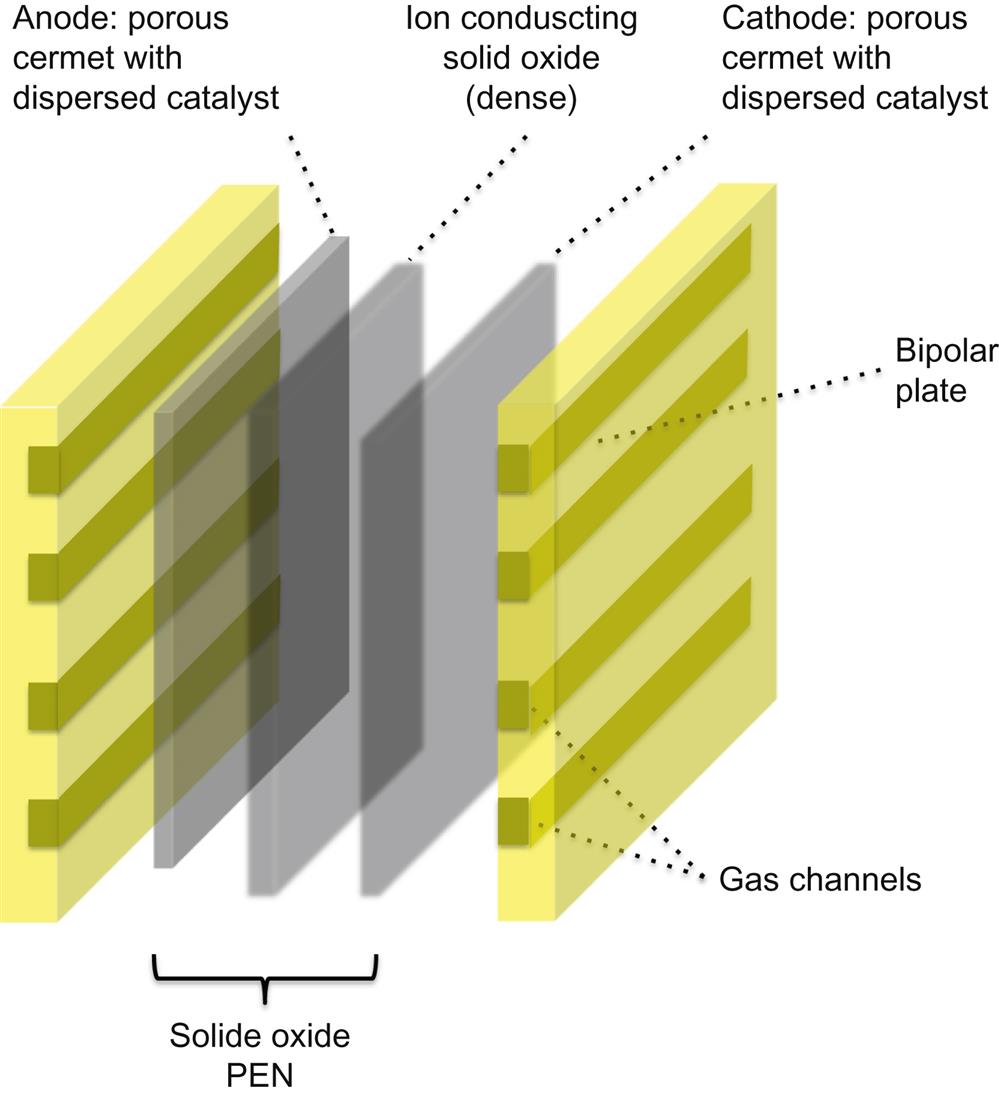
3.3.2 Solid Oxide Fuel Cell (Fig. 6.4)
3.3.2.1 Electrolyte
The electrolyte is usually made of a dense solid metal–oxide cermet. One of the most common electrolyte materials is zirconia (ZrO2) with 8% yttrium added as a dopant, known as yttria-stabilized zirconia (YSZ); this solution allows for a good conduction of oxygen ions in the temperature range of 650–1000°C. Scandium-stabilized zirconia was also proposed, as it shows higher ionic conductivity and excellent stability both in oxidizing and reducing environments that lead to better long-term stability in respect to YSZ; it is, however, more expensive and scandium availability is problematic. In addition, a number of ionic conductors have been studied like: La1−xSrxGa1−yMgyO3−(x+y)/2 (LSGM)-based perovskites; La2Mo2O9 (LAMOX); Bi4V2−xMxO11−y (BIMEVOX); several pyrochlores with relatively high ionic transport property, such as (Gd,Ca)2Ti2O7−δ; materials derived from Ln10−xSi6O26±δ, where Ln represents a lanthanide-series element. Moreover, with the aims of reducing operating temperature, both proton-conducting materials, and ceria-based electrolytes have been considered (Jia et al., 2010; Lefebvre-Joud et al., 2009; Lu et al., 2003; Maguire et al., 2000; Mogensen et al., 2000; Steele, 2000; Zhan and Barnett, 2006).
Typical issues in the choice of the electrolyte materials are stability problems at low oxygen concentrations, and cost or mechanical stability issues. In addition to the reduction of the working temperature and better material stability, the research is addressed also to the reduction of the thickness of the electrolyte layer by maintaining the mechanical properties and reactant gas containment by appropriate production methods.
3.3.2.2 Cathode
The cathode in SOFCs is usually composed of porous perovskite materials, which are oxides characterized by relatively good electronic conduction at high temperatures in an oxidizing atmosphere. The most widely used cathode materials in SOFCs are strontium-doped lanthanum manganite (La1−xSrxMnO3, or LSM), strontium-doped lanthanum cobaltite (La1−xSrxCoO3−δ, or LSC), strontium-doped lanthanum ferrite (La1−xSrxFeO3−δ, or LSF), and strontium-doped lanthanum cobalt ferrite (La1−xSrxCo1−yFeyO3−δ, or LSCF).
3.3.2.3 Anode
SOFC anodes are generally porous ceramic–metallic (cermet) composites of an electrolyte (e.g., YSZ) and a metal (such as nickel, Ni). Porous nickel–yttria-stabilized zirconia (Ni–YSZ) cermets (and small variations thereof) are currently the most common anode materials for three reasons: their low cost, their immiscibility in each other, and their nonreactiveness over a wide temperature range.
Usually, Ni–YSZ anodes are prepared by sintering a mixture of NiO and YSZ powders (generally NiO:YSZ = 1:1 by weight), and reducing them in an atmosphere of the gaseous fuel. However, the Ni–YSZ anode is subject to carbon deposition when using carbon-based fuels and exhibits low tolerance to sulfur. When using natural gas or coal syngas as a fuel, homogeneous gas-phase reactions occurring within the anode – including methane reforming, water-gas shift, methane cracking, the Boudouard reaction, and CO hydrogenation – have to be accounted for. These could be used to reduce carbon deposition by optimizing SOFC operating conditions. For example, by controlling anode inlet composition and/or reducing the operating temperature below 750°C, carbon deposition on many oxides could be prevented by disabling CH4 dissociation (Mogensen et al., 2000). Consequently, for hydrocarbon fuel conversion, Cu is preferred due to its resistance to carbon deposition, and ceria-based oxides (e.g., Ce1−xGdxO2−δ, or GDC) electrolytes are commonly used, as they are good oxygen-ion conductors at reduced temperatures and ceria is an excellent electrocatalyst for CH4 (Atkinson et al., 2004; Jiang and Virkar, 2003; Liu and Barnett, 2003).
Fuel flexibility is a key factor for SOFC applications, driving research into new anode materials/compositions to avoid carbon deposition. For example, a recent work (Yang et al., 2011) has shown that nanostructured barium-oxide/nickel (BaO/Ni) interfaces (created by vapor deposition of BaO into Ni–YSZ) facilitate water-mediated carbon-removal reactions. The anode showed stable operation and high power density in C3H8, CO, and gasified carbon fuels at 750°C, with no observable microstructural change and minimal carbon build up.
3.3.2.4 Interconnects
Cell interconnectors recover electrons, and transfer these from the anode of one cell to the cathode of another. They can have the shape of BPs (like in PEMFC) for planar configurations, or electron conductor nets or wires for other configurations. Interconnect materials must be stable in both oxidizing and reducing atmospheres, and must also conduct electrons well, as well as being chemically and mechanically compatible with the electrolyte. All these requirements must be satisfied while minimizing materials and manufacturing costs. SOFC interconnect materials could be either ceramic or metal/alloy materials. Ceramic interconnectors (usually strontium/calcium-doped LaCrO3) are used between 800 and 1000°C (Tietz et al., 2002), while metallic interconnectors are preferred below 750°C (Fergus, 2005). Metallic interconnectors have many advantages, including lower costs, higher electric and thermal conductivity, and lower sensitivity to thermal stresses. Ferritic steels and Cr-based alloys are usually considered for such purposes; Cr-based alloys are very attractive, as Cr2O3 has high conductivity compared to other oxides and is stable in operating conditions. Chromium is poisonous to cathodes and its manufacturing is quite difficult and costly. NiCr-based alloys could be a good alternative, but there is the possibility of mismatch with other components under thermal cycling. Thus, ferritic steels appear most promising, as they offer low processing costs and their base material is highly available. In this case, the main drawback is the difficulty in obtaining a good contact with ceramic components, as well as the formation of nonconductive oxide layers on the metal surface.
3.3.2.5 Sealing
Unlike in PEMFC, sealing is not a consolidated technology in SOFCs. Sealants must be stable in a wide range of oxygen partial pressures and be able to minimize thermal stresses during high-temperature operation. An additional complication is due to the strong link between the sealant and the other cell component properties. The quality of seals must be high for reasons of safety and efficiency; even small leaks in these seals can affect negatively the latter. Both rigid and compressive seals are considered for SOFCs. A major advantage of compressive seals – usually made of metal or modified mica-based material – is that the seals are not rigidly fixed to the other SOFC components. In this way, an exact match in thermal expansion is not required, but it is necessary to maintain a constant load on cells during operation.
For rigid seals – usually glass ceramics – the thermal expansion must closely match those of other SOFC components, but a continuous load is not necessary. Metallic-brazed seals are also used as rigid seals, because they are less impacted by local stress than ceramics; they are, however, costly and could interact adversely with ceramic components, reducing their functionality.
4 Life Cycle Assessment of SOFCs and PEMFCs: A Literature Review
The energy and environmental impacts of SOFCs and PEMFCs have been evaluated through the LCA methodology in few literature studies, described in the following sections in order to identify the energy and environmental impacts of these technologies, their environmental hot spots and methodological key issues.
4.1 Energy and Environmental Impacts of SOFCs and PEMFCs
The literature studies examined in this review are summarized below, arranged in two different sections: SOFCs studies (first part) and PEMFCs studies (second part).
Karakoussis et al. (2001) examined the life cycle burdens, in terms of materials, input energy flows and emissions, due to the manufacturing of two types of SOFCs: a tubular (100 kW) and a planar (1 kW) SOFC, including the stack, positive/electrolyte/negative (PEN) structures and interconnect, and the balance of plant (BoP).
The results showed that the production and supply of materials used for the manufacture of both the BoP and the FC are responsible for a significant share of the overall environmental burdens associated with the system, e.g., in the planar SOFC the energy input for the materials production is almost 100 times bigger than the energy used during the manufacturing stage.
Referring to the tubular SOFC, the energy input for the materials production and for the manufacturing step are almost the same due to the high energy consumption of relatively few thermal processes during the manufacture, e.g., the plasma spray and electrochemical vapor deposition.
Authors noted that the manufacturing system of planar SOFCs is often characterized by significant material inefficiencies, in terms of product rejects and process scrap. The reuse or recycling of these wastes can reduce the burdens associated with materials supply.
Zhao and Brouwer (2012) assessed the energy and materials inputs and outputs related to the manufacturing of a yttrium-doped strontium titanate (SYT) anode-supported planar SOFC system with three different types of tape-casting processes (solvent-based tape-casting, nontoxic solvent-based tape-casting, and water-based tape-casting processes). Furthermore, the authors compared the system with a traditional Ni–YSZ-based planar SOFC system, focusing on the raw materials production and the manufacture of the stack and the BoP. The selected functional unit (FU) is a 100-cm2 anode-supported single cell, with 0.5-cm thick anode substrate in the anode production and a PEN structure with 0.08-mm thick anode substrate in the FC production.
The analysis of the different types of tape-casting processes showed that the nontoxic solvent-based tape-casting requires the highest energy input for the step of material production, while the highest energy and materials inputs per cell occur in the manufacture of the water-based tape casting. In particular, the energy inputs during the manufacture are mainly due to thermal processes as sintering and drying. In terms of emissions, by using two different types of emission factors (United States and California), the water-based tape casting is responsible of the lowest contribution to all the examined substances (PM, CO, SOx, NOx, CO2); the nontoxic solvent-based tape casting causes the highest emissions of PM, CO, and CO2; the solvent-based tape casting is responsible of the main SOx emissions. Referring to NOx emissions, they are mainly caused by the nontoxic solvent-based tape casting if US emission factors are used; conversely, considering the California emission factors, the main responsible is the solvent-based tape casting.
Considering the total system, the energy consumption and emissions are dominated by the interconnects and the BoP manufacturing, while PEN manufacturing accounts for only 2% of the total. The energy consumed for the materials production of PEN, BoP, and interconnect is about 97% of the total, compared to the 3% used as process energy.
The SYT anode-supported planar SOFC system has lower energy requirements for manufacturing and lower emissions than the Ni–YSZ anode-supported SOFC system, due to the lower amount of energy required in the BoP manufacturing for the first system.
Herron (2012) carried out a life cycle inventory of 1 kWe planar SOFC system integrated for residential CHP, from the raw materials supply to the SOFC use, in order to examine how the introduction of residential SOFCs can affect the urban air quality. The FU is 1 kW h of electricity delivered to the user. The analysis showed that the life cycle emissions are mainly caused by the natural gas extraction and distribution.
The eco-profile of the system was compared with those of different fuels and technologies for electricity generation: a coal plant, a natural gas-combined cycle power plant, and a nuclear plant. The results show that the SOFC has lower emissions than the coal and natural gas plants during the use phase, but higher than the nuclear plant. However, if the whole life cycle is examined, the SOFC has the lowest emission profile.
Strazza et al. (2010, 2015) carried out two studies for evaluating the environmental impacts of two SOFC systems: a 20-kWel and a 230-kWel system, respectively. The environmental impacts were referred to 1 kW h of electricity generated, by including all the steps from the raw materials supply to the electricity production (operation/maintenance of the system). The second study also includes the end-of-life step.
The authors examined different fuels suitable for FCs: methanol (from fossil and renewable sources), natural gas, biogas (from biowaste/sludge), and hydrogen (from reforming, cracking, electrolysis).
The results showed that the use of different fuels influences the components of the system and, consequently, the input materials and the impacts of the manufacturing step. In detail, in terms of environmental impacts, the system fueled with hydrogen is the best configuration during this step as it includes only the reformer, while the methanol option, including the reformer and the methanator, is the worse configuration. However, the differences are limited except for the ozone-depletion potential (ODP) indicator (differences of about 25%).
The main impacts caused by the manufacturing step are acidification potential (AP) and photochemical ozone creation potential (POCP), due to the use of materials for the production of the stack and the unit component. However, the contribution of the manufacture to the total impact is lower than the contribution of the other steps. In detail, considering the whole life cycle, the fuel production step is the main responsible of almost all the environmental impacts caused by the electricity generation with SOFC (over 90%), except for global warming potential (GWP) mainly caused by the operation stage of the FC (about 83%).
The results highlighted that, among the various alternative fuels for FCs (natural gas, biogas, hydrogen from reforming, cracking, and electrolysis, methanol), a best solution is not available for all the impact categories. For example, bio-methanol and hydrogen from cracking and electrolysis are the best configurations focusing on GWP; natural gas, biogas, hydrogen from cracking, and electrolysis cause the lower impacts on POCP and eutrophication potential (EP); biogas from sewage sludge is characterized by environmental benefits if compared with natural gas expect for AP and POCP.
Lee et al. (2015) calculated the environmental impacts of a 100-kW-class SOFC power generation system following a “from cradle-to-grave” approach. The results revealed that the manufacturing and end-of-life (incineration) stages have small impacts. The remaining impacts (between 89.9% and 97.8%) are caused by the system operation. The main contributor to the impacts of the manufacturing stage (about 72%) is the stack except for the metal depletion; the remaining 28% is associated with the BoP production, in particular, caused by the air blower and the air heat exchanger. The impacts of the stack manufacturing are mainly caused by the anode and interconnect, while the cathode and electrolyte have very small impacts due to the small amount of material inputs if compared to the anode and interconnect.
Lin et al. (2013) assessed the primary energy demand (PED) and the GHG emissions for four different fuel options derived from waste, to feed a 5-kW SOFC APU applications in New York State: compressed natural gas derived from municipal solid waste in a local landfill, biodiesel from waste-cooking oil available at local restaurants, ethanol from locally grown corn stover, commercially available ultralow sulfur diesel from crude oil.
A waste-to-electricity approach was applied in the system boundaries definition, by including the steps of fuel production and SOFC operation (manufacturing and maintenance of SOFC are not included). The selected FU is 1 kW h of electricity generated by SOFC.
The energy analysis revealed that the use of biodiesel requires the lowest PED, followed by methane. For GHG emissions, the best fuel is methane, due to an avoided impact of CO2 emissions by the use of landfill gases, followed by biodiesel. The worse configuration for both the examined impacts refers to the use of diesel as fuel. Thus, the use of biodiesel from waste biomass is an attractive option for SOFC–APU if compared with traditional fuels.
Baratto and Diwekar (2005) compared a SOFC-based APU with technologies as idling of diesel engines. The system boundaries include the fuel supply, the device manufacturing, the operation, and maintenance of the vehicle.
Looking at the SOFC-based APU life cycle, a large amount of pollutants is released to air, water, and soil during the system manufacturing and assembly, except for CO2 emissions mainly released during the operation step (92%). The production step is also the main responsible factor for the emission of some hazardous substances, PM, and metals.
The comparison between the SOFC-based APU and the idling of the diesel engine showed that the potential environmental impact of the latter is three orders of magnitude higher than the first one. The POCP is the impact category with the biggest differences, due to higher emissions of hydrocarbons.
The substitution of traditional technologies with the SOFC-based APU has great potential in terms of human health and environmental impact reduction: going from idling of diesel engines to SOFC-based APU, a reduction from 64% to 99% of all the major pollutants is achievable.
Staffel et al. (2012) compared a 1-kW SOFC based domestic CHP with a typical system used in the UK residential sector (a 24-kW condensing boiler for heat and electricity from national grid). Following a “from cradle-to-grave” approach, the authors performed a comparison based on the complete provision of energy demanded in a typical UK house during 1 year (FU).
The study revealed that the stack is the most significant contributor to the impacts of the system manufacturing, mainly caused by the electricity and chromium for the stainless-steel components used in the stack manufacture. In addition, the stack is the main responsible of the high impact of the operation step, due to its substitution during the useful life of the system (usually three stacks are substituted). The end-of-life of the system has very small impacts, mainly due to the credits from recycling chrome interconnects and steel.
The energy and environmental impacts can be reduced by replacing a traditional system with a SOFC one. Energy and carbon payback times were calculated comparing the two systems, considering that coal, gas, and UK average energy generation mix are displaced by the SOFC system. The payback indices are dependent from the type of system replaced by the SOFC system: the energy and carbon payback times are, respectively, about 1.5 and 0.75 years if coal fired generation is displaced, 2 and 1.7 when displacing the average grid mix, 3.5 and 3.7 when displacing the combined cycle gas turbine.
Pehnt (2003a,b,c) compared conventional and FC vehicles. The author estimated that in conventional cars the production of car body, engine, etc., is responsible of 10%–25% of the GWP, whereas in FC vehicles this relative contribution is higher because (1) the absolute total impacts are lower and, thus, the relative significance of production is higher, and (2) the production of FC vehicles leads to higher environmental impacts due to the higher weight and the use of catalyst materials.
In the case of SOFCs, the stack is responsible for a large proportion of the total impacts of the FC production. This is partly due to the low lifetime of the stack that needs to be substituted during the system operation.
Analyzing the contribution of the stack production, two components are relevant: the gas diffusion electrode (GDE), responsible for a large share of the total acidification and the GWP; in detail, the platinum-group metals (PGM) used as catalysts cause the high acidification. The FF plate is the second most important component particularly because of the electricity input for resin impregnation of the plate.
The results of the analysis showed that the FC powered car shows prominent lower GHG emissions if supported by innovative hydrogen production paths, such as electrolysis with electricity generated from renewable energy or biomass gasification. For fossil methanol FC vehicles, there is no significant GWP advantage compared to conventional vehicles.
White et al. (2001) analyzed a 1-kW PEMFC from raw materials supply to the end-of-life. Authors found that SOx air emissions are mostly emitted in during the processing of natural gas needed for production of methanol and other fuels needed for platinum and palladium refining. Also, other emissions (CxHy, CO2, VOCs, NOx) are particularly high due to the large amount of fuels used to power the FC and to manufacture its components. Referring to the impacts, AP and POCP are the major ecological ones, due to SOx emissions from processing metal ores including palladium and inputs to stainless steel and copper. POCP is largely a result of CxHy emissions from fuel conversion. GWP is mainly caused by the CO2 emissions from fuel conversion. Negligible impacts are related to carcinogens, O2 depletion in water and ODP. A dominance analysis showed that the production and conversion of biofuel has the largest overall impact, with the platinum and recycled palladium also having major impacts.
Hussain et al. (2007) carried out a LCA of a PEMFC-powered mid-size family passenger automobiles and compared it with a conventional ICE automobile of the same kind. The analysis included the operation of the vehicle and the production and distribution of the vehicle and fuel. The study showed that the energy consumption and the GHG emissions related to the hydrogen life cycle are higher if compared to the gasoline life cycle (about 3.5 and 8.5 times higher, respectively). However, considering the overall life cycle of the automobiles, the energy consumption and the GHG emissions are, respectively, about 2.3 and 2.6 times lower for the PEMFC powered care if compared with the gasoline one. No specific data for the PEMFC included in the automobile are presented.
Pehnt (2001) investigated the production of a 75-kWel PEMFC stack, selected as FU, used in FC cars. The analysis identified two key processes in the stack production: the mining of PGM, characterized by significant environmental impacts mainly due to the SO2 emissions caused during the pyrometallurgical treatment of the material and the supply of graphite, particularly energy intensive, in particular during the graphitization step in the manufacturing process or the mining and sizing in the case of natural graphite.
The assessment of the environmental impacts showed that two components are of significant importance. The first component is the GDE that is responsible for 74% of the total AP and for more than half of the GWP. The carbon fiber causes 5%–7% of the environmental impacts; given the low weight of the fibers, this is a considerable share which is caused by the high-energy consumption for the polyacrylnitrile precursor and its stabilization. The second component is the FF plate, particularly because of electricity input for resin impregnation of the plate. The graphitic plates contribute to the 13% of the GWP, partly caused by the graphite production and partly by the use of a resin impregnant, compared to 17% of the electricity consumption. The membrane is not very relevant because of the low energy consumption and the closed production process (e.g., solvent recycling).
The production of the carbon fiber and the methylacrylate are the main responsible of the NMVOC emissions (30% and 25%, respectively).
Comparing the PED, GWP, and AP of a stationary stack with a mobile one, the first has specific impacts (per kW) 2–5 times higher than the second one. This is mainly due to the higher PGM loading, the higher input of graphite and the lower power density at lower current densities.
However, the higher impacts of stationary stack per power unit (kW) are more than offset by the longer life-time when moving toward impact per energy unit (kW h) (Pehnt, 2003c).
A comparison of the mobile stack production and its use in a car revealed that the GWP and the consumption of nonrenewable resources for stack is on the order of one-fourth of the emissions of the utilization of the car, while the AP is comparable.
In stationary systems, e.g., CHP systems that use FCs, the impact of the stack production is much less relevant than in mobile systems: the system production contributes to less than 13% of the total impacts for the majority of impact categories, assuming that no PGM are recycled. In the case of recycling, the contribution is lower than 8%.
4.2 Key Elements
The analysis of the state-of-the-art allowed the identification of key elements that influence the energy and environmental performances of SOFCs and PEMFCs.
Different authors identified the efficiency of the system as a key element that influences the environmental impacts of SOFCs. The variation in efficiency involves changes in the life cycle inventory, in particular in fuel consumption and CO2 emissions. In detail, varying the efficiency of a certain percentage causes a similar variation in the environmental impacts, with opposite sign (e.g., to a 10% reduction of the efficiency follows an increase of the environmental impacts of about 9%–10%) (Strazza et al., 2010). Thus, improving the efficiency in the SOFC system can reduce the environmental impacts (Lin et al., 2013), also considering that the system operation accounts for the largest part of the overall impacts (Lee et al., 2015).
Also, the power density of the cell has a significant impact on overall environmental burdens, since higher densities reduce requirements for some of the key materials and associated processing (Karakoussis et al., 2001).
Another key element is the type of fuel used in the system especially for mobile applications. As outlined by Pehnt (2003a,b,c), different factors are of relevance for the LCA of fuels: (1) the primary energy carrier has a high impact on GWP and use of abiotic resources. Switching to renewable primary energy carriers reduces the impacts to low inputs of fossil energy along the production chain; (2) the efficiencies and impacts of processing; (3) the upstream and downstream processes, e.g., different requirements for transportation or distribution.
Varying from natural-gas-derived methanol to bioethanol and from bioethanol to bio-methanol, the environmental impacts due to fuel production and use can be reduced. However, it is important to take into account the impact on land use due to the use of biofuels, often grown with significant use of pesticides, synthetic fertilizers, and fossil fuels. Thus, the use of sustainable agriculture for biofuel production appears to be a feasible way to reduce the environmental impacts of biofuels used in FCs (White et al., 2001).
Furthermore, the choice of a fuel influences the system configuration and the consequent impacts due to the manufacturing step (Strazza et al., 2010). For example, the use of methane as fuel requires a reformer, while a reformer and a methanator are needed in the case of methanol-fueled unit.
In addition, the comparison of different fuel options has to take into account the electricity mix used for the production of fuel. Different local conditions for energy supply may influence the environmental convenience of biofuels against fossil fuels. For example, biogas from sewage sludge produced in Germany, considering the German electricity mix, shows better performance for each examined impact category with respect to the European average mix (Strazza et al., 2015).
Also the mix of electricity used during the manufacturing step is an important key issue in the impact calculation. To evaluate the influence of the electricity mix during the manufacturing step, Lee et al. (2015) examined seven different countries where a SOFC CHP system was manufactured. They showed that the results are strongly influenced by the technologies employed in the electricity generation; in particular, the more coal is used in a country, the greater the environmental impact for that country.
Referring to PEMFCs, the use of platinum and palladium can influence their environmental impacts. In fact, a considerable amount of fuel is needed to process platinum and palladium ores during production (White et al., 2001). Recycling can significantly reduce these values. The use of recycled palladium reduces system impacts by 57%. However, recycling palladium increases the quantity of CxHy emissions because of the materials, energy, and transportation needed in the palladium recycling process.
The use of polymer membrane in each cell unit may cause special concerns during decommissioning or recycling (Sørensen, 2004). Usually, recycling is difficult and incineration recommended, although in some cases, care should be taken to separate difficult materials such as Pd used with organic membranes before burning. There are small amounts of special materials requiring care; the most important is Pt used as a catalyst at each electrode. It causes strongly negative impacts due to the emissions during extraction and purifying, particularly in the Third World plants with inferior environmental skill. The effect of these impacts can be reduced if Pt is recovered and reused.
4.3 Methodological Insights
The LCA methodology is regulated by the International standards of ISO 14040 series (ISO 14040, 2006; ISO 14044, 2006). However, when performing a LCA, different methodological choices are left to the analysts. This consideration applies to all products in general, but it also concerns the applications to the FCs.
The LCA studies applied to SOFCs and PEMFCs are characterized by different methodological assumptions, with regard to the system boundaries, the FU, and the software used to perform the LCA. Further, they rely on different inventory data (i.e., primary data vs secondary data) and environmental impact assessment categories and methods, and model differently the technologies at different locations. Thus, the range of variation of the outcomes is very large and a direct comparison is quite difficult.
Therefore, common and harmonized calculation rules have to be adopted to ensure the comparability among different studies. In this context, a detailed technical guidance on how to conduct the LCA (according to the ISO 14040 and 14044 standards) for FCs and hydrogen production technologies is the FC-HyGuide (Masoni and Zamagni, 2011). It builds on the International Reference Life Cycle Data System, coordinated by the Joint Research Centre – Institute for Environment and Sustainability (JRC-IES), through the European Platform on LCA.
The FC-HyGuide consists of two parts: the first provides general information on the document, explaining its purpose and structure. A general description of LCA is also provided to briefly introduce the methodology to the users. The second part provides detailed guidance on how to perform a LCA for FC and hydrogen production technologies. The methodological aspects include the definition of the FU, the system boundary selection, allocation rules, and selection of impact indicators. They are explained with reference to the technological systems under study. A specific set of rules about the information and topics that have to be considered and reported in a LCA study are described in parallel to the methodological aspects. The guidance document is completed with five annexes: Annex I provides LCA study reporting templates, Annex II shows the metadocumentation fields for the ILCD format to be filled out within the data sets, Annex III provides a specific data collection template, Annex IV includes a review reporting template, and Annex V gives examples from case studies on FCs and hydrogen production which will assist users in the application of the guidance document.
The following subsections illustrate some of the methodological key issues which analysts have to deal with when perform a LCA applied to FCs (Table 6.2).
Table 6.2
Methodological Aspects of the Examined Case Studies
| Reference | Examined Product | Functional Unit | System Boundaries | Inventory Data | LCA Software | Impact Assessment Methods | Indicators and/or Impact Categories |
| Karakoussis et al. (2001) | Planar and tubular SOFC | 1 kW of electricity generated | From gate to gate | Primary and secondary data | Boustead model | NA | Energy inputs and air emissions |
| Zhao and Brouwer (2012) | SYT anode-supported planar SOFC system | 100 cm2 anode-supported single cell with 0.5 mm thick anode substrate in the anode production analysis and a PEN structure with 0.08 mm thick anode substrate in the fuel cell production | From cradle to gate | Secondary data | NA | NA | Energy inputs and air emissions |
| Herron (2012) | Planar SOFC | Deliver of 1 kW h of electricity to a user | From cradle to operation | Secondary | NA | NA | Air emissions |
| Strazza et al. (2010) | SOFC | 1 kW h electricity generated | From cradle to maintenance | Secondary data | Simapro | EPD | GWP, ODP, POCP, AP, EP, PED |
| Strazza et al. (2015) | SOFC | 1 kW h net electricity generated (self-consumed electricity is subtracted) | From cradle to grave | Secondary data | Simapro | CML and EPD | GWP, ODP, POCP, AP, EP, PED, abiotic depletion |
| Lee et al. (2015) | SOFC CHP system | A 100-kW-class SOFC CHP system | From cradle to grave | Primary and secondary data | SimaPro | ReCiPe | GWP, ODP, POCP, AP, EP, PED, Human toxicity, particulate matter, ionizing radiation, ecotoxicity, land use, metal and fossil depletion |
| Lin et al. (2013) | SOFC APU | 1 kW h electricity generated | From waste to electricity, excluding maintenance or SOFC manufacturing | Secondary data | Not specified | Cumulative energy demand and Traci 2 | PED, GWP |
| Baratto and Diwekar (2005) | SOFC-based APU | A SOFC-based APU | From manufacturing to maintenance | Secondary data | Simapro | Not specified | Potential environmental impact |
| Staffel et al. (2012) | SOFC based domestic CHP | 1 kW SOFC-based CHP | From cradle to grave (excluding maintenance) | Primary and secondary data | Simapro | Impact 2002+ | GWP, PED |
| Pehnt (2003a,b,c) | SOFC powered vehicle | Vehicle | From cradle to operation | Not specified | Not specified | Not specified | GWP, PED, AP |
| White et al. (2001) | PEMFC | 1 kW PEMFC | From cradle to grave | Primary and secondary data | Simapro | Ecoindicator 95 | Eco-point |
| Hussain et al. (2007) | PEMFC powered automobile | Vehicle | From cradle to grave | From cradle to grave | Not specified | Not specified | GWP, PED |
| Pehnt (2001) | PEMFC stack | 75 kW stack | From cradle to grave | Primary and secondary data | Gabi | Not specified | GWP, PED, AP |

4.3.1 Goal and Scope Definition: System Boundaries
The system boundaries define which unit processes are part of the product system, in a life-cycle perspective. For most of the examined studies, the selection of the system boundaries follows a “from cradle-to-grave” approach, including raw materials supply, system manufacturing, fuel production, operation, maintenance, and end-of-life steps. Even if a “from cradle-to-grave” approach is chosen, some life cycle steps are sometimes omitted, e.g., the maintenance or the end-of-life step, due to the unavailability of reliable data.
Furthermore, some studies only refer to the raw materials supply and manufacturing of the stack (“from cradle-to-gate” approach) and, sometimes, of the BoP.
Generally, the manufacturing of the capital goods is omitted as machinery and plant buildings can be considered of negligible importance compared to the contribution to the impacts of the components that are used in the FCs (Pehnt, 2003a, 2003b; Lunghi and Bove, 2003; Lunghi et al., 2004).
4.3.2 Goal and Scope Definition: Functional Unit
The ISO 14040 (2006) defines the FU as the “quantified performance of a product system for use as a reference unit.” Identified the function of the investigated product, the FU indicates the quantification of this function. It is important for the comparability of different studies referred to the same product (i.e., a literature review).
Considering that the function of a FC system is the production of electricity and useful heat, the FC-Hy guide (Masoni and Zamagni, 2011) suggests to express the FU in MJ of exergy. It is defined as the sum of MJ of electricity plus the MJ of useful thermal energy multiplied by a Carnot coefficient.
Different FUs have been selected in the LCA studies examined in this review, as described in the following:
• 1 kW h of electricity generated. In this case, the impacts are expressed in terms of unit of energy output, and their quantification is linked to the performances of the system during the operation step: the better the performances during the use phase, the lower the impacts. In some cases, authors refer the impacts to 1 kW h of net electricity generated, by subtracting the self-consumed energy;
• 1 unit of FC, including the stack (i.e., a 75-kWel stack) and, in some cases, also other components as desulphurizer, steam prereformer, power conditioning, thermal management system; and
• 1 unit of system where the FC is integrated (i.e., a 100-kW-class SOFC CHP system or a passenger car with PEMFC).
4.3.3 Life Cycle Inventory Analysis: Data Collection, Data Elaboration, and Data Quality
The inventory analysis includes the data collection and calculation procedures to quantify relevant inputs and outputs of a product system (ISO 14040, 2006). Data used in a LCA study can be classified as primary and secondary data. Primary data refer to the main processes and are directly collected or measured in situ, i.e., input and output data of stack production; secondary data are taken from secondary sources (environmental databases, literature studies, etc.), e.g., the inventory of the energy sources consumed in the production of a material or component.
The analysis of LCA studies of SOFCs and PEMFs showed a lack of primary data on stack and BoP manufacturing processes. In detail, a complete study of the stack for PEMFC was carried out by Pehnt (2001), to which the other literature studies relate (Dhanushkodi et al., 2008; Garraín et al., 2011). White et al. (2001) also refer to primary data on PEMFC manufacturing. For SOFCs, only two studies (Karakoussis et al., 2001; Staffel et al., 2012) refer to primary data on the manufacturing step of the FC. In addition, Zhao and Brouwer (2012) used primary data for examining the manufacture of the anode. The above information highlights that this topic is worthy of investigation.
For both the FCs, data on the operation step are simulated, collected by using questionnaires, laboratory analyses, or manufacturer catalogs. The raw materials supply and the end-of-life are examined by using secondary data.
Out of the eight studies that give information on the software used for data elaboration, only one used the GaBi software and one the Boustead model; the others refer to SimaPro.
Generally, referring to the quality of data used in the studies, the following information is included: typology of data (primary or secondary), sources of primary data and, in some cases, on secondary data, information on the geographical representativeness of the electricity mix.
4.3.4 Life Cycle Impact Assessment: Impact Categories and Assessment Methods
The life cycle impact assessment (LCIA) consists of mandatory (e.g., classification and characterization) and optional steps (e.g., normalization and weighting) (ISO 14044, 2006) that can be included by selecting different impact assessment methodologies.
Each methodology allows for calculating particular impact categories (i.e., GWP, AP, etc.) expressed with specific environmental indicators and assessed by using selected classification, characterization, normalization, and weighting methods.
In detail, the impact assessment methodologies can express the same impact category with different environmental indicators (e.g., acidification expressed in kgSO2eq or mol H+eq), and can use different pollutant substances and characterization factors for the impact category calculation (Cellura et al., 2011).
Differences in the LCIA step, impact assessment methodologies and selected impact categories were found in the literature analysis in SOFCs and PEMFCs. In detail, some of the examined studies do not include the LCIA, some include only the mandatory steps of the analysis, others take into account also the optional steps. Furthermore, the following impact assessment methodologies are used in the various analyses: EPD, CML, Traci, ReCiPe, Impact 2002+, Ecoindicator ’95. The above differences make the comparison among the studies difficult.
5 Conclusions
The literature review showed a low availability of LCA studies applied to SOFCs and PEMFCs, especially with reference to the second technology. The review allowed identifying the life-cycle steps and the FC components that are responsible of the higher impacts, both for SOFCs and PEMFC. In addition, it revealed that some of the key element that influences the environmental impacts of FCs are the efficiency of the system, the type of fuel used, the electricity mix used during the manufacturing step, the end-of-life of the FCs (e.g., recycling).
As highlighted in the methodological analysis that authors carried out, differences of the studies can be found, due to various reasons, including: selection of different FUs, system boundaries, software used to perform the LCA, different inventory data and environmental impact assessment categories and methods, geographical variability. The above methodological differences influence the final results of the studies, which are characterized by a very large variation. Thus, a comprehensive assessment of the energy and environmental benefits of SOFCs and PEMFCs should be based on a consistent and reliable application of the LCA methodology. Analysts should carefully investigate the methodological key issues of the study and the uncertainty of data, and finally, should assess the variability of the results by applying a sensitivity analysis.