Sustainability Decision Support Framework for the Prioritization of Hydrogen Energy Systems
Jingzheng Ren1, Di Xu2, Huan Cao2, Shun’an Wei2, Lichun Dong2 and Michael E. Goodsite3, 1The Hong Kong Polytechnic University, Hong Kong SAR, China, 2Chongqing University, Chongqing, China, 3University of Southern Denmark, Odense M, Denmark
Abstract
This chapter proposed a multicriteria decision-making methodology for the sustainability prioritization of industrial systems. The methodology incorporates a fuzzy analytic hierarchy process method that allows the users to assess the soft criteria by using linguistic terms. A fuzzy analytic network process method is used to calculate the weights of each criterion, which can tackle the interdependencies and interactions among the criteria. The preference ranking organization method for enrichment evaluation approach is used to prioritize the sustainability sequence of the alternative systems. Moreover, a sensitivity analysis method was developed to investigate the most critical and sensitive criteria. The developed methodology was illustrated by a case study to rank the sustainability of five alternative hydrogen production technologies. The advantages of the developed methodology over the previous approaches were demonstrated by comparing the results determined by the proposed framework with those determined by using the pervious approaches.
Keywords
Sustainability assessment; multicriteria decision-making; industrial systems; fuzzy analytic network process; PROMETHEE; fuzzy analytic hierarchy process
1 Introduction
Industrial systems, e.g., chemical production systems, power generation systems, vehicle manufacturing systems, play a significant role in the national economy. However, industrial systems as double-edged swords can also cause various environmental and social problems like water pollutions, haze-fog phenomena, health problems, and riots due to the risks of environmental contaminations (Ebenstein, 2012; Sun et al., 2006; Zheng et al., 2007); the concept of sustainability should be incorporated in the industrial systems for achieving the sustainable development (Fang et al., 2007). Taking hydrogen energy production systems as an example, hydrogen, a clean energy carrier without the emission of polluting gases during its oxidation process, has long been regarded as a promising way for alleviating the environmental and economic problems caused by the excessive use of fossil fuels (Ren et al., 2013b). However, although the processes to use hydrogen have little or zero negative impacts on the environment, the processes to produce hydrogen may have significant negative impacts on the environment. Moreover, different hydrogen production pathways have distinctive environmental impacts as well as different economic performance (Lee et al., 2009b; Simbeck and Chang, 2002) and social concerns (Ricci et al., 2008; Roche et al., 2010). Recently, the sustainability assessment and prioritization of various hydrogen production pathways by considering all the three pillars (environmental impacts, economic performance, and social concerns) has received more and more attentions. Manzardo et al. (2012) studied the economic, social, and environmental performances of various hydrogen production technologies in a life-cycle perspective and concluded that different pathways behave differently in term of sustainability. Since the sustainability assessment of different industrial systems is a prerequisite for selecting the scenario that has the best integrated economic–environmental–social performance, an efficient methodology for prioritizing the different industrial systems or technologies according to their sustainability is very helpful for the stakeholders/decision-makers to select the most sustainable pathway.
Othman et al. (2010) pointed out that the criteria for the sustainability assessment can be categorized into two types: hard criteria and soft criteria. The hard criteria are usually objective factors that can be quantitatively evaluated by using crisp numbers, while the soft criteria are usually subjective measures that can only be given a qualitative description according to the knowledge and experience of the stakeholders/decision-makers. Accordingly, previous methodologies that were developed for the sustainability assessment of industrial systems can also be divided into two types: quantitative assessment or qualitative evaluations. Afgan et al. (2007) carried out a multicriteria evaluation of various hydrogen systems by incorporating multiple technological, environmental, and market indicators into a general sustainability index using different weight functions. Pilavachi et al. (2009) integrated five criteria into a generic index as the overall evaluation of different hydrogen technologies in terms of weights calculated by using the analytic hierarchy process (AHP) method. Bozoglan et al. (2012) used exergy-based environmental and sustainability parameters to analyze the sustainability of various solar hydrogen production techniques. Tugnoli et al. (2008) developed a sustainability “fingerprint” based on multiple key performance indicators to investigate the sustainability of a variety of hydrogen production technologies by the steam reforming of natural gas. Khoo et al. (2015) carried out a relative life-cycle assessment to investigate the sustainability of 2-MeTHF manufacture originating from different biomass resources. A novel sustainability assessment methodology for energy systems using life-cycle emission factors and sustainability indicators was developed by Hacatoglu et al. (2015), which was applied to a hybrid energy system with hydrogen-based storage to meet the energy needs of a small community in southern Ontario. A life-cycle sustainability assessment methodology was employed for the analysis of biogas production systems in Kenya by linking the biogas energy with production infrastructures (Nzila et al., 2012). Gangadharan et al. (2012) compared two polygeneration systems, which use coal and natural gas as feed to produce dimethyl ether and power, using a comprehensive sustainability assessment methodology. All these methodologies belong to the type of quantitative assessment that can only consider the hard criteria.
For the importance of soft criteria in the sustainability assessment, there are also multiple qualitative methodologies for the sustainability assessment of industrial systems that can address the soft criteria. Ren et al. (2013a) proposed a fuzzy multiactor multicriteria decision-making (MCDM) methodology to assess the sustainability of four biomass-based hydrogen production technologies, in which 15 criteria concerning the 4 aspects of economic, environmental, technological, and social–political performances were considered. The developed method allows decision-makers/stakeholders to evaluate the alternatives with respect to each criterion by using linguistic terms. Chang et al. (2011) used a fuzzy Delphi method to evaluate multiple hydrogen production technologies based on 14 criteria, and the relative performances of different pathways with respect to each criterion were also scored by linguistic terms. These two methods are essentially based on the qualitative evaluations, though they can incorporate both hard and soft criteria. In the methods (Chang et al., 2011; Ren et al., 2013a), the users first use linguistic terms to evaluate all the criteria according to the preferences of the decision-makers/stakeholders, which were, then, transformed to fuzzy numbers or crisp numbers. Accordingly, the data for the sustainability assessment used in these methods were mainly obtained according to the subjective judgments of the decision-makers/stakeholders. As the human’s judgments usually involve subjectivities, vagueness, and uncertainties, the hard criteria, which can be directly quantified by using crisp numbers, cannot be fully depicted in these methods. In other words, both the hard and soft criteria were evaluated qualitatively in these methods; the quantitative data of the alternatives with respect to the hard criteria were not be fully used. Consequently, the assessment accuracy by using these methods cannot be ensured due to the characteristics of the subjective judgments. The expected method for the sustainability assessment of various industrial systems should not only consider both the hard and soft criteria but also handle the hard and soft criteria differently, i.e., evaluating the hard criteria quantitatively and soft criteria qualitatively. Moreover, while the sustainability assessment usually concerns the three pillars, i.e., economic, environmental, and social aspects (Fernandez-Sanchez and Rodriguez-Lopez, 2010; Jayswal et al., 2011; McDowall and Eames, 2007; Othman et al., 2010; Ren et al., 2015; Wang et al., 2009; Zhou et al., 2007); the criteria regarding the technological and political aspects were also often included since the technological and political issues always affect the economic, environmental, and social performance (Chang et al., 2011; Mohsen and Akash, 1997; Ren et al., 2013a; Ren et al., 2015). Thus, the sustainability assessment and prioritization of various industrial systems or technologies is a typical MCDM problem as it requires to score a finite number of alternatives (i.e., different industrial systems) with the considerations of multiple dimensional performances. These kinds of problems usually involve not only multiple alternatives and multiple criteria, but also the interdependencies and interactions among the criteria. Therefore, it is also necessary for the assessment methodology to be capable of tackling the interdependencies and interactions among the criteria (Spangenberg et al., 2010; Wang et al., 2009).
In the MCDM problems, the determination of the criteria weights is of vital importance since it can reflect not only the relative importance of the criteria, but also the preferences of the decision-makers. Taking the sustainability performance of power generation based on different sources as an example, there are various energy sources for power generation, e.g., hydropower, wind power, solar power, and nuclear power; however, the sustainability of electricity generation originating from different energy sources is distinctive due to the varied preference of the stakeholders and the different performance of various energy sources in different countries. Therefore, an effective sustainability assessment method should be object oriented, meaning that the method should be capable of helping the stakeholders to select the most sustainable industrial system among multiple alternatives for achieving their objectives based on the preferences/willingness of the stakeholders/decision-makers and the actual conditions.
In this study, a novel MCDM methodology for the sustainability assessment and prioritization of industrial systems was developed. The methodology adopts the fuzzy AHP method to quantify the soft criteria, which allows the stakeholders/decision-makers to evaluate the performances of various pathways with respect to soft criteria by using linguistic terms. As the hard criteria, they are directly quantified according to the data collected from the literatures, e.g., books, papers, technical reports, etc. Moreover, the method of fuzzy analytic network process (ANP) (Dagdeviren and Yuksel, 2010), which can handle the interdependencies and interactions among the criteria by combing the thoughts of the fuzzy AHP and the conventional ANP method, is employed to determine the weights of the criteria for aggregating multiple criteria into a generic index. Finally, the preference ranking organization method for enrichment evaluation (PROMETHEE) approach is used to prioritize the sustainability sequence of the alternative pathways by calculating the net outranking flow of each scenario. Consequently, the proposed methodology is not only capable of evaluating the hard and soft criteria with different approach but also exploring the interdependencies and interactions among the criteria (Spangenberg et al., 2010). All in all, this study aims to develop a generic and object-oriented sustainability decision support framework for the prioritization of industrial systems that can handle both the hard and soft criteria, and also the interdependencies and interactions among the criteria.
2 Mathematical Methods
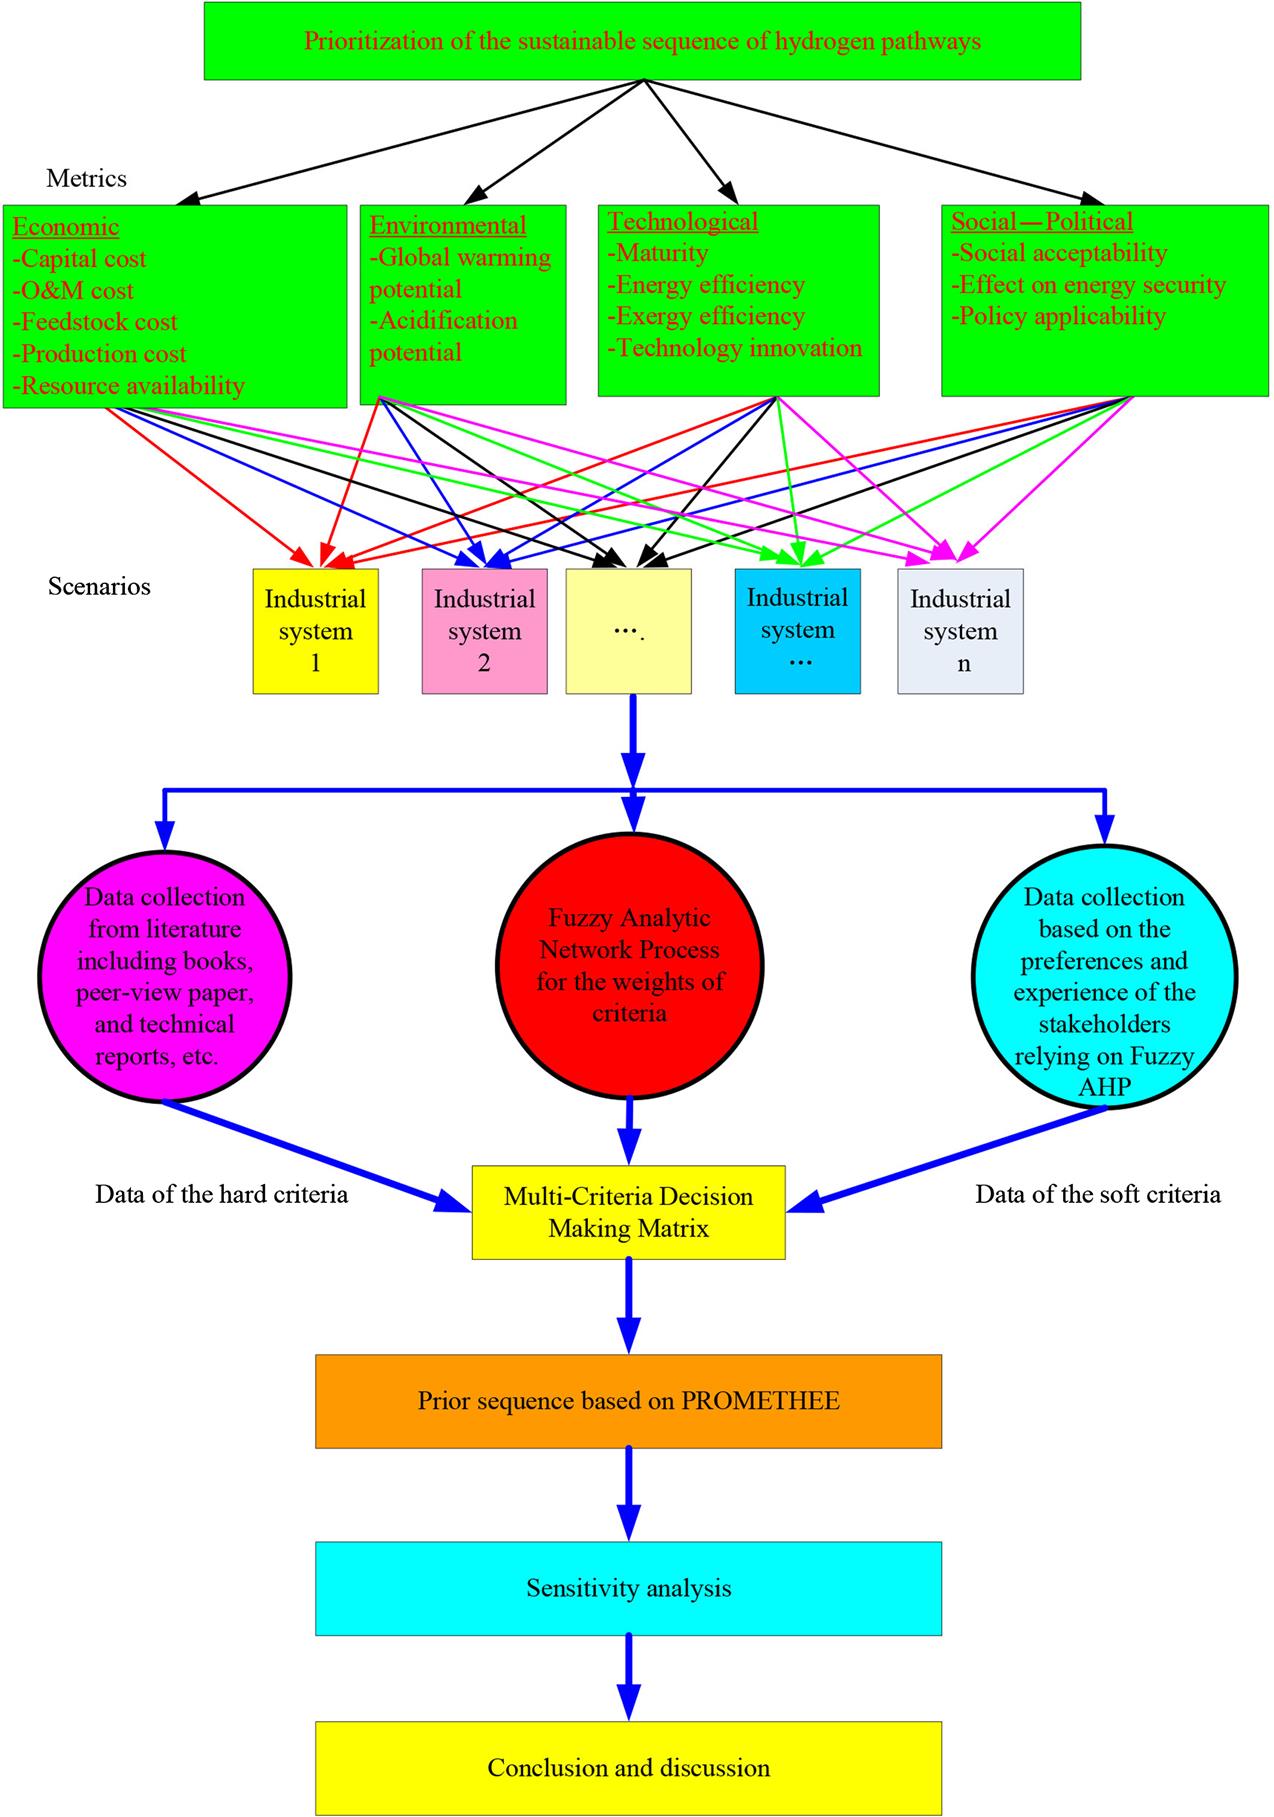
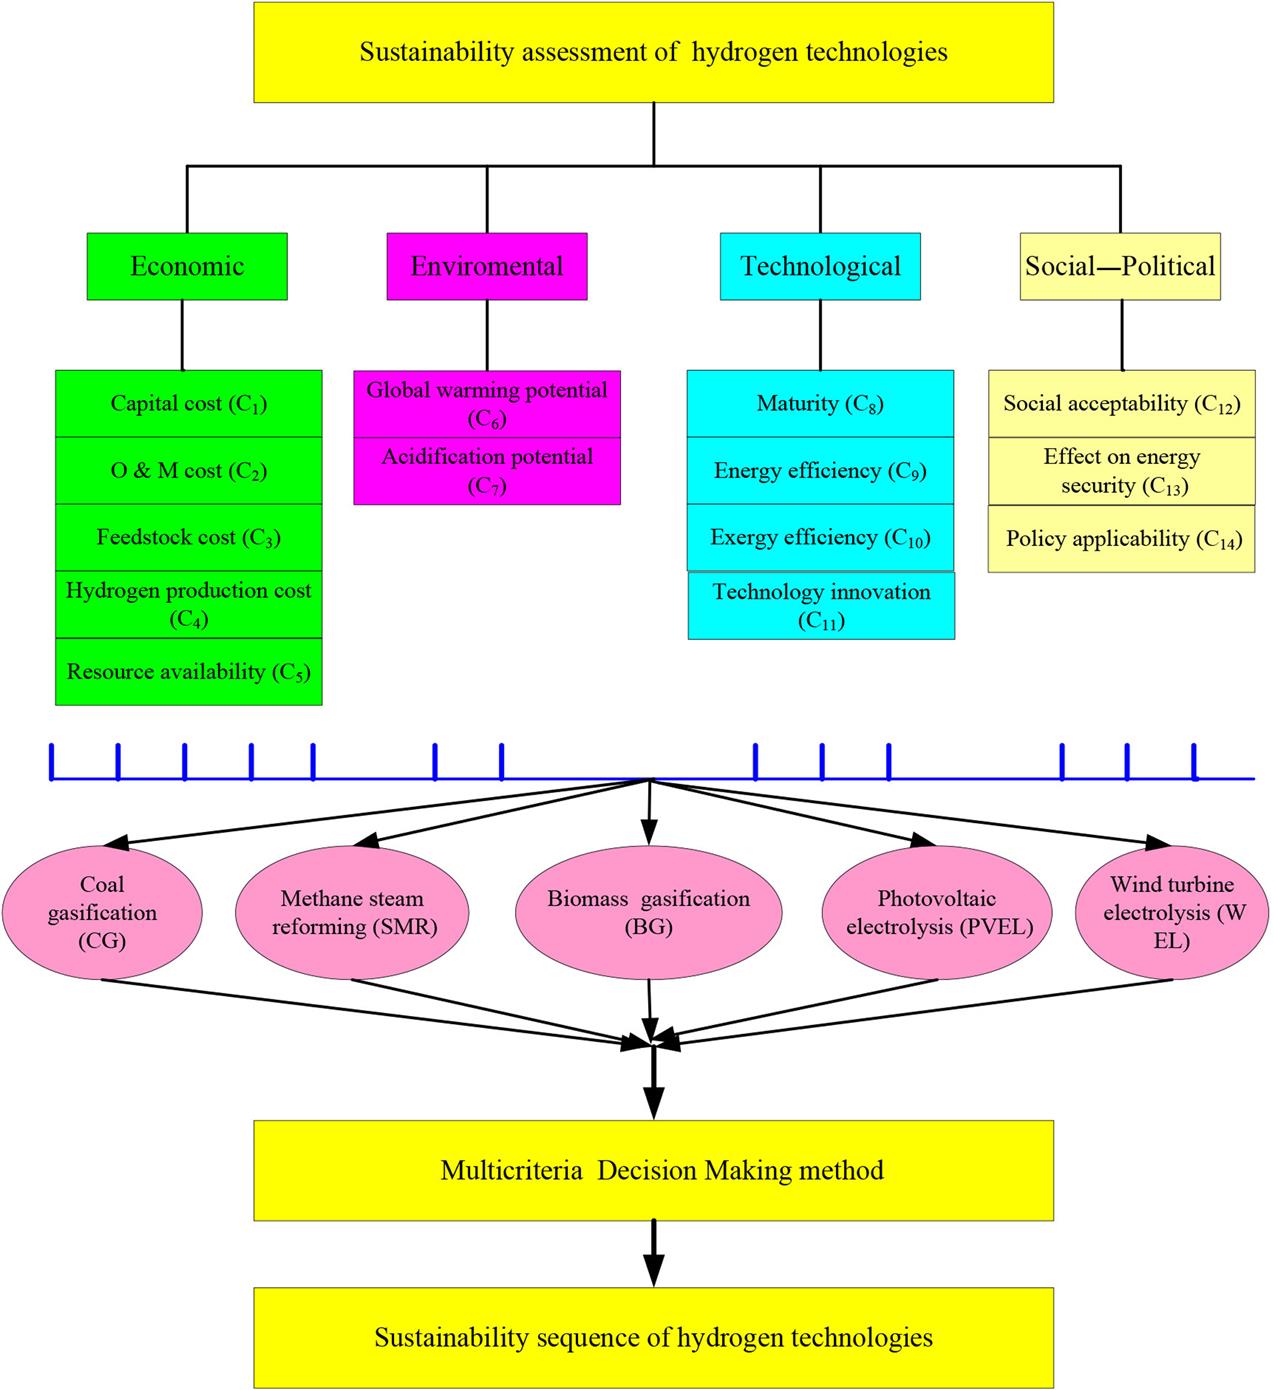
In this section, the mathematical framework of the proposed methodology was introduced (Fig. 9.1). In the methodology, the criteria system for the sustainability assessment was first established. Subsequently, the data of the alternatives with respect to each criterion were determined; the data corresponding to the hard criteria were collected from literatures, and those of the soft criteria were determined by using the fuzzy AHP method (Chang, 1996). Moreover, the fuzzy ANP method (Dagdeviren and Yuksel, 2010; Saaty, 1996) was introduced to determine the weight of each criterion. Finally, the PROMETHEE approach (Brans, 1982; Brans and Vincke, 1985) was used to prioritize the sustainability sequence of the various industrial systems, and a sensitivity analysis method was developed for identifying the most critical and sensitive criteria that have significant effects on the sustainability sequence of the alternative industrial systems.
2.1 Establishment of the Criteria System
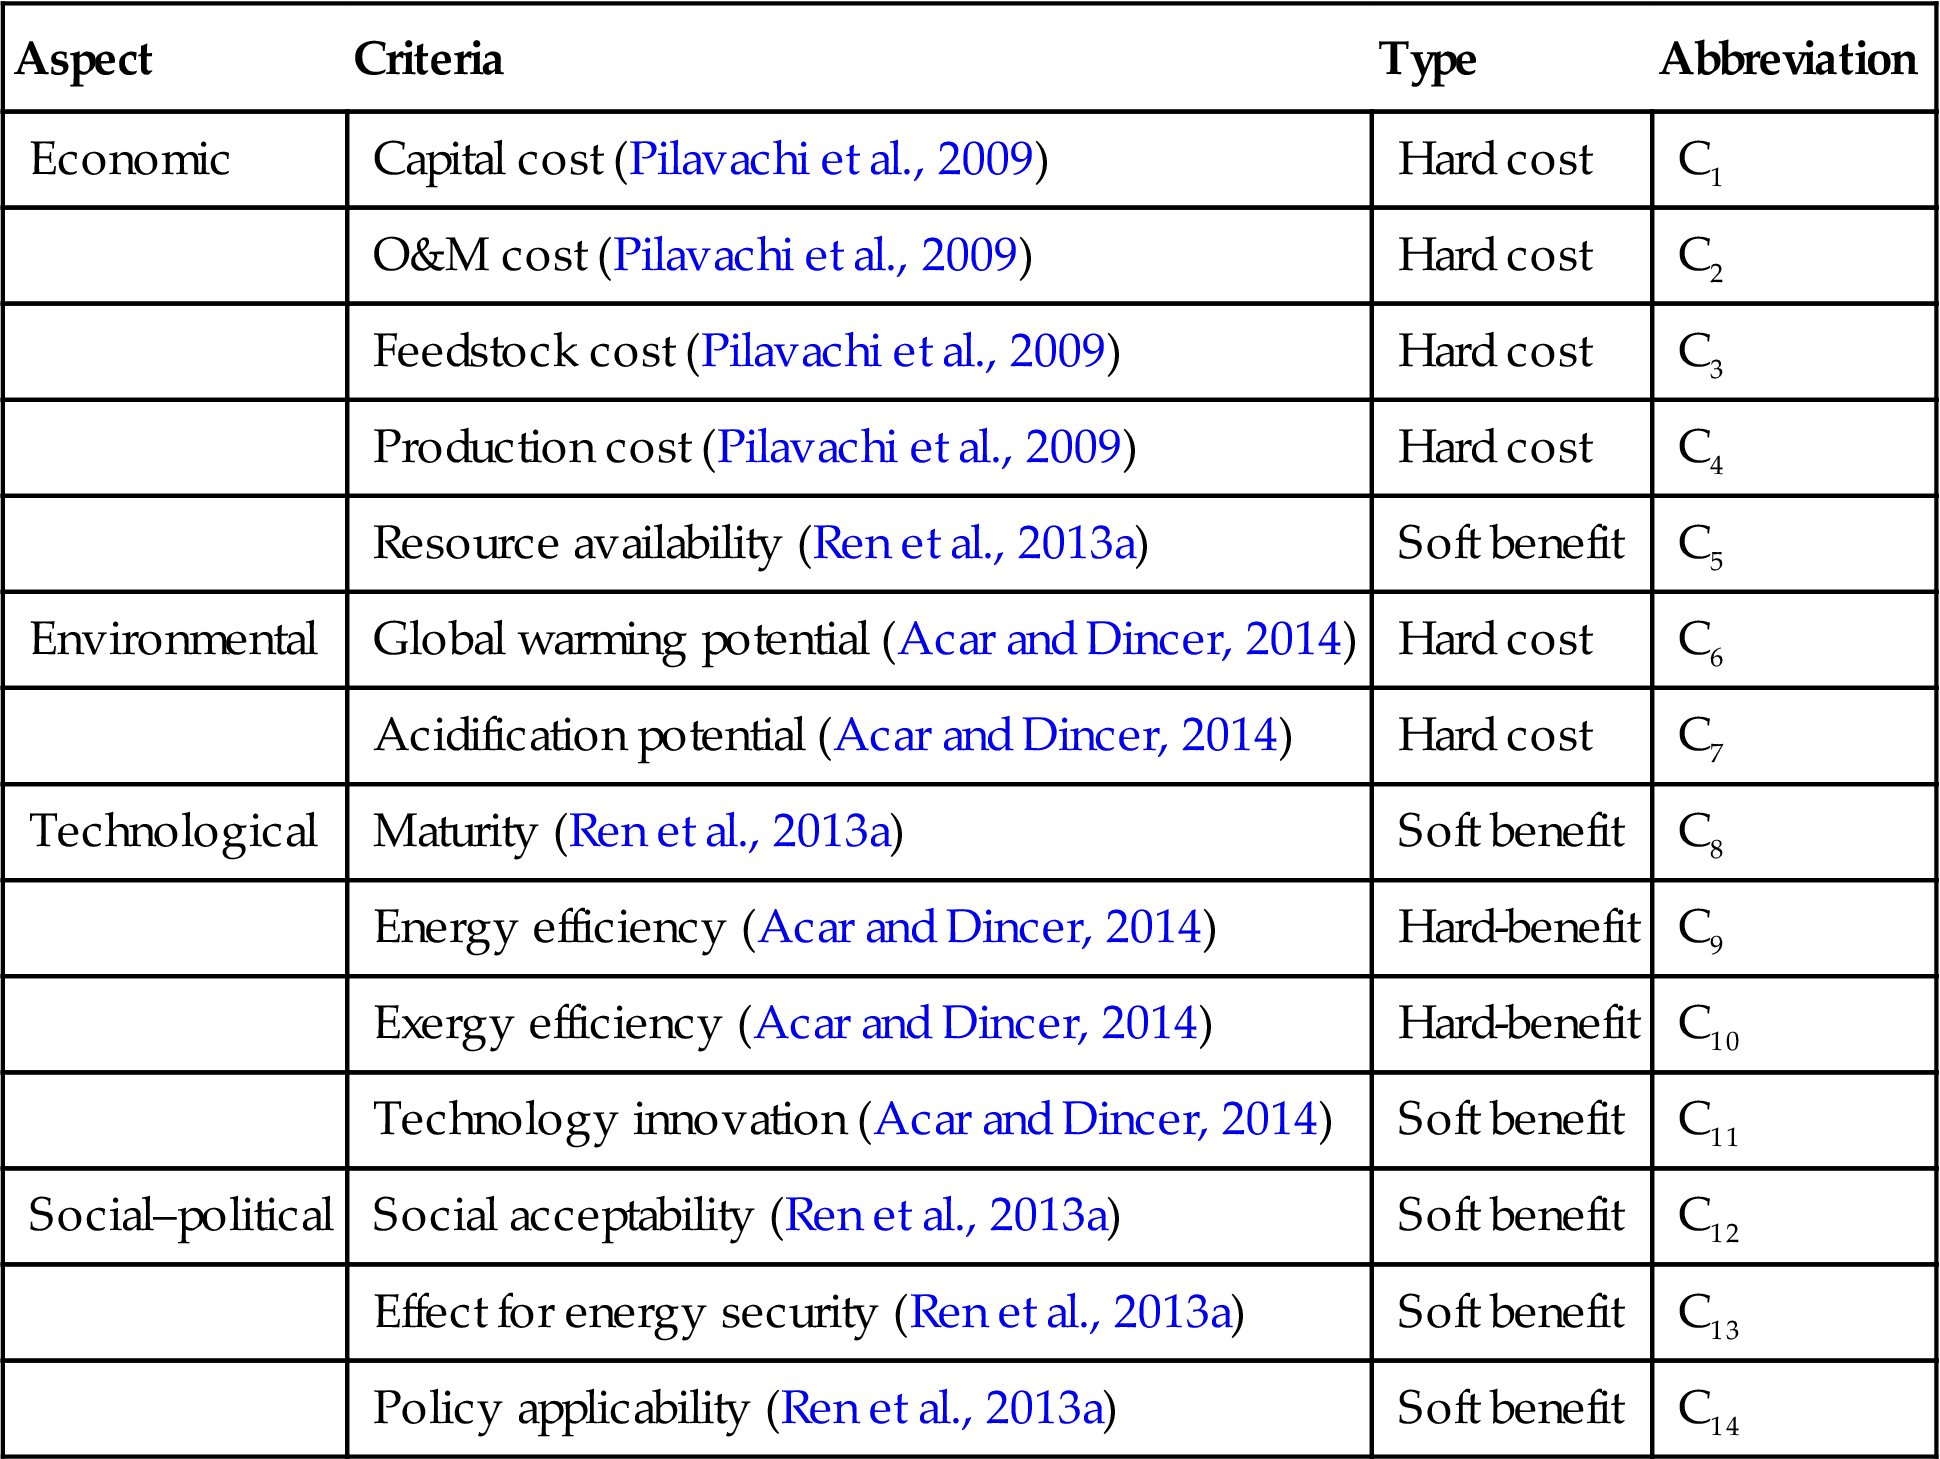
The three pillars, i.e., economic prosperity, environmental protection, and social development, are a common ground of numerous sustainability standards; therefore, the criteria system for the sustainability assessment usually consists of the economic, environmental, and social factors. While the technological and political aspects can affect the economic, environmental, and social performances (Ren et al., 2013d), the technological and political issues are also usually incorporated in the criteria systems. In this study, a total of 14 criteria concerning the four aspects, i.e., economic, environmental, technological, and social–political issues (Acar and Dincer, 2014; Jayswal et al., 2011; Li et al., 2011; Liu and Huang, 2012; Lou et al., 2004; Martins et al., 2007; Othman et al., 2010; Pilavachi et al., 2009; Piluso et al., 2010; Ren et al., 2013a; Ruiz-Mercado et al., 2012; Sadhukhan and Ng, 2011; Schwarz et al., 2002; Sikdar, 2003, 2007), were used for the sustainability assessment of various industrial systems (Table 9.1).
Table 9.1
Criteria for the Sustainability Assessment of Industrial Systems
| Aspect | Criteria | Type | Abbreviation |
| Economic | Capital cost (Pilavachi et al., 2009) | Hard cost | C1 |
| O&M cost (Pilavachi et al., 2009) | Hard cost | C2 | |
| Feedstock cost (Pilavachi et al., 2009) | Hard cost | C3 | |
| Production cost (Pilavachi et al., 2009) | Hard cost | C4 | |
| Resource availability (Ren et al., 2013a) | Soft benefit | C5 | |
| Environmental | Global warming potential (Acar and Dincer, 2014) | Hard cost | C6 |
| Acidification potential (Acar and Dincer, 2014) | Hard cost | C7 | |
| Technological | Maturity (Ren et al., 2013a) | Soft benefit | C8 |
| Energy efficiency (Acar and Dincer, 2014) | Hard-benefit | C9 | |
| Exergy efficiency (Acar and Dincer, 2014) | Hard-benefit | C10 | |
| Technology innovation (Acar and Dincer, 2014) | Soft benefit | C11 | |
| Social–political | Social acceptability (Ren et al., 2013a) | Soft benefit | C12 |
| Effect for energy security (Ren et al., 2013a) | Soft benefit | C13 | |
| Policy applicability (Ren et al., 2013a) | Soft benefit | C14 |
2.1.1 Criteria Concerning the Economic Aspect
Capital cost: It refers to the cost for the equipment, transportation, and construction of each unit.
Operation and maintenance (O&M) cost: It measures the expenses related to the operation and maintenance of each unit.
Feedstock cost: It refers to the cost of raw materials. Taking the production of bioethanol as an example, the feedstock cost refers to the cost for purchasing the raw materials like corn, wheat, cassava, crop residues, etc.
Production cost: It accounts for the total cost for manufacturing the targeted products by using different industrial systems/technologies.
Resource availability: It measures the potential reserve of the key feedstocks used in various industrial systems, and it is an indicator of the development potential of each technology/system. For instance, the different reserves of the feedstocks, e.g., Jatropha, soybean, palm oil, and rapeseed, will affect the development availability of the biodiesel production pathways using different feedstocks.
2.1.2 Criteria Concerning the Environmental Aspect
Global warming potential: It measures the emissions of greenhouse gases, e.g., CO2, CH4, and NOx emitted by alternative industrial systems with the unit of g CO2 eq.
Acidification potential: It accounts for the emissions of acids deposited into the soil and water by different industrial systems with the unit of g SO2 eq.
2.1.3 Criteria Concerning the Technological Aspect
Maturity: It measures the maturity degree of the technology by referring how widespread it is used at both international and national levels.
Energy efficiency: It refers to the ratio of the energy that can be generated by the product to the total energy required for producing the product, and therefore, it is a measure of the energy conversion efficiency.
Exergy efficiency: It refers to the ratio of the exergy that can be output by the product to the total exergy that was input for producing the product.
Technology innovation: It refers to the integrated innovation degree of each technology including the renewability, future prospect, and accessibility. It is a criterion to measure the innovation degree of each technology to substitute the conventional technologies and can also measure the effect of each technology on the diversity of resources and pathways for manufacturing a specific product.
2.1.4 Criteria Concerning the Social–Political Aspect
Social acceptability: This criterion is to measure the overall opinions of the local people on different industrial systems or technologies, and it can reflect the impacts of the hypothesized project on the society.
Effect for energy security: It measures the effect of each industrial system or technology on energy security and mitigating the dependence on energy import of a nation or region by introducing this technology as the increasing consumption of nonrenewable fossil fuels could deteriorate the energy security.
Policy applicability: It is a measure of the accordance of the industrial systems or technologies with the governmental policies, regulations, and laws. This criterion can reflect the support of each project by the government.
In the established criteria system, eight criteria, i.e., capital cost (C1), O&M cost (C2), feedstock cost (C3), production cost (C4), global warming potential (C6), acidification potential (C7), energy efficiency (C9), and exergy efficiency (C10), belong to the hard criteria. Six criteria, i.e., resource availability (C5), maturity (C8), technology innovation (C11), social acceptability (C12), effect on energy security (C13), and policy applicability (C14), are soft criteria. The hard criteria can be directly scored according to the data collected from books, papers, technical reports, and survey from the manufacture or pilot plants, etc. Whereas the soft criteria are difficult to be directly quantified by the stakeholders/decision-makers, accordingly, this study employed a fuzzy AHP method to determine the relative priorities of the alternatives with respect to the soft criteria, in which the stakeholders/decision-makers are allowed to evaluate each industrial system or technology by using linguistic terms. Moreover, it is worth pointing out that the global warming potential and acidification potential are usually measured in the life-cycle perspective; thus, it is important to use the same boundary to measure the other criteria. In other words, when the life-cycle perspective was employed in measuring the global warming potential and acidification potential, the measure of the other criteria should not be limited on the production process.
Among the 14 criteria, some are interactive and interdependent. For instance, the criterion of social acceptability (C12) is affected by the global warming potential (C6) and acidification potential (C7), while the criterion of resources availability (C5) influences the policy applicability (C14). In this study, the interdependencies among the criteria were tackled by using the fuzzy ANP method to determine the weights of each criterion with the consideration of feedbacks and interactions among the criteria.
The criteria selected in this study are the most important and also the most commonly used criteria for sustainability assessment of industrial systems. When the proposed object-oriented methodology is used to prioritize the sustainability of different industrial systems, the users should determine the suitable criteria system according to the actual conditions and their preference (e.g., data availability and information incompletion). The users can select parts of the 14 criteria, or add more criteria. For instance, the criteria of net present value, internal rate of return, payback period, and annual profit have also been widely used in the economic pillar of sustainability (Kostevsek et al., 2015). The metrics including land use change (occupied land area), water utilization, and some indicators in the life-cycle assessment [e.g., climate change, ozone depletion, human toxicity, particular matter formation, and terrestrial acidification (Goedkoop et al., 2009; Halog and Manik, 2011)] are also widely used for measuring the environmental performances. The criteria of reliability, operability, and primary energy ratio are often adopted to measure the performances of industrial systems with respect to the technological aspect (McDowall and Eames, 2007; Stamford and Azapagic, 2012; You et al., 2012). As for the social–political aspect, the number of added jobs, influence on the local culture, working conditions, health and safety, social benefits, contribution to economy development, food security, community engagement, and government support (Foolmaun and Ramjeeawon, 2013; Lehmann et al., 2013; You et al., 2012) could also be incorporated in the sustainability assessment according to the preferences of the decision-makers. However, it is worth pointing out that the accuracy of the sustainability assessment does not definitely increase with an increase in the criteria numbers as a large number of criteria may lead to the repeatability and overlaps in concepts.
2.2 Fuzzy AHP Method for Scoring the Soft Criteria
There are usually two ways for determining the relative priorities of the alternatives with respect to the soft criteria: the scaling system method (Manzardo et al., 2012; Othman et al., 2010) and the pairwise comparison method (Ren et al., 2014; Saaty, 1980). The scaling method scores the alternatives by using numbers (crisp numbers or gray numbers), while the pairwise comparison method determines the relative priorities of the alternatives via the pairwise comparison. The scaling method is simple and easy to be operated; however, it cannot assure the overall consistency among all the relative priorities of the alternatives with respect to each of the soft criteria. AHP is a widely used pairwise comparison method for determining the relative priorities of the alternatives with respect to the soft criteria (Ren et al., 2014; Saaty, 1980). However, the conventional AHP method uses nice scales (1, 2, …, 9) and their reciprocals to determine the comparison matrix and the relative priorities of the criteria, which requires the users to describe their opinions using crisp numbers. As human’s judgments are usually subjective, vague, and ambiguous, this limitation could result in the inconvenience of the users and inaccuracy of the results (Ren and Sovacool, 2014). Accordingly, this study adopted a fuzzy AHP method by combining the thoughts of the conventional AHP with the fuzzy set theory to quantify the relative priorities of the soft criteria. The fuzzy AHP method allows the stakeholders/decision-makers to describe their preferences by using linguistic variables, i.e., words or sentences in a natural or artificial languages, which is more suitable than the crisp numbers for depicting human’s judgments. The linguistic variables are in turn connected to fuzzy numbers through the membership functions (Afgan et al., 2008; Ren et al., 2015).
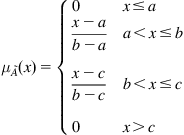
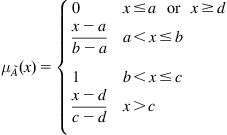
For a universe set, X, the fuzzy set A in X is characterized by a membership function ![]() , which quantifies the grade of membership of the element X to A (Amindoust et al., 2012; Mazloumzadeh et al., 2008; Zadeh, 1965). The membership functions can be of different formulation, but in practice, triangular and trapezoidal membership functions are most frequently used in the fuzzy logic as showed in Eqs. (9.1) and (9.2) (Mazloumzadeh et al., 2008), in which a, b, c, and d are parameters. For those unfamiliar to the fuzzy set theory, it also has been extensive used in some other literatures (Amindoust et al., 2012; Mazloumzadeh et al., 2008; Zadeh, 1965).
, which quantifies the grade of membership of the element X to A (Amindoust et al., 2012; Mazloumzadeh et al., 2008; Zadeh, 1965). The membership functions can be of different formulation, but in practice, triangular and trapezoidal membership functions are most frequently used in the fuzzy logic as showed in Eqs. (9.1) and (9.2) (Mazloumzadeh et al., 2008), in which a, b, c, and d are parameters. For those unfamiliar to the fuzzy set theory, it also has been extensive used in some other literatures (Amindoust et al., 2012; Mazloumzadeh et al., 2008; Zadeh, 1965).
(9.1)
 (9.1)
(9.1)
(9.2)
 (9.2)
(9.2)
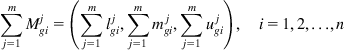
In the fuzzy AHP method, the comparison matrix is first determined by using the linguistic terms, which are then transformed into fuzzy numbers (Table 9.2) (Tseng et al., 2009). Assuming ![]() is an object set, and
is an object set, and ![]() is a goal set, then, the performance of each object regarding each goal can be analyzed; the m-extent analysis values for each object can be obtained as the following equation:
is a goal set, then, the performance of each object regarding each goal can be analyzed; the m-extent analysis values for each object can be obtained as the following equation:
(9.3)
where ![]() are the triangular fuzzy numbers.
are the triangular fuzzy numbers.
Table 9.2
The Linguistic Terms and Corresponding Fuzzy Numbers for the Pairwise Comparison (Tseng et al., 2009)
| Linguistic Scales | Abbreviations | Fuzzy Scales |
| Equal importance | E | (1,1,1) |
| Weak importance | W | (2/3,1,3/2) |
| Moderate importance | M | (1,3/2,2) |
| Fairly strong importance | FS | (3/2,2,5/2) |
| Very strong importance | VS | (2,5/2,3) |
| Absolute importance | A | (5/2,3,7/2) |
| Reciprocals of these | RW, RM, RFS, RVS, RA | The reciprocals of these fuzzy numbers |
Subsequently, the fuzzy AHP method is conducted according to the followed four steps as developed by Chang (1996) (Choudhary and Shankar, 2012; Heo et al., 2010; Tseng et al., 2009).
Step 1: The value of the fuzzy synthetic extent with respect to the ith object is defined as the following equation:
(9.4)
 (9.4)
(9.4)
where ![]() and
and ![]() can be determined according to Eqs. (9.5) and (9.6), respectively.
can be determined according to Eqs. (9.5) and (9.6), respectively.
(9.5)
 (9.5)
(9.5)
(9.6)
 (9.6)
(9.6)
Step 2: The degree of possibility of ![]() is defined as the following equation:
is defined as the following equation:
(9.7)
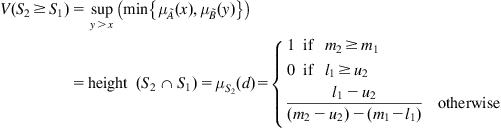 (9.7)
(9.7)
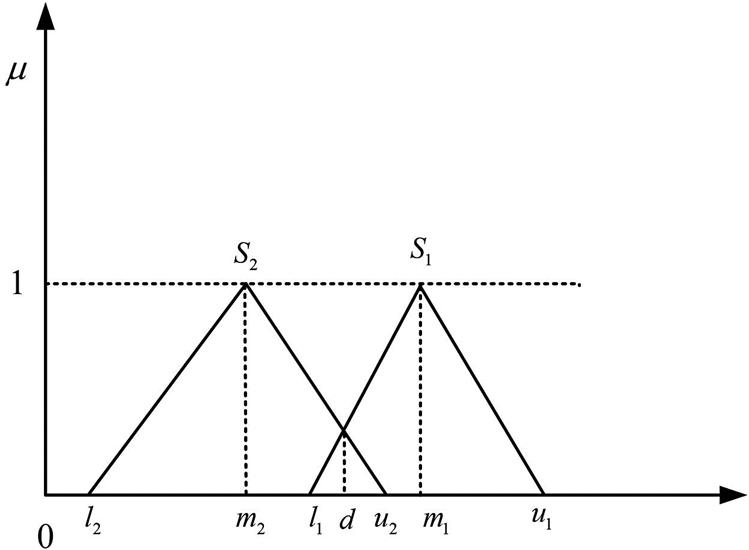
where d is the ordinate of the highest intersection point between ![]() and
and ![]() as illustrated in Fig. 9.2. Both
as illustrated in Fig. 9.2. Both ![]() and
and ![]() are necessary for comparing
are necessary for comparing ![]() and
and ![]() .
.
Step 3: The degree of possibility for a convex fuzzy number to be greater than the convex fuzzy number ![]() is defined by the following equation:
is defined by the following equation:
(9.8)
 (9.8)
(9.8)Assuming that
(9.9)
Then, the weight vector of the n elements ![]() can be determined by the following equation:
can be determined by the following equation:
(9.10)
where ![]() is the weight of the ith element
is the weight of the ith element ![]() , and
, and ![]() is the weight vector.
is the weight vector.
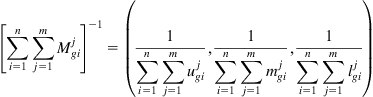
Step 4: The weight vector in Eq. (9.10) is normalized to obtain the weight of each element according to Eqs. (9.11) and (9.12), respectively. In Eq. (9.11), W is a nonfuzzy number.
(9.11)
(9.12)
 (9.12)
After the normalization, the weights of the criteria satisfy the following equation:
(9.13)
where ![]() is the normalized weight of the ith element
is the normalized weight of the ith element ![]() , and
, and ![]() is the normalized weight vector.
is the normalized weight vector.
2.3 Fuzzy ANP Method
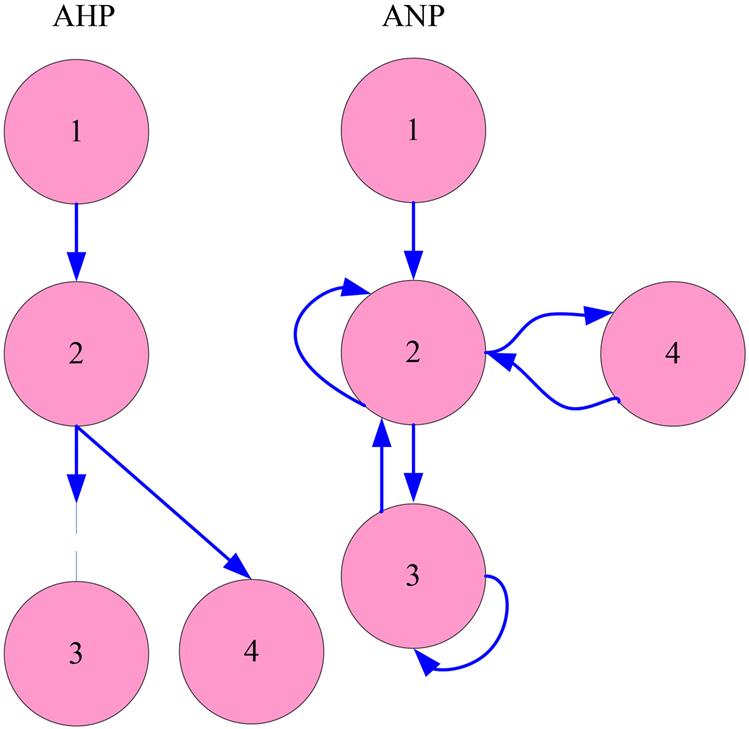
ANP is a widely used MCDM technique that was derived from the AHP method (Saaty, 1996). The original AHP method was developed by Saaty in the 1970s to rank the priority sequence associated with the alternatives of a specific problem in a ratio scale by combining the tangible and intangible aspects (Dagdeviren and Yuksel, 2010; Escobar and Moreno-Jimenez, 2002; Saaty, 1980). However, the method is unable to deal with any kinds of interdependence between the evaluation criteria; thus, it cannot be used to solve the decision-making problems that involve the interactions between the assessment factors (Xu and Chan, 2013). Accordingly, the ANP method was developed by extending the AHP technique to address the MCDM problems with interactions and interdependencies among the alternatives or criteria (Dagdeviren and Yuksel, 2010; Luo et al., 2010; Saaty, 1996; Xu and Chan, 2013). The structural difference between ANP and AHP (Fig. 9.3) is that AHP represents a framework with a unidirectional hierarchical relationship, while ANP uses a hierarchical networks with feedback approaches among decision levels and attributes (Atmaca and Basar, 2012; Dagdeviren and Yuksel, 2010). However, the conventional ANP method is based on the AHP method, it does not perform well when facing the subjectivity, vagueness, and ambiguity existed in human’s judgments as discussed above. Thus, the fuzzy ANP method was employed for determining the weights of the criteria in this study, and its procedure usually consists of four steps as showed in Fig. 9.4 (Atmaca and Basar, 2012; Lee et al., 2009a; Xu and Chan, 2013).
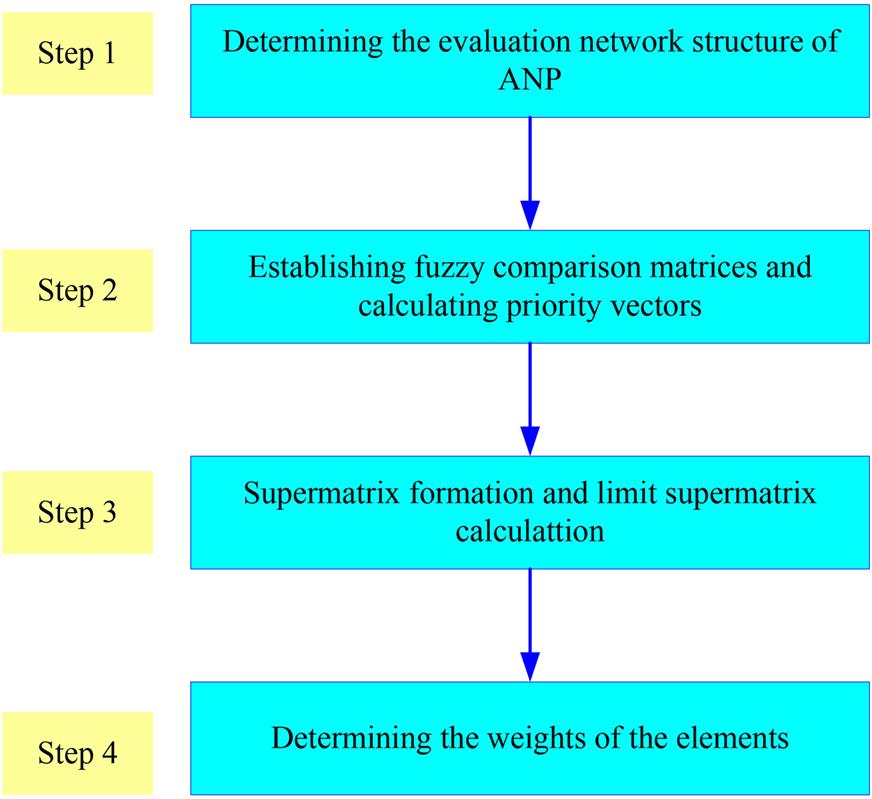
Step 1: Determining the evaluation network structure. According to the principle of ANP and the evaluation criteria, the evaluation network structure with the clarified relationships between the criteria or alternatives is to be established in this step.
Step 2: Establishing the fuzzy comparison matrices and calculating priority vectors. The fuzzy comparison matrices for pairwisely comparing the elements of each cluster are to be established in this step. After the matrices are established, the local priority vectors for each pairwise comparison matrix can be obtained by using the fuzzy AHP method (Chang, 1996). It is worth pointing out that the determination of the fuzzy comparison matrices should be based on a group decision-making, e.g., a focus group, a seminar, or a teleconference of the experts in the related areas including professors, senior engineers, government officials (investors and administrative executors), etc. During the group decision-making process, a consensus about the interdependencies and interactions among the criteria was achieved by exchanging opinions and discussion, which ensure the decision-making to incorporate the preferences/willingness of all the stakeholders and to avoid the inconsistencies existing in the opinions of the decision-makers.
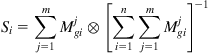
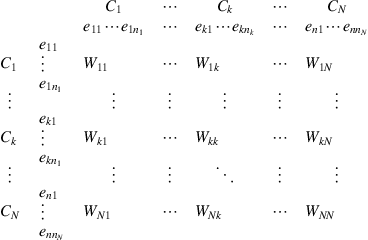
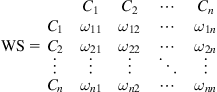
Step 3: Calculating the supermatrix, weighted supermatrix formation, and limit supermatrix. In this step, the global priorities of a specific system with the interdependent factors are obtained by inputting the local priority vectors in the appropriate columns of a matrix. Assuming Ck to be the kth cluster (k=1, 2, …, N) that has nk elements (ek1, ek2, …, enk), the standard form of a supermatrix is as Eq. (9.14). In the supermatrix, the segment, Wij, represents the relationship between the ith cluster and the jth cluster; each column of Wij is the local priority vector obtained from the corresponding pairwise comparison matrix, indicating the relative importance of the elements in the ith cluster to an element in the jth cluster (Xu and Chan, 2013).
Subsequently, the pairwise comparisons are carried out between the clusters to determine the weight matrix, in which each column represents the relative effects between the other clusters on a specific cluster with respect to the corresponding criterion and the numerical sum of the elements in each column is 1. Then, according to the weight matrix, the supermatrix is normalized to obtain the weighted supermatrix, which is subsequently transformed into the limit supermatrix by raising it to powers for ensuring the convergence of the matrix (Xu and Chan, 2013).
(9.14)
 (9.14)
Step 4: Obtaining the final weights of each elements.
The elements in each row of the limit supermatrix are same, and the value indicates the relative importance of each element. Then, the relative weights of the elements can be obtained by normalizing the limit supermatrix.
2.4 PROMETHEE Method for the Sustainability Prioritization
The prioritization of alternative industrial systems is a typical MCDM problem, the stakeholders/decision-makers have to select the most sustainable scenario from a variety of pathways by considering multiple criteria. Among the various MCDM methods available in the literatures, e.g., technique for order preference by similarity to ideal solution (TOPSIS) (Gharakhlou et al., 2010), data envelopment analysis (Ren et al., 2013c), elimination Et Choix Traduisant la REalité (Cavallaro, 2010), gray relational analysis (GRA) (Manzardo et al., 2012), the method of PROMETHEE has the advantages of highly efficient and easy to be used and operated due to its lower level of complexity (Cavallaro, 2009; Parreiras and Vasconcelos, 2007).
PROMETHEE, developed by Brans and Vincke in 1980s to rank the alternatives using the outranking principle, is a collective name of the PROMETHEE family including PROMETHEE I (partial ranking), PROMETHEE II (complete ranking), PROMETHEE III (ranking based on intervals), PROMETHEE IV (continuous case), PROMETHEE V (PROMETHEE II and integer linear programming), PROMETHEE VI (weights of the criteria are intervals), and PROMETHEE GAIA (graphical representation of PROMETHEE). One of the main advantages of PROMETHEE over other outranking methods is that the decision-makers can easily understand the concepts and parameters inherent in the method, which makes it simpler to be operated and consequently increases the effectiveness (Silva et al., 2010). In this study, PROMETHEE II (complete ranking) was selected as the decision-making tool for prioritizing the sustainability sequence of alternative industrial systems.
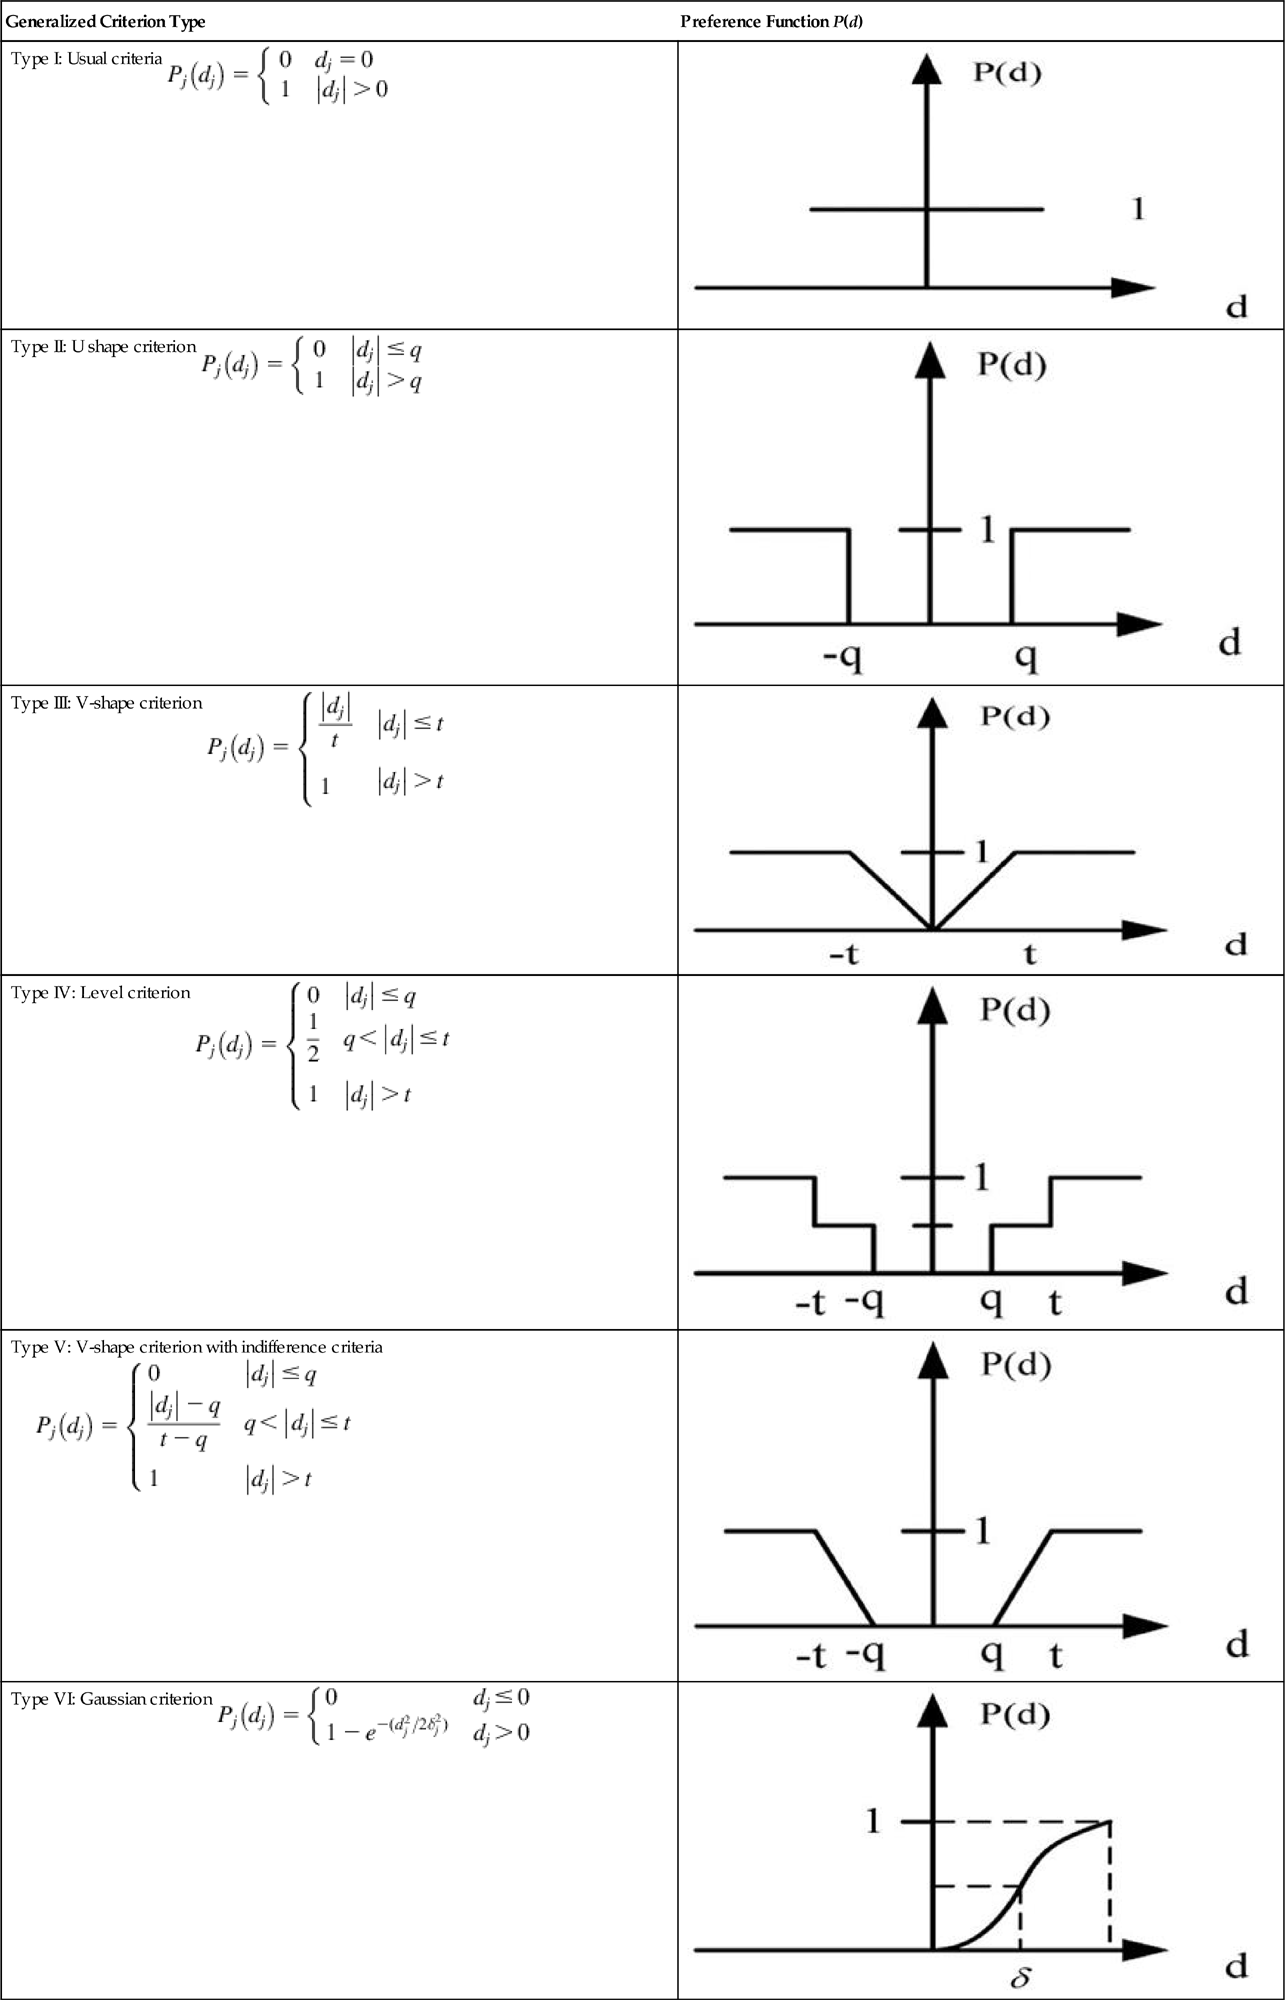
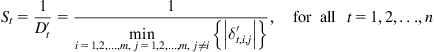
In PROMETHEE II, a complete preorder (complete ranking) of the alternatives is obtained according to the calculated net flow from each alternative. The analysis procedures include three steps: (1) establishment of the decision-making matrix with the data of the alternatives with respect to each criterion and the weights of the criteria; (2) selection of a preference function, by which the difference between two alternatives regarding a criterion was transformed into a value between 0 and 1; (3) calculation of the net outranking flow of the alternatives with respect to each criterion as the preference index to prioritize the alternatives (Chou et al., 2007). Among the three steps, the selection of the preference function is very critical, it can significantly affect the accuracy of the sustainability assessment. There are usually six types of preference functions corresponding to the six types of generalized criteria (see Table 9.3) (Chou et al., 2007). Among them, the Gaussian type preference function was selected in this study due to its advantages of sensitive to small variations of the PROMETHEE II input parameters (Ren et al., 2014) and containing continuity (Albadvi et al., 2007). In the Gaussian criterion as showed in Table 9.3, δj is defined as the threshold value and could be obtained by calculating the average variance of the jth criterion, and dj represents the numerical difference of two alternatives regarding to each criterion.
Table 9.3
Shape of the Six Types of Generalized Criteria (Albadvi et al., 2007)
| Generalized Criterion Type | Preference Function P(d) |
| Type I: Usual criteria |
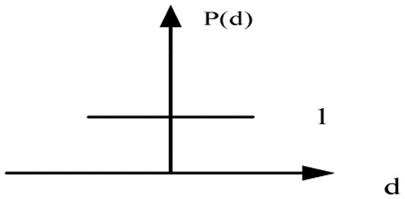 |
| Type II: U shape criterion |
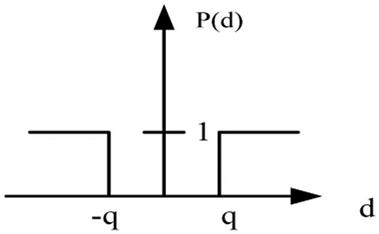 |
Type III: V-shape criterion 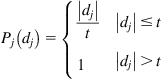 |
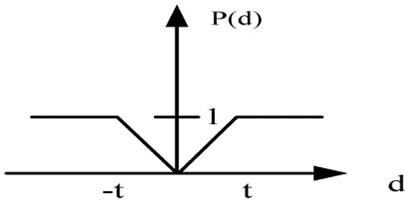 |
Type IV: Level criterion 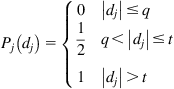 |
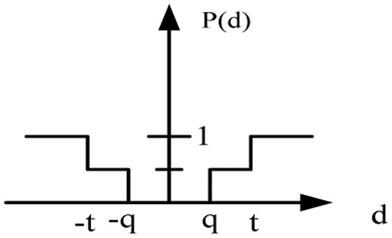 |
Type V: V-shape criterion with indifference criteria 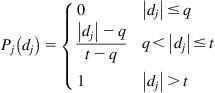 |
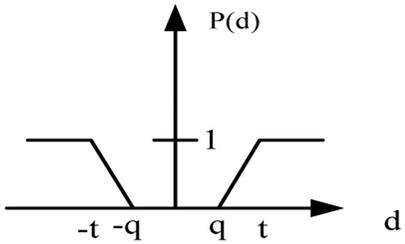 |
| Type VI: Gaussian criterion |
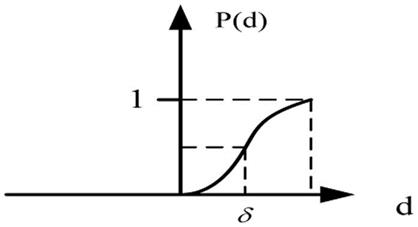 |
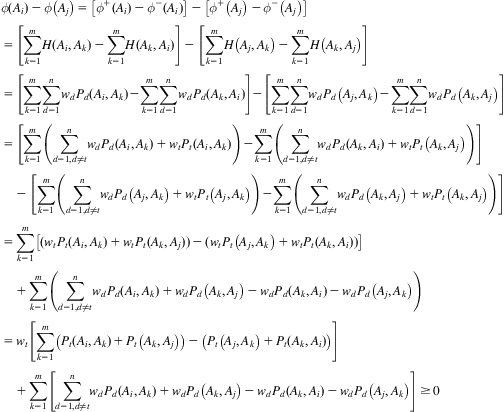
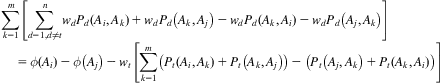
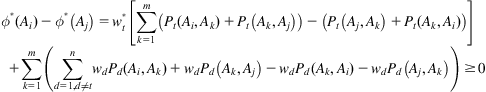
In the PROMETHEE II method, the multicriteria preference index for a pair of alternatives Ai and Ak is defined as the following equation:
(9.15)
where ![]() is the preference function,
is the preference function, ![]() is the weights of the jth criterion calculated by using the ANP method. The positive outranking flow and negative outranking flow of an alternative can be calculated by Eqs. (9.16) and (9.17), respectively.
is the weights of the jth criterion calculated by using the ANP method. The positive outranking flow and negative outranking flow of an alternative can be calculated by Eqs. (9.16) and (9.17), respectively.
(9.16)
(9.17)
Then, the net outranking flow of an alternative can be calculated by the following equation:
(9.18)
As the net outranking flow indicates how much each alternative is preferred to the others, its value can be used to rank the alternatives, i.e., a higher value of the net outranking flow corresponds to a better alternative (Albadvi et al., 2007; Parreiras and Vasconcelos, 2007). The standards can be described as Eqs. (9.19)–(9.20).
(9.19)
(9.20)
where “![]() ” represents “superior to,” ~ represents “no difference.”
” represents “superior to,” ~ represents “no difference.”
It is noteworthy that the values of the net outranking flow for the alternatives with respect to each criterion should be first transformed into dimensionless values, and the linear transformation method proposed by Hajkowicz and Higgins was adopted in this study. Meanwhile, the 14 criteria can be divided into 2 categories according to their effects: benefit criteria and cost criteria. The greater the value of an industrial system with respect to a benefit criterion, the more superior the industrial system will be. On the contrary, the greater the value of an industrial system with respect to a cost criterion, the less superior the industrial system will be. Accordingly, resource availability, maturity, energy efficiency, exergy efficiency, technology innovation, social acceptability, effect on energy security, and policy applicability belong to the benefit criteria, and the other six criteria belong to the cost criteria. Both the benefit criteria and cost criteria can be normalized after the transformation. Moreover, the cost criteria can also be transformed into benefit criteria after this process.
2.5 Sensitivity Analysis Method
In order to identify the most critical and sensitive criteria that have a significant effect on the sustainability sequence and to investigate the influence of the interactions and interdependencies among the criteria on the results, a novel sensitivity analysis method was developed by extending the method proposed by Triantaphyllou and Sanchez (1997).
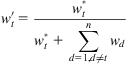
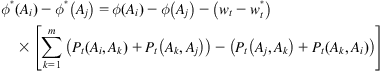
Assuming ![]() according to the PROMETHEE method, the decision-makers want to alter the current ranking by modifying the weight of one criterion. With the tth criterion as an example, Eqs. (9.21) and (9.22) can be obtained.
according to the PROMETHEE method, the decision-makers want to alter the current ranking by modifying the weight of one criterion. With the tth criterion as an example, Eqs. (9.21) and (9.22) can be obtained.
(9.21)
 (9.21)
(9.22)
 (9.22)
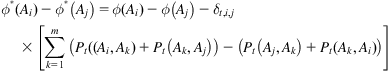
Assuming that for reversing the current ranking of ![]() and
and ![]() , the minimum quantity of the weight of the tth criterion that has to be changed is
, the minimum quantity of the weight of the tth criterion that has to be changed is ![]() ; then, the modified weight of the tth criterion,
; then, the modified weight of the tth criterion, ![]() , is
, is
(9.23)
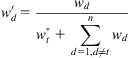
In order to satisfy Eq. (9.13), the weight should be renormalized according to Eqs. (9.24) and (9.25).
(9.24)
 (9.24)
(9.25)
 (9.25)
where ![]() represents the new normalized weight of the tth criterion, and
represents the new normalized weight of the tth criterion, and ![]() represents the new normalized weight of the dth criterion.
represents the new normalized weight of the dth criterion.
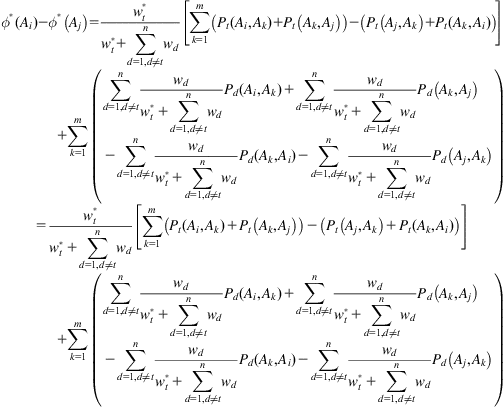
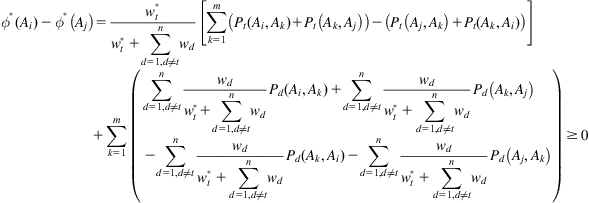
According to Eq. (9.21), the new relationship between the net outranking flow of the ith alternative and that of the jth alternative is as Eq. (9.26), in which ![]() and
and ![]() represent the net flow of the ith alternative and the jth alternative, respectively.
represent the net flow of the ith alternative and the jth alternative, respectively.
In order to reverse the ranking of ![]() and
and ![]() ,
, ![]() should be greater than 0 according to Eq. (9.19). Accordingly, Eq. (9.27) should be satisfied.
should be greater than 0 according to Eq. (9.19). Accordingly, Eq. (9.27) should be satisfied.
(9.26)
 (9.26)
(9.27)
 (9.27)
Multiply Eq. (9.27) by ![]() , we could obtain Eq. (9.28).
, we could obtain Eq. (9.28).
(9.28)
 (9.28)
By integrating Eq. (9.28) with Eq. (9.22), Eq. (9.29) can be obtained.
(9.29)
 (9.29)
Similarly, Eq. (9.30) can be obtained by integrating Eqs. (9.29) and (9.23).
(9.30)
 (9.30)
Finally, Eq. (9.31) can be obtained.
(9.31)
According to Eq. (9.31), if ![]() , Eq. (9.32) should be satisfied.
, Eq. (9.32) should be satisfied.
(9.32)
 (9.32)
While if ![]() , Eq. (9.33) should be satisfied.
, Eq. (9.33) should be satisfied.
(9.33)
 (9.33)
It is worth pointing out that it is impossible to reverse the ranking of ![]() and
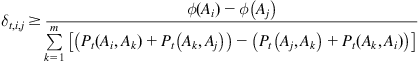
and ![]() by changing the weights of the criteria if Eq. (9.34) is satisfied, which indicates that
by changing the weights of the criteria if Eq. (9.34) is satisfied, which indicates that ![]() dominates
dominates ![]() . Meanwhile, Eq. (9.23) should be nonnegative, implying that
. Meanwhile, Eq. (9.23) should be nonnegative, implying that ![]() . A criterion is considered to be robust if any change of its weight cannot alter the ranking of each pair of alternatives; in another word, the tth criterion is considered to be robust if all the
. A criterion is considered to be robust if any change of its weight cannot alter the ranking of each pair of alternatives; in another word, the tth criterion is considered to be robust if all the ![]() associated to it will all satisfy the following equation:
associated to it will all satisfy the following equation:
(9.34)
Dividing ![]() by wt, we can get the minimum percentage,
by wt, we can get the minimum percentage, ![]() , to change the weight of the ith criterion for reversing the ranking of
, to change the weight of the ith criterion for reversing the ranking of ![]() and
and ![]() .
.
(9.35)
Subsequently, the following four definitions were introduced to investigate the criticality degree (CD) and the sensitivity coefficient (SC) of the assessment criteria according to Triantaphyllou et al. (2013) and Triantaphyllou and Sanchez (1997):
Definition 1: The percentage-top (PT) critical criterion is the criterion corresponding to the smallest ![]() value (
value (![]() is the best alternative,
is the best alternative, ![]() and
and ![]() ).
).
Definition 2: The percentage-any (PA) critical criterion is the criterion corresponding to the smallest ![]() value (
value (![]() ,
, ![]() and
and ![]() ).
).
Definition 3: The CD of the tth criterion, ![]() , is the smallest
, is the smallest ![]() (
(![]() , and
, and ![]() ).
).
(9.36)
Definition 4: The SC of the tth criterion, ![]() , is the reciprocal of the CD.
, is the reciprocal of the CD.
(9.37)
 (9.37)
After determining the most critical criteria and the criteria that have the greatest SC, the sensitivity analysis of the interactions and interdependencies among the criteria on the ranking sequence can be conducted by changing the weights of the columns with respect to the specific criterion. For instance, for the weighted supermatrix determined by the ANP method for calculating the weights of n criteria, as presented in Eq. (9.38), the analysis of the interactions and interdependencies associated with the tth criterion on the final ranking of the alternatives can be carried out by three steps:
(9.38)
 (9.38)
where WS represents the weighted matrix, and ![]() represents the relative effects of the ith criterion on the jth criterion.
represents the relative effects of the ith criterion on the jth criterion.
Step 1: Changing the weights of the tth column in the weighted supermatrix (the relative effects of other criteria on the tth criterion) to recalculate the final weight of each criterion.
Step 2: Running the PROMETHEE method by using the weights of the criteria determined in Step 1.
Step 3: Comparing the final rankings under different interactions and interdependencies associated to the tth criterion.
3 Case Study
In order to illustrate the proposed method, the sustainability of the industrial systems of hydrogen production with five alternative pathways, i.e., coal gasification (CG), stream reforming of methane (SMR), biomass gasification (BG), photovoltaic electrolysis (PVEL), and wind turbine electrolysis (WEL) was prioritized (Fig. 9.5) with the intention to compare the conventional technologies (CG, SMR) with the renewable source-based technologies (BG) and the renewable energy-based technologies (PVEL and WEL).
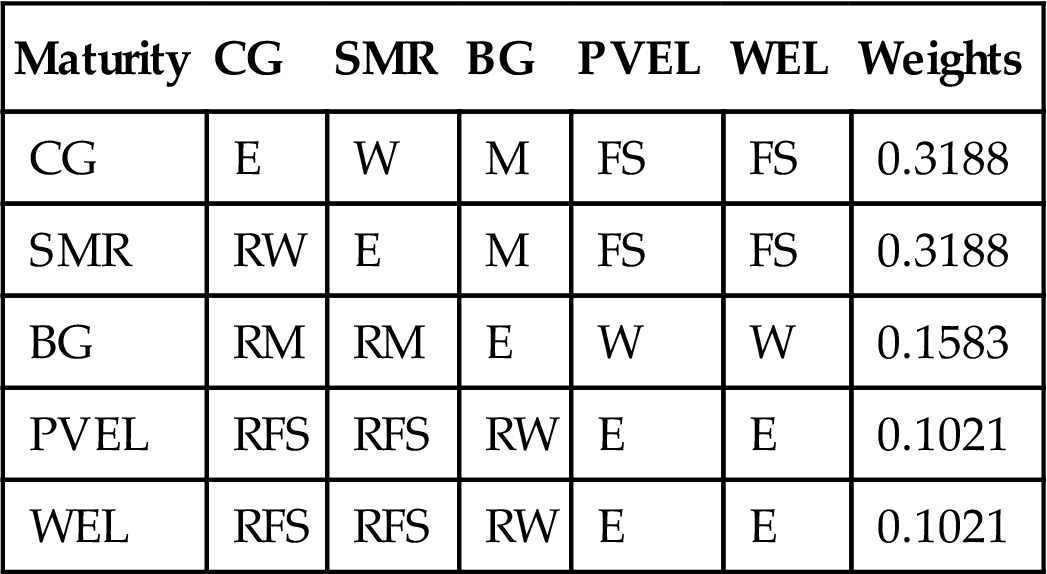
Among the 14 criteria concerning the four aspects of the sustainability, the data of each pathway regarding the 8 hard criteria were obtained from the literatures (Table 9.4) (Acar and Dincer, 2014; Ozbilen et al., 2011; Pilavachi et al., 2009) with some data being deduced from the reference (Acar and Dincer, 2014). It is worth pointing out that all the obtained data focus on the production process. As for the six soft criteria, the representative experts in the areas of renewable energies, sustainability engineering, and energy planning were invited to fill a survey and their views on different production technologies regarding the six criteria were collected by using linguistic terms. The comparison matrices were then obtained by incorporating the experts’ views with the information from the supporting materials like papers, books, and technological reports about the different hydrogen production technologies. Subsequently, the fuzzy AHP method was used to determine the priority of the five technologies with respect to each qualitative criterion. As an example, the priority of the five scenarios regarding the criterion of “resource availability” was determined according to the followed procedure. The comparison matrix for evaluating the five pathways regarding the criterion using linguistic terms was first established (Table 9.5). Then, the linguistic terms were transformed into fuzzy numbers according to Table 9.2 to achieve the corresponding comparison matrix using fuzzy numbers (Table 9.6). Taking the cell (1,2) in Table 9.5 as an example, the element W can be transformed into (2/3, 1, 3/2). The values of the fuzzy synthetic extent of the five pathways with respect to the goal (resource availability) were then calculated according to Eqs. (9.4)–(9.6).
Table 9.4
Values of the Hard Criteria for Each Hydrogen Production Pathway (Acar and Dincer, 2014; Ozbilen et al., 2011; Pilavachi et al., 2009)
| Unit | CG | SMR | BG | PVEL | WEL | |
| C1 | US$ day−1 kg−1 | 1637.19 | 284.77 | 104.82 | 10,448.56 | 3170.86 |
| C2 | US$ day−1 kg−1 | 54.9 | 14.51 | 52.56 | 15.71 | 15.71 |
| C3 | US$ day−1 kg−1 | 120.15 | 154.32 | 194.88 | 0 | 0 |
| C4 | US$ day−1 kg−1 | 22.37 | 32.75 | 23.78 | 17.36 | 36.75 |
| C6 | g CO2 eq kg−1 | 17,000 | 12,000 | 2992 | 2000 | 1200 |
| C7 | g SO2 eq kg−1 | 30.69 | 14.516 | 29.03 | 8.07 | 2.58 |
| C9 | – | 0.35 | 0.375 | 0.65 | 0.05 | 0.31 |
| C10 | – | 0.315 | 0.315 | 0.60 | 0.04 | 0.30 |
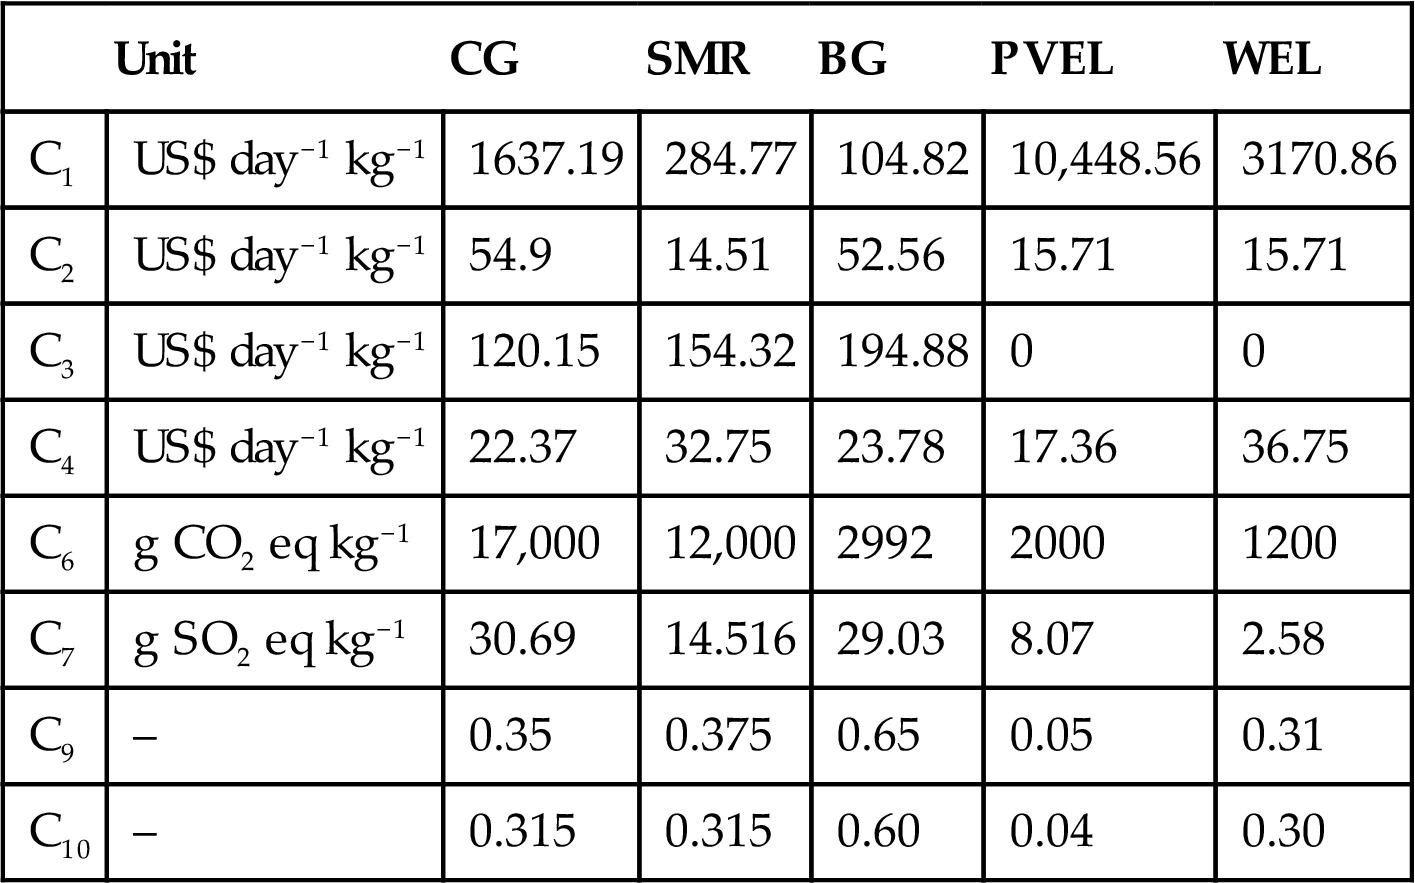
Table 9.5
Comparison Matrix for the Evaluation of Five Hydrogen Production Pathways with Respect to the Criterion of “Resource Availability” Using Linguistic Terms
| Resource Availability | CG | SMR | BG | PVEL | WEL |
| CG | E | W | RVS | RA | RA |
| SMR | RW | E | RVS | RA | RA |
| BG | VS | VS | E | RW | RW |
| PVEL | A | A | W | E | E |
| WEL | A | A | W | E | E |
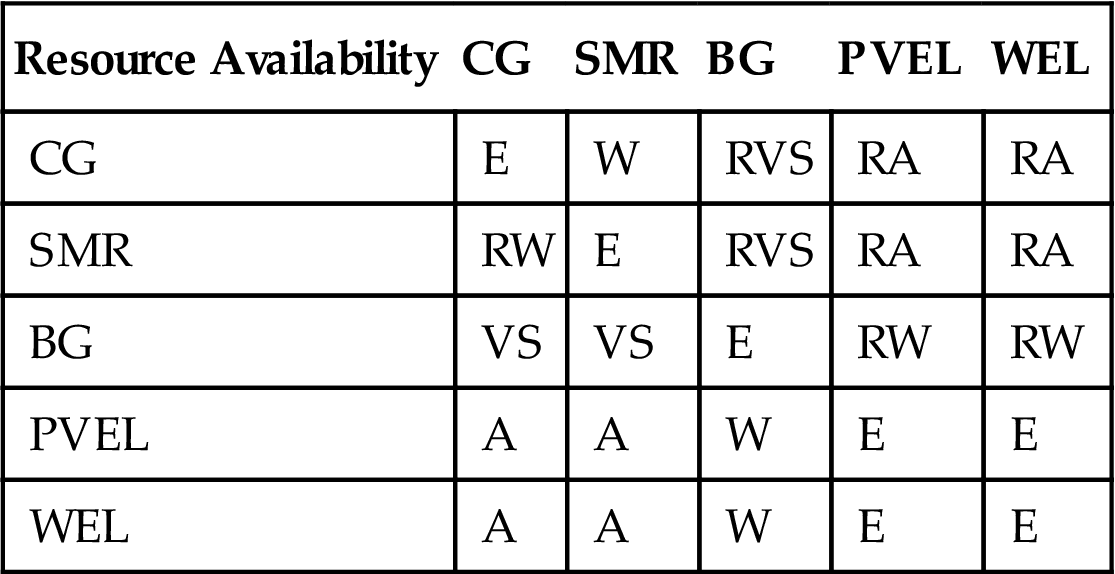
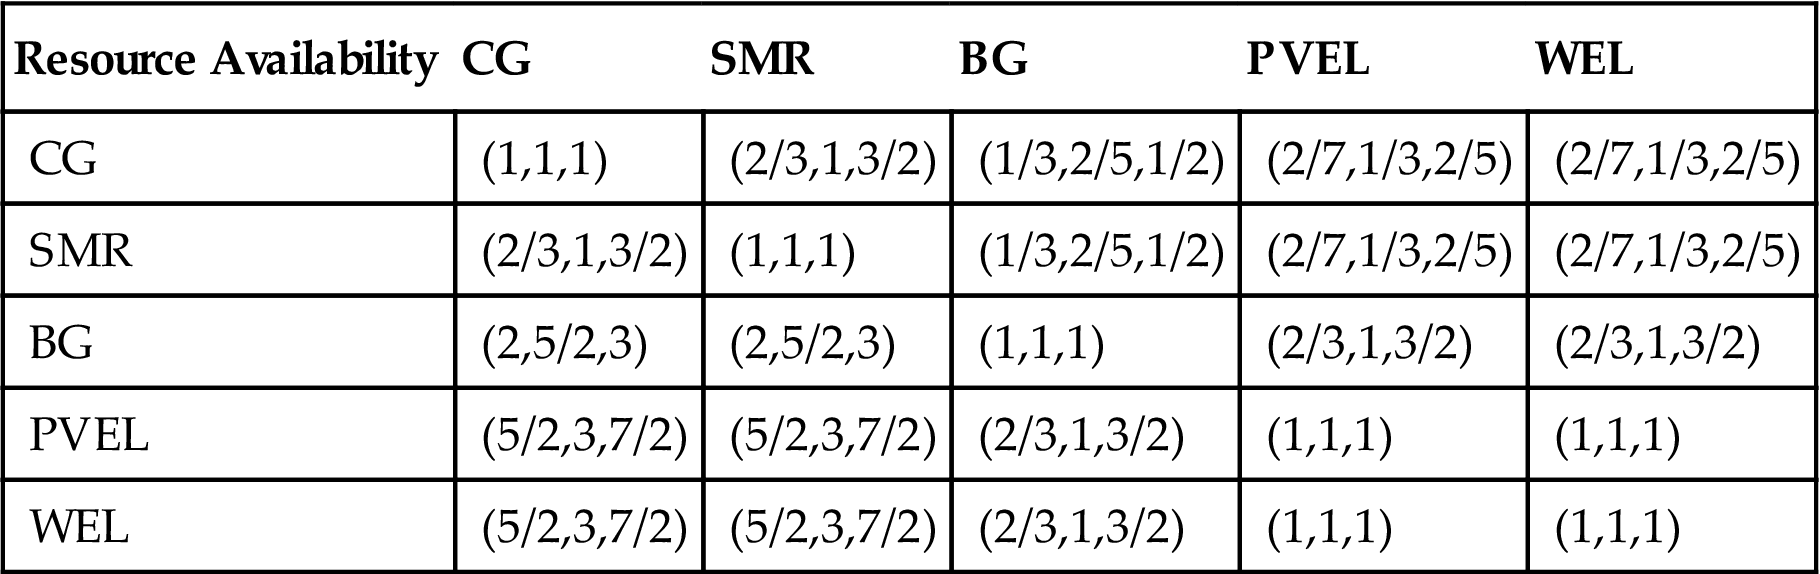
Table 9.6
Comparison Matrix for the Evaluation of Five Hydrogen Production Pathways with Respect to the Criterion of “Resource Availability” Using Fuzzy Members
| Resource Availability | CG | SMR | BG | PVEL | WEL |
| CG | (1,1,1) | (2/3,1,3/2) | (1/3,2/5,1/2) | (2/7,1/3,2/5) | (2/7,1/3,2/5) |
| SMR | (2/3,1,3/2) | (1,1,1) | (1/3,2/5,1/2) | (2/7,1/3,2/5) | (2/7,1/3,2/5) |
| BG | (2,5/2,3) | (2,5/2,3) | (1,1,1) | (2/3,1,3/2) | (2/3,1,3/2) |
| PVEL | (5/2,3,7/2) | (5/2,3,7/2) | (2/3,1,3/2) | (1,1,1) | (1,1,1) |
| WEL | (5/2,3,7/2) | (5/2,3,7/2) | (2/3,1,3/2) | (1,1,1) | (1,1,1) |
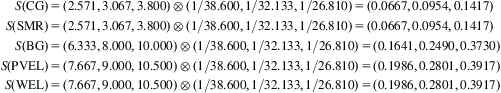
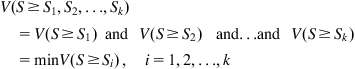
The degree of possibility (V values) for ![]() was subsequently determined according to Eq. (9.7) as presented in Table 9.7. Thereafter, the minimum degree of possibility was determined according to Eqs. (9.8)–(9.10).
was subsequently determined according to Eq. (9.7) as presented in Table 9.7. Thereafter, the minimum degree of possibility was determined according to Eqs. (9.8)–(9.10).
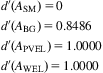
Table 9.7
The Degree of Possibility (V values) for Si ≥ Sj
| SCG | SSMR | SBG | SPVEL | SWEL | |
| SCG | – | 1.0000 | 0.0000 | 0.0000 | 0.0000 |
| SSMR | 1.0000 | – | 0.0000 | 0.0000 | 0.0000 |
| SBG | 1.0000 | 1.0000 | – | 0.8486 | 0.8486 |
| SPVEL | 1.0000 | 1.0000 | 1.0000 | – | 1.0000 |
| SWEL | 1.0000 | 1.0000 | 1.0000 | 1.0000 | – |
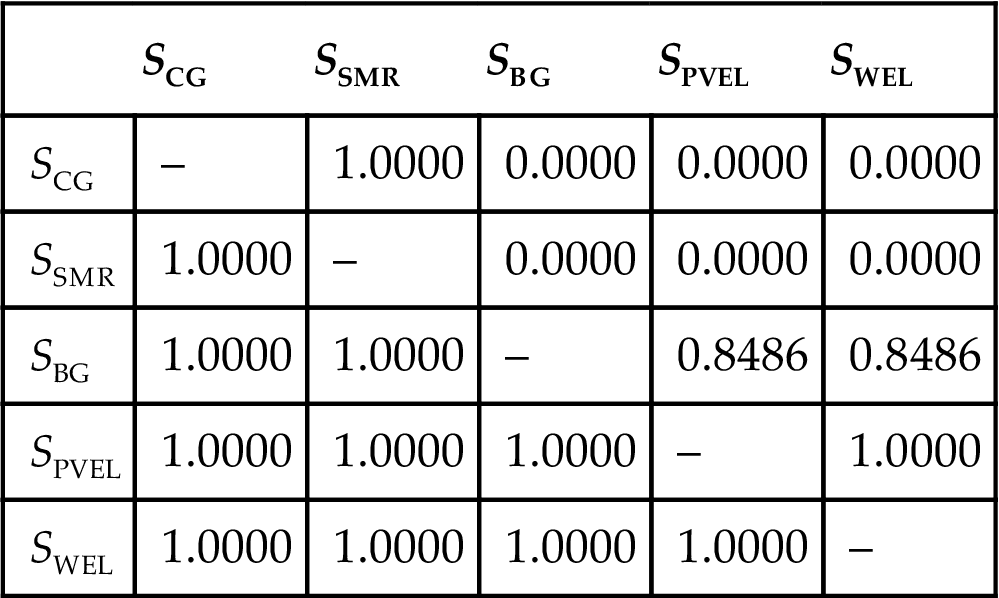
Afterward, the weight vector is determined according to Eqs. (9.11)–(9.12).
The weight vector indicates that the priorities of the five pathways with respect to the criterion of “resource availability” are 0, 0, 0.2979, 0.3511, and 0.3511, respectively. This results agree well with the fact that both coal and natural gas are fossil resources that are gradually exhausted (BP, 2008), while biomass, solar power, and wind power are renewable resources. It is also reasonable that the relative performance of CG and SMR in term of resource availability is 0, indicating the nonrenewability of hydrogen production from coal and natural gas. This result demonstrated, to some extent, that the priority sequence of the five pathways determined by using the fuzzy AHP method can fairly reflect their performances with respect to the soft criteria. By following the same procedure, the priorities of these five pathways with respect to the other five soft criteria were also determined and presented in Tables 9.8–9.12.