Design and Optimization of Hydrogen Supply Chains for a Sustainable Future
Sofía De-León Almaraz and Catherine Azzaro-Pantel, University of Toulouse, Toulouse, France
Abstract
The lack of existing infrastructure for hydrogen deployment is largely reported in the dedicated literature. The aim of this chapter is to present and define various pathways and technologies that can be followed to model the hydrogen supply chain (HSC) through supply chain management (SCM) concepts to efficiently integrate suppliers, manufacturers, and distributors so that hydrogen can be distributed at the right quantities, to the right locations and, at the right time, in order to optimize the main criteria (e.g., cost, risk, etc.). The modeling approaches of the HSC are described through a literature review. The pathway toward a hydrogen economy and more particularly here toward the use of hydrogen as an energy vector must encompass a broad range of items concerning the three pillars of sustainability based on economic, environmental, and social impacts. SCM models can be used to design improved business pathways which could result in reduced environmental impact while being also economically achievable. It is highlighted that more efforts can be done in fields such as demand uncertainty and social perception related to hydrogen.
Keywords
Hydrogen supply chain; hydrogen infrastructure; optimization modeling; modeling approaches; hydrogen technologies
1 Introduction
The aim of this chapter is to present the various pathways that can be followed to model the hydrogen supply chain (HSC) management (SCM) with a specific focus on early design stage. SCM generally uses a set of approaches to efficiently integrate suppliers, manufacturers, and distributor so that hydrogen can be produced and distributed at the right quantities, to the right locations and, at the right time, in order to minimize the total cost of the system under the satisfaction of demand requirements while taking into account other constraints, such as environmental ones. The pathway toward a hydrogen economy and, more particularly, here toward the use of hydrogen as an energy vector must encompass a broad range of items concerning the three pillars of sustainability based on economic, environmental, and social impacts. SCM models can be used to design improved business pathways which could result in reduced environmental impact while satisfying local regulations and international treaties for greenhouse gas emissions while being also economically achievable.
The management of supply chains is a complex task mainly due to the large size of the physical supply network and the involved decision variables such as
• number, size, and location of manufacturing sites, warehouses and distribution centers, and their resources;
• production decisions related to plant production planning and scheduling;
• network connectivity (e.g., allocation of suppliers to plants, warehouses to markets, etc.);
• management of inventory levels and replenishment policies;
• transportation decisions concerning the mode of transportation (e.g., road, rail, etc.) and also sizes of shipment.
The SCM can broadly be divided into three main categories:
A supply chain network refers to a network of firms engaged in manufacturing, assembly, or storage of parts to create a product. The firms are grouped in nodes that represent the functionality that the product must perform, with the arcs between the nodes capturing the precedence constraints among them (see some examples in the dedicated literature). Typically, each node has several ways to accomplish its function and is a potential storage point for inventory. Deciding what option should be employed at each node and where inventory should be placed among these nodes is involved in the determination of the supply chain configuration. These decisions may depend upon many factors such as lead time, cost relationships, and other constraints. The procurement nodes are those that do not have any incoming arcs (i.e., they represent the purchase of components outside the supply chain). The assembly/manufacturing/transferring nodes represent the nodes for which one or more components are combined together.
Instead of selecting the lowest cost bidder as that used to be the standard industry practice in the past, companies are now considering other performance indicators to improve their systems. Cost, operability, reliability, environmental impacts, safety, and social implications are all performance measures that should be considered when assessing the different pathways as viable long-term alternatives. Research opportunities have thus occurred to design and manage these new types of supply chains associated with sustainability and resource efficiency.
SCM can be based either on mathematical programing or on simulation techniques and their application depends on the type of problem or task.
The systemic consideration of a HSC in a general perspective can be divided into different phases: technological development and/or improvement, implementation assessment, implementation phase, operation, maintenance, and dismantling. Currently, not all the potential technologies to be used in the HSC are mature. A general review of the current status of such technologies is needed in order to contextualize and design scenarios that will be further used.
The remainder of this chapter is organized as follows; in the next section, the HSC for various uses is introduced. The system is represented by nodes and connections and a general HSC is displayed. Different hydrogen activities (production, storage, transportation, etc.) are involved in a HSC and will be presented as the necessary technological bricks. Hydrogen can be produced from both fossil and renewable resources. The different technologies related to the various sources will be briefly described. It is highlighted that hydrogen can provide storage options for intermittent renewable technologies such as solar and wind and might thus facilitate their large-scale introduction in the energy mix. The centralization degree according to the plant capacity is introduced, and processes such as steam methane reforming, gasification, and electrolysis are presented. The issues related to CO2 capture and storage as well as hydrogen conditioning are also mentioned. A section is devoted to transportation with different modes such as pipeline, tube trailer, and tanker truck to supply H2 fuel to the refueling stations. All these activities are then integrated in a systematic modeling framework that allows a more precise approach than roadmaps and planning scenarios. The modeling approaches of the HSC such as mathematical modeling and geographic simulation are then described. This analysis emphasizes that achieving the potential benefits of a hydrogen system requires careful integration of production, storage, and end-use components with minimized cost and maximized efficiency, and a strong understanding of environmental impact, reliability, social perception, market, and other opportunities.
2 Elementary Bricks for Hydrogen Supply Chain Design
2.1 H2 Supply Chain for Captive Uses
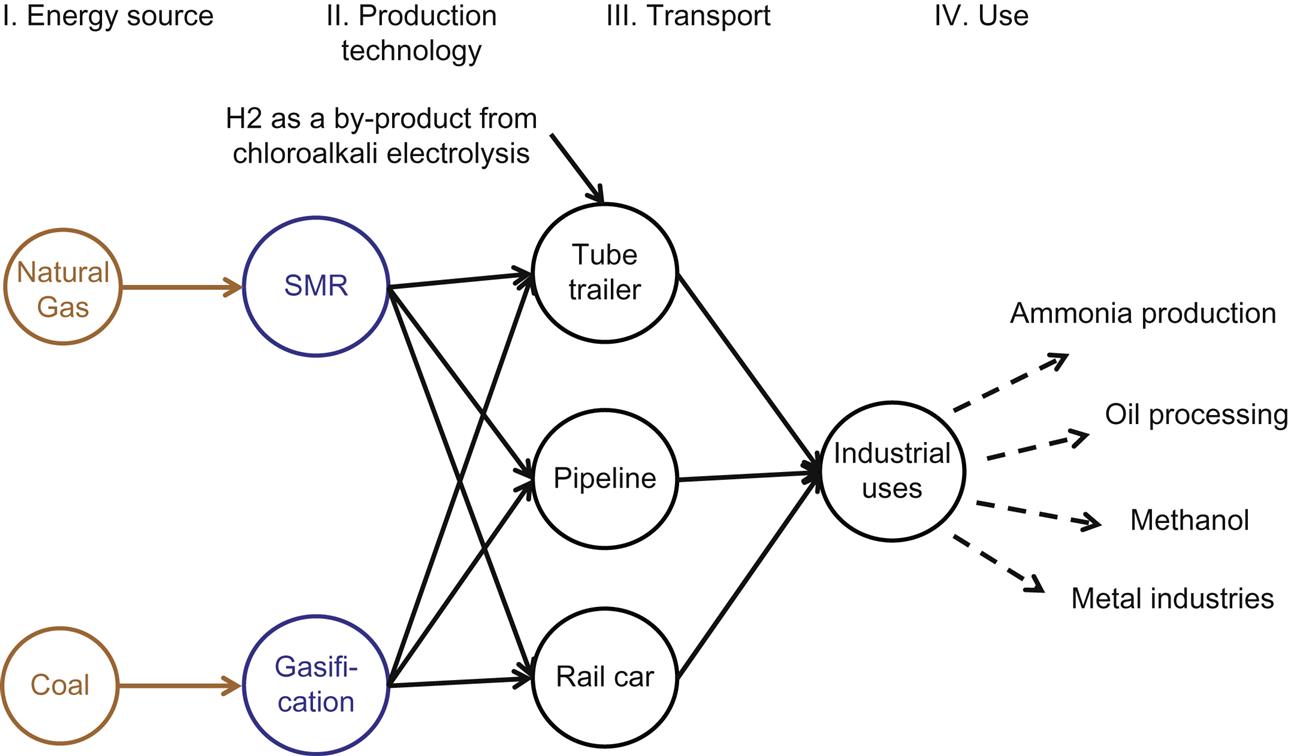
H2 production was 90 billion N m3 in Europe and 7 billion N m3 in France in 2007 (PHyRENEES, 2009). While most of it is produced onsite for captive uses, a significant portion of H2 produced today is a by-product in the chemical industry (e.g., chloralkali electrolysis) and, since there is no specific purpose, this is sometimes wasted, flared, or treated by gas industries. According to the report presented by the Hydrogen Analysis Resource Centre (2015), four main hydrogen producers share the European market: Air Liquide, Air Products, Linde, and Praxair and in 2015, the total daily production capacity installed in Europe was around 3795 t of H2 per day.
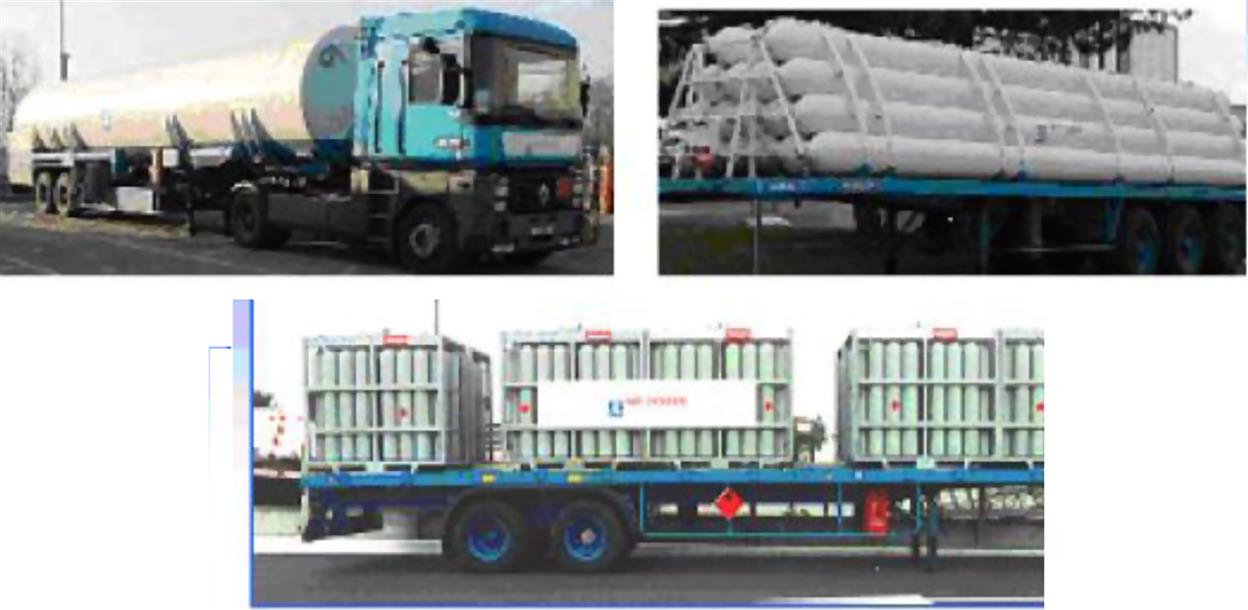
In current schemes, the logic of industrial distribution is generally as follows: hydrogen is produced in centralized plants or produced onsite for captive uses. It is obtained mainly from steam methane reforming (SMR) and coal gasification (CG) and also as a by-product from the chloralkali electrolysis plants. It is used either on-site or transported through short distances by pipelines. The option to be liquefied or compressed and then transported via tube trailers or tanker trucks also exists but is less frequent. Ammonia production plants, oil processing units, methanol, and metal industries are hydrogen customers with high demand volumes (see Fig. 4.1).
2.2 H2 Supply Chain for Mobility
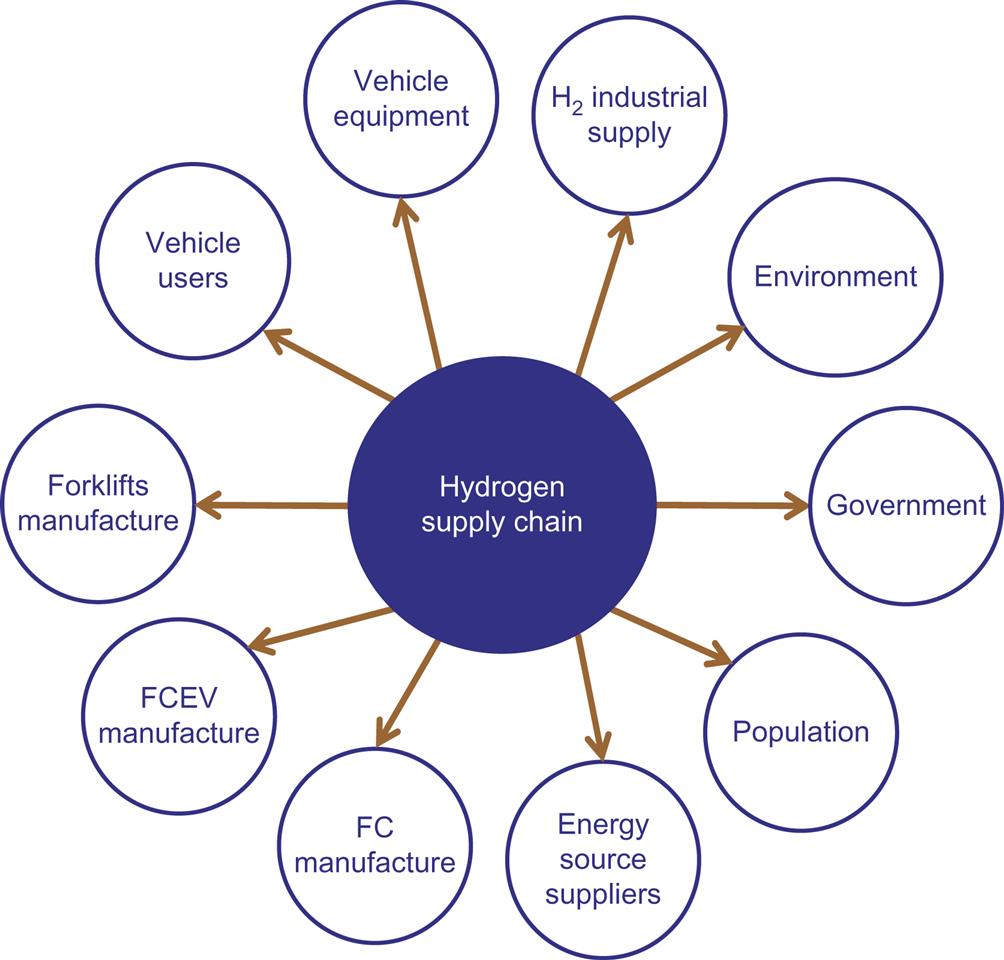
The HSC for H2 as a fuel is defined as a system of activities from suppliers to customers. These activities involve an energy source and various stages such as production, storage, transportation, and dispensation of hydrogen to refueling stations. Unlike most other fuel infrastructures, hydrogen can be produced either centrally (similar to existing gasoline supply chains) or distributed (as small-scale units that can produce H2 close to the use point in small quantities) modes at forecourt refueling stations (with reduction on the distribution cost). The stakeholders involve as economic, social, or institutional agents, business enterprises, and cultural groups of a specific country or region related to the hydrogen economy as displayed in Fig. 4.2. The projects dedicated to the deployment of hydrogen infrastructures are taken place worldwide. In Europe, the Hydrogen Mobility Europe 2 (H2ME) projects funded by the European Fuel Cells and Hydrogen Joint Undertaking will form the largest EU-funded project for hydrogen mobility and fuel cell electric vehicle (FCEV) deployment. The H2ME project is integrated by the Mobility Europe project (now call H2ME 1) with plans for 300 FCEVs and 29 hydrogen refueling stations (HRSs) to May 2020. H2ME 2 is a 6-year project which will run to the end of June 2022 and brings together 37 partners from 8 European countries. It will include the deployment and operation of 1230 FCEVs, the addition of 20 new HRSs, and will test the ability of electrolyzers to simultaneously feed hydrogen stations and help balance the electrical grid (“H2ME 2 launched in Europe to grow hydrogen fuelling infrastructure network and vehicle fleet,” 2016).
The selection of the “best” hydrogen pathway involves the comparison of various technological options in terms of multiple performance criteria, with the ultimate goal being to define a strategy whereby the infrastructure investment can be planned with confidence (Hugo et al., 2005). Several options are presented in Fig. 4.3. In that context, some questions arise:
• Which is the environmental impact of the energy source used to produce H2?
• Which production option is more cost-effective?
• Is centralized production more cost-effective than decentralized production (small-scale production at local fueling)?
• What are the most cost-effective transportation modes and pathways to connect hydrogen demand with its supply?
• Does the well-to-wheel of the HSC result in less CO2 emission than those related to gasoline and diesel fuels?
• What is the safest configuration of the HSC and which quantitative criterion can be used to evaluate safety?
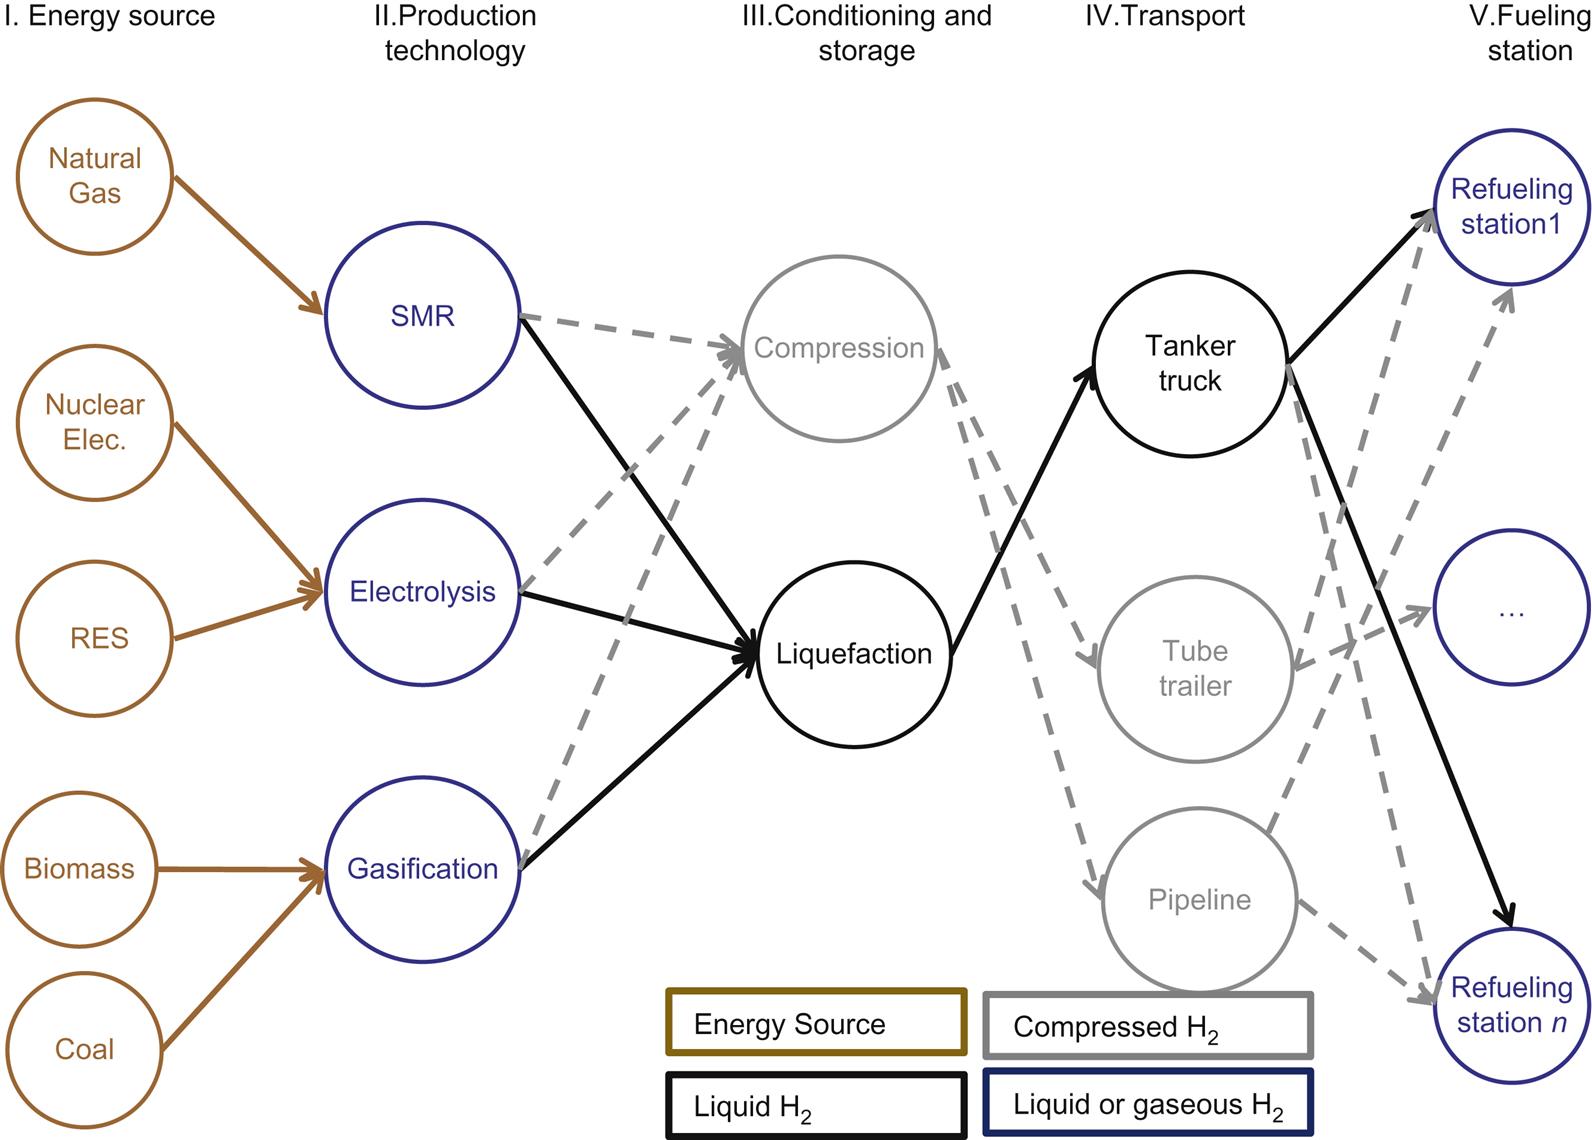
HSC modeling requires the identification of the main characteristics of its activities. A general representation of the well-known options is displayed in Fig. 4.3. It must be emphasized that the degree of maturity is not the same among all the technologies.
3 Energy Sources
The local market conditions and availability of regional primary energy feedstock have a large impact on the selection of supply chains pathways. As previously explained, hydrogen has the benefits of improving the security of fuel supplies since it can be produced from diverse primary energy sources, such as fossil fuels (such as natural gas, naphtha, heavy oil, and coal) and renewable energy sources (RESs) (i.e., wind, biomass, water, or solar energy). Currently, almost 95% of hydrogen is produced from fossil fuels via steam reforming, gasification and partial oxidation processes (Heracleous, 2011). According to Murthy Konda et al. (2011), feedstock remains the biggest contributor in the cost of H2 fuel with around 40% share.
In the report “Energy Markets in the European Union” (Eurostat–European Commission, 2012), it is shown how RES are playing an ever increasing role in European electricity generation, their contribution increasing from 14% in 1995 to 21% in 2010. Hydropower plays by far the most important role in electricity generation. Nevertheless, the importance of RES other than hydro has grown considerably; in 1995, they contributed only 8% of green electricity, in 2010, solar, wind, geothermal energy, and biomass had generated 43% of the electricity in the EU according to the same report.
Concerning the evolution in the energy mix, several scenarios can be found in the literature: some are more optimistic in the rate projected for the RES use such as WWF (2011) and EREC (2010) reports that consider a 100% production rate for RES by 2050. For instance, some examples of different energy scenarios developed in French reports include the RES roadmap for 2020 and 2030 (presented by the Renewable Energy Association) (Syndicat des énergies renouvelables, 2012) and the French energy report 2050 (Percebois and Centre d’analyse stratégique, 2012) where some scenarios (e.g., CEA, AREVA, Global chance, RTE, etc.) regarding the nuclear and RES are largely analyzed.
3.1 Natural Gas
Natural gas is a fuel consisting mostly of methane produced through the decay of organic materials. Further, most natural gas is obtained from wells, although it can be produced from organic waste through the use of digesters (Bartels et al., 2010). Natural gas is typically found near areas with large oil or coal reserves. Worldwide, there are 187.8 trillion cube meters of proved reserves, which is expected to last about 56 years at the current consumption rate (BP Stat, 2013). The existing natural gas infrastructures can be used to power the hydrogen production units.
3.2 Coal
Coal reserves are abundant and relatively well distributed globally; it will continue to play a leading role until 2050 and beyond. It should nevertheless be noted that, as pointed out by the European Directive of 2009, a key level in the short term, to reduce GHG emissions, is to improve energy efficiency in end-use in different sectors: construction, transport, and industry. In this regard, using coal as an energy source is not without problem in that it releases carbon dioxide and other pollutants when combusted. CG and carbon sequestration (see also Section 4.5) may be able to minimize pollutants and greenhouse gases while changes in mining practices can reduce the environmental concerns.
3.3 Biomass
Biomass consists of biological material that can be used for industrial purposes, such as plants, wood, or waste. Biomass has historically been used as a heating fuel through the use of combustion furnaces. There are four main categories of biomass resources that have the potential to be used as a feedstock: (1) energy crops which as the name implies are specifically grown for energy content (e.g., corn, soybeans, poplar trees, and algae); (2) agricultural waste, which includes crop and animal waste; (3) forestry waste from harvesting trees and clearing land; and (4) industrial and municipal waste (Bartels et al., 2010).
Many countries around the world have allocated the research and development toward the hydrogen production from biomass but some limitations exist. One issue with biomass is whether there is enough land to produce the amount of fuel and food needed in the world (Bartels et al., 2010). Another limitation is that the processes of hydrogen production from biomass are still in the development stage and require a strong effort in terms of R&D and demonstration activities (Balat and Balat, 2009). Also, the characteristics of biomass are very important since they can vary greatly from location to location, seasonally and yearly, so that the hydrogen production via biomass route may not be competitive with the hydrogen production with fossil fuels (Dagdougui, 2011a). However, the waste-to-energy application has received much attention due to its potential to become a major hydrogen source.
Biomass has been by far the largest source of RES consumed in the EU. Consumption of biomass was up to 13% in 2010, accounting for 69% of the total consumption of renewable sources. Most of this was used for power generation and in households (Eurostat–European Commission, 2012). Biomass plays a significant role in the current French energy mix for combustion and heat production (Direction générale de la compétitivité, de l’industrie et des services, 2011).
3.4 Electricity as an Energy Carrier for Hydrogen Production
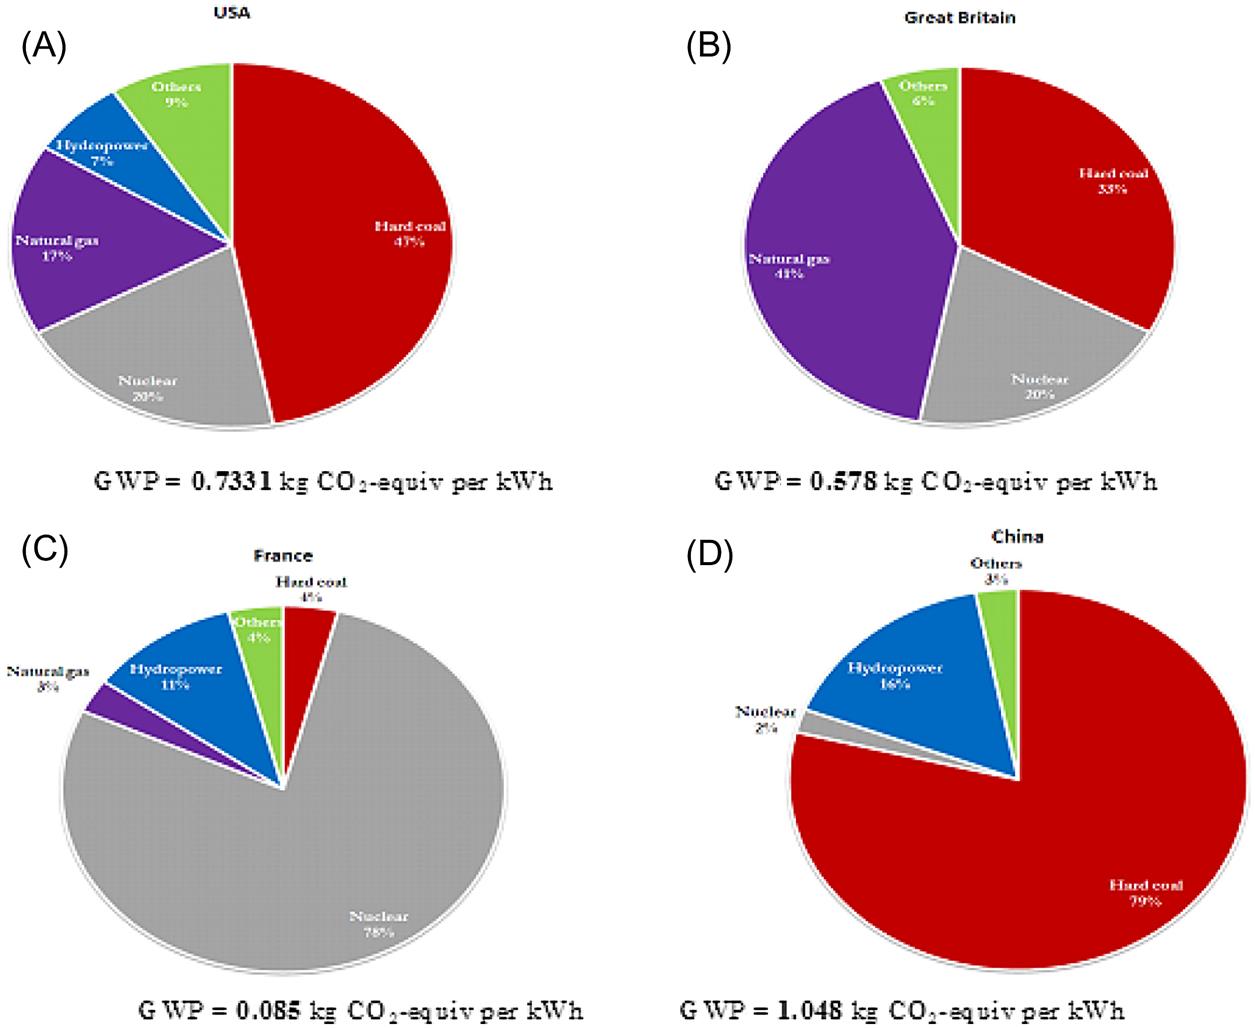
Depending of the energy mix of each country, the use of electricity to produce hydrogen (via electrolysis) could determine the environmental impact of the H2 fuel. For example, the French energy mix is dominated by nuclear power (78%) while the USA and China main source to produce electricity is coal, with 47% and 79%, respectively. Fig. 4.4 represented the global warming potential (GWP) per kW h of electricity for each particular production mix based on the Ecoinvent unit processes database with the method IMPACT 2002+ V2.10. France has the lowest GWP impact. The existing electricity infrastructures can then be used to power the hydrogen production units.
H2 can be considered as a “clean” energy carrier (if produced solely from renewable energies) and is emission free at the point of final use (avoiding the transport-induced CO2 emissions; Ball and Wietschel, 2008). Through the production of H2, the losses resulted from the intermittence of solar, wind, and hydro sources can be reduced. Also, if electricity offers increases and electrolyzers are installed next to the renewable energy site, no need to invest in new electric grid would be another advantage. Development of renewable sources for electricity production in the next years is uncertain and will vary depending on the regional condition and political strategies.
3.4.1 Nuclear
Nuclear power could produce hydrogen by either electrolysis of water, or by direct thermal decomposition of water using heat from high temperature reactors. No greenhouse gas emissions are created directly during the generation of nuclear power. But nuclear plants depend of uranium and the world proved reserves of uranium are approximately 3622,000 t, and current annual usage is 65,000 t (Bartels et al., 2010). Therefore, the world has approximately 56 years of uranium supply, assuming that no new sources are found and demand remains the same. The nuclear sector has the advantage of producing a kW h with a relatively stable price.
Nuclear fission produces dangerous waste that remains highly toxic for thousands of years and there is nowhere in the world where it can be stored safely. In 2011, Germany has made important energetic strategic changes regarding the role of nuclear power following the Fukushima accident. Its Energiekonzept project, prior to the events of Fukushima, was already based on a halving energy demand by 2050 and substantial use of renewable energy (Percebois and Centre d’analyse stratégique, 2012). Germany has established the ambitious target to abandon nuclear energy completely between now and 2022. In France, the energy mix is led by nuclear power (see Fig. 4.4C); this topic was discussed in forums in the National Debate for the Energy Transition (“Débat national sur la transition énergétique,” 2013). In this country, currently there are 58 nuclear reactors that produce more than three-quarters of the electricity demand of the country. The report “Energy 2050” (Percebois and Centre d’analyse stratégique, 2012) evaluates scenarios according to the operating life of French nuclear plants.
3.4.2 Solar
The sun provides an effectively supply of energy that can be used to generate electricity and heat. Today, solar energy technology contributes only to 2% of our total energy supply, but this proportion is growing fast. In the Ecofys scenario presented by WWF (2011), solar energy could supply around half of the total electricity, half of the building heating and 15% of the industrial heat and fuel by 2050. In this context, two technologies have reached an advanced degree of maturity: photovoltaic (PV) cells and concentrating solar power (CSP).
There are many types of PV cells produced, being more commonly silicon based. These have a quite high efficiency, but very pure silicon is needed so the manufacturing process requires a large amount of energy. Efficiencies of more than 20% (for commercialized cells) have been obtained with silicon cells already produced in mass production (EPIA, 2011). Thin film panels, which either do not require silicon or use much smaller amounts, are starting to be mass produced and commercially available. Even if thin films can be packaged into flexible and light-weight structures, the main disadvantage is their low commercial module efficiency which differs of their record lab efficiency, e.g., for cooper, indium, gallium, (di)selenite/(di)sulfide (CIGS) and cooper, indium, (di)selenite/(di)sulfide (CIS) (EPIA, 2011; Pérez Gallardo, 2013). Among commercial PV technologies, concentrating PV (CPV) has the highest solar energy-to-electricity conversion efficiency; in Vossier et al. (2012), efficiencies over 40% resulted from CPV technology. One obvious drawback of solar power is that the supply varies. PV cells do not function after dark and are less efficient on cloudy days.
CSP uses mirrors or lenses to focus the sun’s rays onto a small area where the heat can be collected for example to heat water, which can be used to generate electricity via a steam turbine or for direct heat. The central location is best in hot deserts. This is both an advantage (because the visual impact is minimized) and a disadvantage (because very long cables are required for transit to the point of consumption). The overall system efficiency depends on the efficiencies of the receiver, storage system, turbines, etc. The work of Ortega et al. (2008) presents an overall efficiency comparison among different technologies for a 50-MWe plants: parabolic trough oil (14%), central receiver system (CRS) + steam (13.6%) and CRS+ molten salts (14%). According to Montenon (2013), this technology is stable and has an efficiency over 20% with the advantage to produce at night periods. Recently, ambitious projects are in development, the Production of Electricity from Gas and Solar Energy project was leaded by CNRS-PROMES (2006–2013) in partnership with the General Council of Pyrénées Orientales (CG 66). This project aims to set up and test a high performance solar plant prototype based on a Combined Cycle Gas Turbine added to a solar receiver, on the site of the old central tower in Thémis France. High conversion efficiency and low cost of electricity are expected (30% conversion efficiency sun/electricity through a combined cycle—gas + steam turbine) (PROMES-CNRS, n.d.).
Several different technologies can be used for solar energy to hydrogen conversion. One approach involves electrolysis of water by using PV or CSP with a thermal power cycle. Another approach is based on a thermochemical process to break water into hydrogen and oxygen by using high-temperature heat from concentrating solar energy (Bartels et al., 2010).
3.4.3 Wind
Wind turbines are typically constructed in large groups of individual wind turbines in order to form a large wind farm (Bartels et al., 2010). On-shore wind has now reached maturity, even if the intermittent nature of the production makes it difficult integration into power grid systems, and the technical improvements are mostly incremental. However, off-shore wind power has emerged recently (the first field of 500 MW in 2003 in Denmark) but faces some technical barriers: keeping equipment in harsh environments (saline, weather) and grid power connection (Direction générale de la compétitivité, de l’industrie et des services, 2011).
Wind-to-hydrogen may allow wind energy to be harnessed in areas without electrical transmission capacity, or it could provide an energy storage medium for the intermittent wind resource in order to provide a more constant renewable electricity supply (Bartels et al., 2010).
3.4.4 Hydro
Hydropower is currently the world’s largest renewable power source. Large-scale hydropower plants store water in a reservoir behind a dam and then regulate the flow according to electricity demand. Hydropower can provide a relatively reliable source of power on demand. The Ecofys scenario reflects a relatively small increase in hydropower. In this scenario, hydropower would provide 12% of the electricity in 2050 compared with 15% today (WWF, 2011). Nowadays, highly efficient turbines that generate electricity by spinning water are installed. Small hydropower, defined by installed capacity of up to 10 MW, is the backbone of electricity production in many countries in the European Union (EREC, 2010). Small hydropower is based on a simple process, taking advantage of the kinetic energy and pressure freed by falling water or rivers, canals, streams, and water networks.
Regarding the type of operation, hydropower can be classified as run-of-river or pumped hydro. Run-of-river stations have no reservoir capacity so that the water coming from upstream must be used for generation at that moment or must be allowed to bypass the dam. Pumped hydro produces electricity to supply high peak demands by moving water between reservoirs at different elevations.
4 Production
In this section, the production technologies and the centralization levels are briefly analyzed. SMR and gasification have been largely mentioned in the literature and currently they can be used to mass production. Electrolysis is a promising route to obtain H2 especially from renewable sources such as wind, solar, and hydro.
4.1 Centralization Degree
To classify the degree of centralization of the HSC, two categories will be used either centralized or decentralized (on-site) units. A centralized production option would be analogous to current gasoline supply chains, where the economies of scale are capitalized upon within an industrial context and large quantities are produced at a central site and then distributed (Hugo et al., 2005; Murthy Konda et al., 2011). Centralized plants not only promise higher hydrogen production efficiency but also some difficulties are associated in high-volume hydrogen to be transported.
Decentralized production consists in small regional plants or even local filling stations that could generate hydrogen. While hydrogen generation efficiency for decentralized is lower than those for centralized plants, losses in hydrogen transport can make such a scheme more efficient (Kim et al., 2008; Haeseldonckx and D’haeseleer, 2011). There is a tendency in the literature to argue that decentralized production plants could overcome many of the infrastructural barriers facing a transition to hydrogen (Ball and Wietschel, 2008). Most studies consider the decentralized route as the key to by-passing the infrastructural problem (Haeseldonckx and D’haeseleer, 2011). A decentralized approach often results in higher costs as efficiencies are generally lower and because on-site production facilities are often dimensioned to cover peak demand (especially when no storage is foreseen or possible). However, a further increase of demand will require larger pipelines, which thus implies new investment costs (Haeseldonckx and D’haeseleer, 2011).
4.2 Steam Methane Reforming
Most of hydrogen (97%) stems from steam reforming of natural gas also known as SMR (Koroneos et al., 2004). SMR is used in the chemical and petrochemical industries; it is currently the cheapest production method and has the lowest CO2 emissions of all fossil production routes (Ball and Wietschel, 2008).
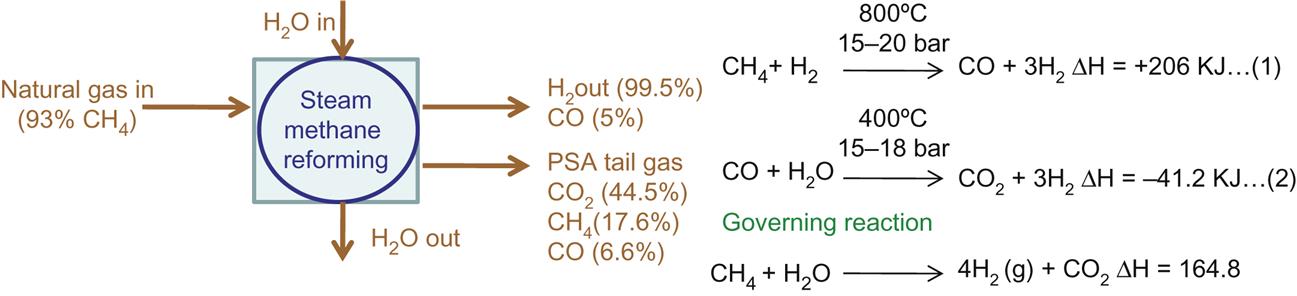
The main steps during the production of hydrogen from natural gas are (Hajjaji, 2011) (a) production of the synthesis gas, (b) conversion of carbon monoxide to hydrogen (water shift gas), and (c) purification. The first stage (see Fig. 4.5) is a catalyzed endothermic reaction between methane (natural gas) with water vapor at high temperature (steam reforming) to produce synthetic gas, which mainly consists of carbon monoxide and hydrogen along with some water, carbon dioxide, and methane (Bartels et al., 2010). During steam reforming, hydrocarbons are catalytically split in the presence of steam at temperatures of 800–900°C (Landucci et al., 2007). Then, carbon monoxide is converted to carbon dioxide following the exothermic shift reaction. In the purification stage, pressure swing adsorption is the prevailing process (Koroneos et al., 2004) in which the reactive gas mixture, containing methane and hot steam, is fed to the tube side of a catalytic furnace reactor. Since the reaction is endothermic, the combustion of methane with air in the furnace side of the reactor provides the required reaction heat. The exhausted beds are regenerated via hydrogen washing, so even if a high purity product is obtained, about 25% of hydrogen is lost. The hydrogen-enriched purge gas is recycled to the furnace side of the reactor and burned together with the combustion methane (Landucci et al., 2007).
4.3 Biomass and Coal Gasification
Biomass gasification (BG) for hydrogen production, still at an early stage today, is expected to become the cheapest renewable hydrogen supply option in the coming decades although biomass has restricted potential and competes with other biofuels as well as heat and power generation (Ball and Wietschel, 2008). The BG process can be carried out (National Renewable Energy Laboratory, 2011) according to three main types of processes: fixed bed (downdraft and updraft), fluidized bed (bubbling fluidized bed, circulating fluidized bed), and entrained flow gasifiers.
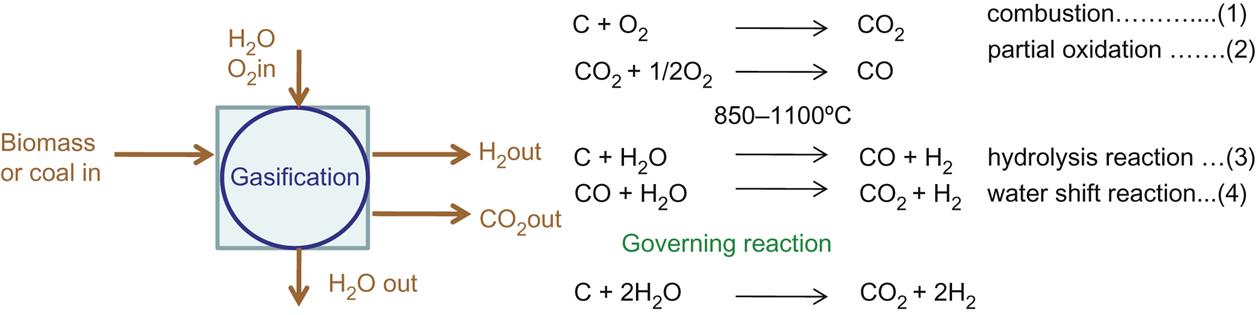
Each type can use one or a combination of gasification agents, including steam, air, and oxygen, to promote conversion. Gasification is an endothermic process and requires a heat source to promote reaction (Fig. 4.6). Indirect gasification typically uses steam whereas direct gasification uses high-pressure air or oxygen as agents. Indirect gasifier temperatures are in the range of 750–900 °C and a mix of syngas, char, and tars is produced. One disadvantage of this approach is that a char combustor, a steam reformer, and an extra compressor are needed to boost the syngas pressure before the acid gas is cleaned up. During direct gasification, biomass under pressure in the presence of oxygen and steam produce medium thermal energy syngas and heat via an exothermic process. The heat is captured in the gasifier and combined with oxygen to maintain temperatures of 850–1100 °C. This process also needs an expensive air separation unit (ASU) for oxygen supply.
4.4 Water Electrolysis
Water electrolyzers can be divided into two categories, alkaline and proton exchange membrane (PEM) electrolyzers. According to Ball and Wietschel (2008), electrolysis processes are more expensive than SMR and only applied if high-purity hydrogen is required since the work of Bartels et al. (2010) reports that H2 production from electrolysis may become economically competitive because fossil fuel feedstock costs also increase, and technological advancements decrease the cost of alternative energy types (Murthy Konda et al., 2011). Significant cost reductions are also expected for many materials, and catalysts and cell components used in PEM electrolyzers could benefit from large-scale production of PEM fuel cell of similar concept and design (Grigoriev et al., 2009).
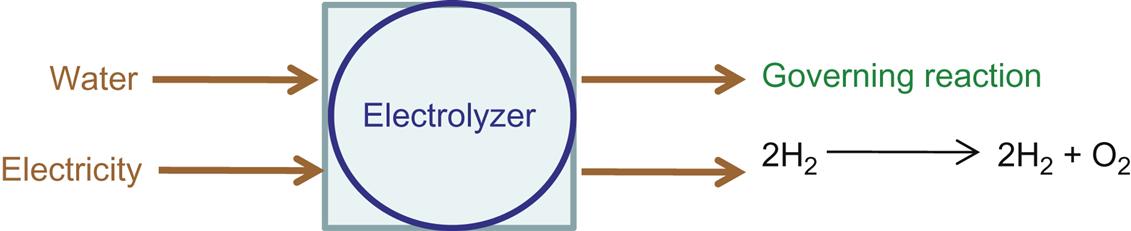
The governing reaction of electrolysis is shown in Fig. 4.7. PEM technology provides an example of “zero-gap” configuration, in which electrodes are in direct contact with the surface of the ion exchange membrane. This cell concept offers some significant advantages compared to more conventional “gap cells”: (i) no circulating electrolyte is required, pure water being the only reactant supplied to the anodes; (ii) gaseous products H2 and O2 are produced at the backside of the interpolar field, offering the possibility of reducing ohmic drops and increasing current densities. As a result, low-energy consumption (4.0–4.2 kW/N m3 H2) and high hydrogen purity (>99.99%) are obtained (Grigoriev et al., 2009; Dagdougui, 2011b).
PEM electrolysis is a viable alternative for generating hydrogen from RES. As long as electricity comes from a clean source, electrolysis is a clean process. But producing hydrogen via electrolysis and then using hydrogen to produce electricity again is associated with considerable losses (Hake et al., 2006). In addition, a PEM electrolyzer can deliver hydrogen at high pressure, which will in turn be attractive for the application where hydrogen needs to be transported or stored (injected to a hydrogen tank or a pipeline network or be transferred to the liquefaction process). A power consumption of 52.5 kW h/kg is used by the PEM (which is equivalent to about 75% in efficiency) (Dagdougui, 2011b).
4.5 Carbon Capture and Storage
H2 supply chains offer the possibility of capturing most of the CO2 emissions (~90%) and sequestering them (Murthy Konda et al., 2011). Carbon capture and storage (CCS) is an energy intensive and costly process involving several steps: CO2 capture, pressurization, transportation, and final disposal into geological formations or in aquifers (Haeseldonckx and D’haeseleer, 2011; Direction générale de la compétitivité, de l’industrie et des services, 2011). There are three main technology options for CO2 capture and storage: precombustion capture, postcombustion capture, and oxyfuel combustion.
4.5.1 Precombustion Capture
Precombustion capture processes can be used in coal or natural-gas-based plants. The fuel is reacted first with oxygen and/or steam and then further processed in a shift reactor to produce a mixture of H2 and CO2. The CO2 is captured from a high-pressure gas mixture that contains between 15% and 40% CO2 (Haeseldonckx and D’haeseleer, 2011; Direction générale de la compétitivité, de l’industrie et des services, 2011).
4.5.2 Postcombustion Capture
The postcombustion process is commercially applied to produce high-purity CO2 from the exhaust of coal and gasfired boilers, furnaces, and turbines. The CO2 is captured typically through the use of solvents and subsequent solvent regeneration, sometimes in combination with membrane separation (Direction générale de la compétitivité, de l’industrie et des services, 2011; Haeseldonckx and D’haeseleer, 2011). The basic technology, using mono ethanolamine, has been used on an industrial scale for decades, but the challenge is the massive up scaling for power plants and to recover the CO2 with a minimum energy penalty and at acceptable cost. At present, the largest operating unit has a capacity of 800 t CO2/day. To put this into perspective, large coal-fired units produce up to roughly 10,000 t CO2/day (Haeseldonckx and D’haeseleer, 2011).
4.5.3 Oxygen Combustion
In this technology, the fuel is combusted using (nearly) pure oxygen, which is produced by a cryogenic ASU, although new technologies such as ion transport membranes are being worked on. The flue gas, containing primarily CO2, is partially recycled to the boiler to control the combustion temperature. The main advantage of oxyfuel combustion is that it enables nearly 100% CO2 capture (Haeseldonckx and D’haeseleer, 2011).
After the CO2 is captured via physical absorption, it is compressed to supercritical pressure at 15 MPa, which permits efficient pipeline transmission of the CO2. Energy use and CO2 emissions from CO2 sequestration are assumed to be predominately associated with compression (Johnson et al., 2008).
5 Hydrogen Conditioning and Storage
Hydrogen is a very low-density gas (0.08988 kg/N m3 at 273 K) (Patay, 2008). The physical limits for the storage density of compressed and liquid hydrogen have more or less been reached, while there is still potential in the development of solid materials for hydrogen storage, such as systems involving metal hydrides (Ball and Wietschel, 2008). Designing tanks both compact, lightweight, safe, and cheap is crucial since this is the possibility of making hydrogen storage particularly attractive compared to electricity (CEA, 2013).
Hydrogen contains a lot of energy per unit of weight while the content of energy per unit of volume is quite low. This poses a potential problem in terms of storing large amounts of hydrogen. The traditional means of storage such as pressure tanks and cryogenic tanks have improved dramatically, and a number of new storage technologies are currently under development. The least complex method of storing pure hydrogen is as a compressed gas in a high-pressure cylinder (Dagdougui, 2011b). The lack of storage implies that enough production capacity needs to be installed in order to cover the peak demand for hydrogen (Haeseldonckx and D’haeseleer, 2011).
5.1 Liquefaction
Liquefaction can greatly increase the volumetric density of hydrogen, as compared to compressed gas, but the liquefaction process itself is very capital and energy intensive (Johnson et al., 2008). Hydrogen liquefaction and use of liquid hydrogen are usually practiced only when high storage density is required, e.g., in aerospace applications (Dagdougui, 2011b). But H2 can also be liquefied for being transported in larger volumes by cryogenic trucks (800 times denser than the gaseous state). However, a certain level of cryogenic technology is needed to be implemented, either to liquefy or to keep in the liquid state (Patay, 2008). The extensive isolation technology and fueling process, as well as the loss of hydrogen by evaporation effects during storage periods, are further disadvantages of liquid hydrogen (LH2) storage system (Hake et al., 2006). A temperature of 20.3 K or −253°C is required. It is not obtained only by supplying cold gas but by the combined effect of cooling and clean the adiabatic expansion of the gas after it has been previously compressed (AFH2, 2011). The electricity use in a liquefier (kW h/kg H2) is estimated as a function of size with a minimum electricity use of around 9 kW h/kg H2 for the most efficient, large liquefiers (Johnson et al., 2008) compared to 4.1 kW h/kg H2 needed for compression (Grol et al., 2005). There are currently around 30 liquefaction units worldwide. Their daily productions range from a few tonnes to 54 t for the largest (Sacramento, USA, Union Carbide). World production of LH2 would reach 355 t. The majority (84%) of this production lies in the USA: its main use is the petrochemical industry (33.5%) followed by aerospace applications (18.6%) (e.g., the first factory was built for the Apollo program in 1960) (AFH2, 2011).
The liquefaction system can turn the hydrogen gas to medium pressure liquid hydrogen. A condenser can be located on the same site a production unit (referring as “liquefier attached”). If not attached, a condenser can be located anywhere in the country. Each of liquefier can supply several filling stations (Patay, 2008).
5.2 Liquid H2 Storage
Like all cryogenic liquids, liquid hydrogen is stored in cryostats containers double insulation whose purpose is to limit the inevitable heat outside contributions. The former is a thermal insulation barrier against the flow of heat by direct conduction, provided by the vacuum maintained in the double wall of the cryostat. The latter, against the flow of heat by radiation, is provided by a multireflecting sheet metal disposed in the space between the walls. A cryostat is not sealed so that a continuous evolution of hydrogen gas (precisely vapor hydrogen) is observed. This constant evaporation, which corresponds to a weight loss of 0.5 to 1% per day depending on the technology used, is one of the major disadvantages of storing hydrogen in its liquid form (AFH2, 2011). Liquid hydrogen plays an important role during the transition phase (until 2030) and in connecting outlying areas, such as along motorways or in rural areas (Ball and Wietschel, 2008). The works of Almansoori and Shah (2006, 2009) concluded that from an economic viewpoint, designing a liquid hydrogen based supply network is extensively cheaper than designing a gaseous-based network.
5.3 Compression
The production of hydrogen and conversion to gaseous form is less expensive than producing it and converting to liquid form. However, this difference in production costs does not come close to bridge the gap of higher transportation cost of gaseous hydrogen compared to liquid hydrogen (Ingason et al., 2008).
The conditioning system can turn the medium pressure hydrogen gas to a high pressure hydrogen gas or compressed hydrogen (CH2). Currently, 200 or 350 bar pressure bottles are distributed in the industry and developments now concern tanks can withstand pressures of 700 bar (CEA, 2013). A conditioning center can be located on the same site a production unit (referred as “attached conditioning center”). If not attached, a conditioning center can be located anywhere in the country. Each conditioning center can supply several groups of filling stations (Patay, 2008).
5.4 Gaseous H2 Storage
The required space of gaseous storage could be an important issue. Given the fact that large storage facilities can only maintain pressures up to 12–16 bar, this means that up to 1 million m3 of space is required for storage capacity for 10 million N m3 H2 (Haeseldonckx and D’haeseleer, 2011). In addition, storing such large quantities of hydrogen also brings along serious safety issues. Large hydrogen storage facilities are unlikely to be located near densely populated areas.
The risk of leakage of hydrogen must also be considered in light of flammable and explosive nature of the gas under certain conditions. However, due to the small size of the molecule, hydrogen is able to penetrate many materials, including certain metals. It weakens, moreover, some making brittle. The study of high-pressure storage is therefore essential to test the resistance of materials to hydrogen pressure. These materials must be resistant but relatively light (mobility requires). The metal tanks currently used still prove expensive and heavy in relation to the amount of gas they can take. Nonmetallic tanks but most of polymeric materials (nonload-bearing nonmetal liner axial and hoop wrapped with resin-impregnated continuous filament1) are being developed to address these constraints (CEA, 2013).
5.5 Metal Hydrides
An alternative to the traditional storage methods (liquid and gas) is proposed through the use of advanced solid materials. Certain materials absorb hydrogen under moderate pressure at low temperatures, forming reversible hydrogen compounds called hydrides. This type of hydrogen storage is often called “solid” hydrogen storage since hydrogen becomes part of the solid material through some physicochemical bonding (Dagdougui, 2011b). This kind of storage works like a sponge; it absorbs H2 and stocks it. It is therefore recovered at the outlet of H2 gas, high purity, low pressure. For use in cars, it will be compressed to 700 bar (350 bar or depending on the model selected) and put in the filling station. This technology is well adapted for on-site applications. More information about this kind of storage can be found in “McPhy – Solid hydrogen storage”.
6 Transportation
Conceptually, transportation is divided into two parts: transmission and distribution. Transmission refers to H2 transportation from a plant to other regions without-plant units and distribution refers to H2 transportation to the refueling stations from a plant or regional conditioning center in any region (Murthy Konda et al., 2011).
There are various methods for transporting hydrogen, but choosing the best one depends on different parameters such as the distance of the demand center from the production site (Ball and Wietschel, 2008; Qadrdan et al., 2008), the amount of transferred hydrogen, and the existing infrastructure such as natural gas pipeline, road, and rail (Qadrdan et al., 2008).
Note also that the choice of transportation mode is correlated with the architecture of the distribution network. Indeed, a supply chain including liquid hydrogen requires trucks, while a supply chain not including condensers or compressors requires pipelines (Fig. 4.8; Patay, 2008).
Due to the aforementioned low volumetric energy density of H2, transportation costs can be significant (Ball and Wietschel, 2008; Murthy Konda et al., 2011; Almansoori and Shah, 2006). For Ball and Wietschel (2008), as transport is so expensive, hydrogen should be produced close to the user centers.
The costs could be considerably reduced if the natural gas pipeline could be adapted to hydrogen. As hydrogen can diffuse quickly through most materials and seals and can cause severe degradation of steels, mainly due to the embrittlement, the use of existing natural gas pipelines could be problematic and has to be investigated on a case-by-case basis. Coating or lining the pipelines internally, or adding minor amounts of oxygen, could solve the problems in using existing long-distance transmission pipelines made from steel. In addition, valves, manifolds, and in particular compressors would need to be modified, as they are optimized to work under a certain range of conditions, such as gas composition (Ball and Wietschel, 2008). Another possibility could be to blend hydrogen with natural gas up to a certain extent and either separate the two at the delivery point or use the mixture, e.g., in stationary combustion applications (Ball and Wietschel, 2008; Li et al., 2008).
6.1 Pipeline
Pipelines have been used to transport hydrogen for more than 50 years (Ball and Wietschel, 2008). The longest hydrogen pipeline in the world to supply chemical and petrochemical industries (about 1050 km in France, Germany, and the Benelux countries) is operated by Air Liquide (CEA, 2013). The United States has more than 720 km of hydrogen pipelines concentrated along the Gulf Coast and Great Lakes, the estimation of the capital cost of hydrogen transmission pipelines range from 200,000 to 1000,000 US$/km (Dagdougui, 2011b).
From a production unit, the gas is transported through a transmission line medium pressure (100 bar) (Patay, 2008; Haeseldonckx and D’haeseleer, 2011). This means that less space is required to store the same amount of hydrogen. In addition, as hydrogen is stored throughout the entire pipeline network, there are no large concentrations of hydrogen at the same location, improving the overall safety. The exact amount of hydrogen that can be stored depends on the maximum and minimum pressure, the hydrogen flow, and the length and diameter of the pipeline (Haeseldonckx and D’haeseleer, 2011).
Pipelines for medium and large fueling stations may become relevant once a significant market penetration of hydrogen vehicles has been achieved, but these are mostly used for local distribution in highly populated areas and for large-scale interregional energy transport according to the HyWays roadmap (European Commission, 2008). In Ball and Wietschel (2008), a pipeline network could be constructed after 2030 when the potential demand can justify the high investment.
6.2 Tube Trailer
From a conditioning center, compressed hydrogen can be transported at around 200–250 bar by tube trailers. With the appearance of decentralized, regional production, tube trailers use is a solution for the transition phase toward the use of pipelines (European Commission, 2008). Commercial tube trailers are well established. Generally, transporting CH2 over the road in high-pressure tube trailers is expensive and used primarily for short distances; it becomes cost prohibitive when transporting farther than about 321 km from the point of production in the study of Dagdougui (2011b). Compressed gas truck delivery is not considered as a long-term delivery solution because their low hydrogen capacity would necessitate too many deliveries (Yang and Ogden, 2013).
6.3 Tanker Truck
From the liquefaction unit, LH2 can be transported by tanker trucks (cryogenic liquid hydrogen tankers). This transportation mode is the most economical pathway for medium market penetration (Dagdougui, 2011b). They could transport relatively large amounts of hydrogen and reach markets located throughout large geographic areas. Forty ton trucks can carry 3500 kg of LH2 so that the transport of liquid hydrogen is limited by volume, not by weight (Bossel, 2006).
7 Refueling Stations
At the end of the chain, the hydrogen fuel must be distributed to end users in refueling stations. Research has shown that drivers would be willing to switch to another fuel only if the new fuel is available at approximately 15%–25% of the existing retail stations (Haeseldonckx and D’haeseleer, 2011). The problem of refueling stations installation could face two scenarios:
• Scenario 1: Conversion of existing gasoline/diesel stations to hydrogen stations. This scenario has been implemented assuming that oil companies will represent one of the major stakeholders of hydrogen production.
The development of refueling stations does not seem to represent specific technical problems. The total number of HRSs in operation worldwide is 214 (January 2016) (http://www.h2euro.org) established principally in the United States, Japan, Germany, and Iceland. However, it will take time for these stations to cover a whole country, which could hinder the development of hydrogen in transport. To overcome this difficulty, some car manufacturers plan to use current fuels and hydrogen (hybrid cars) (CEA, 2013).
Patay (2008) identified four types of refueling stations according to their main mode of supply, allowing the filling station vehicles equipped with tanks for hydrogen gas at high pressure to about 700 bar (a priori these tanks will be dominant in the market):
• Type 1. Stations receiving liquid hydrogen require evaporation and compression facilities;
• Type 2. Stations receiving compressed hydrogen (200 bar) from tube trailers require a high compression unit (400–700 bar);
• Type 3. Stations with a piped gaseous H2 supply require a high compression unit (from 100 to 400–700 bar);
• Type 4. Stations with on-site H2 production by small electrolysis units require compression (from 15 to 400–700 bar).
HRSs must be as safe as gasoline stations. The main safety aspects at the user interface are related to the risk associated with a potential ignition of a hydrogen leakage at the station or at the vehicle. HRS may be a complex architecture since it must include additional devices that are essential to deliver the hydrogen to customers, such as a compressor unit to deliver hydrogen to a required pressure. Refueling station risk must be well evaluated and the code and standards for safety must be updated in order to take into account hydrogen features. Safety issues may affect the public perception of installing a HRS, especially for those who live close to the facility (Dagdougui, 2011b).
The items that have been presented in the previous sections, i.e., energy sources, production technologies, storage, transportation, and refueling, constitute the elementary building bricks of the supply chain. Based on them, the review of HSC modeling is then proposed.
8 HSC Modeling Approaches
Modeling a HSC relies on the integration of the elementary echelons of the supply chain. This integration phase can be divided into three steps: first, the pathway options of the HSC from production to end user should be defined; second, these pathway options must be described in terms of input and output commodities to enable the links within the model; the third main step concerns techno-economic and environmental parameters of hydrogen production and delivery technologies for specified supply chain pathways which have been introduced in the model, and among others: technical efficiency, fixed operational and maintenance costs, investment cost, variable costs, carbon emissions, etc.
A literature review shows that the most common approach in designing and modeling the HSC is the optimization methods through mathematical models. As opposed to simulation-based approaches, these models utilize formal optimization techniques to allow advanced decisions to be captured and to provide comprehensive integrated solutions recommendations (Hugo et al., 2005). The aim of such methods is to determine optimal configurations according to some specific criteria (e.g., economic, safety, environmental aspects). One of the main advantages of this type of modeling is that mathematical models form a bridge to the use of high-powered mathematical techniques and computer to analyze the problems (Hillier and Lieberman, 2001).
The inputs of such models are constituted by a set of options for the production, storage, and transportation, while the outputs are relative to the type, numbers, location, and capacity of the production, storage, transportation (Dagdougui, 2011a). This approach matches with the previous definition of the HSC explained in Sections 4.1 and 4.2.
The network design problem can be characterized according to different levels of interest:
• type of problem: location, allocation, routing, location allocation, location routing,
• planning level considering strategic, tactical, or operational aspects,
• temporal dimension for example either static or dynamic,
• type of data (i.e., deterministic, stochastic),
• type of approach (optimization, simulation),
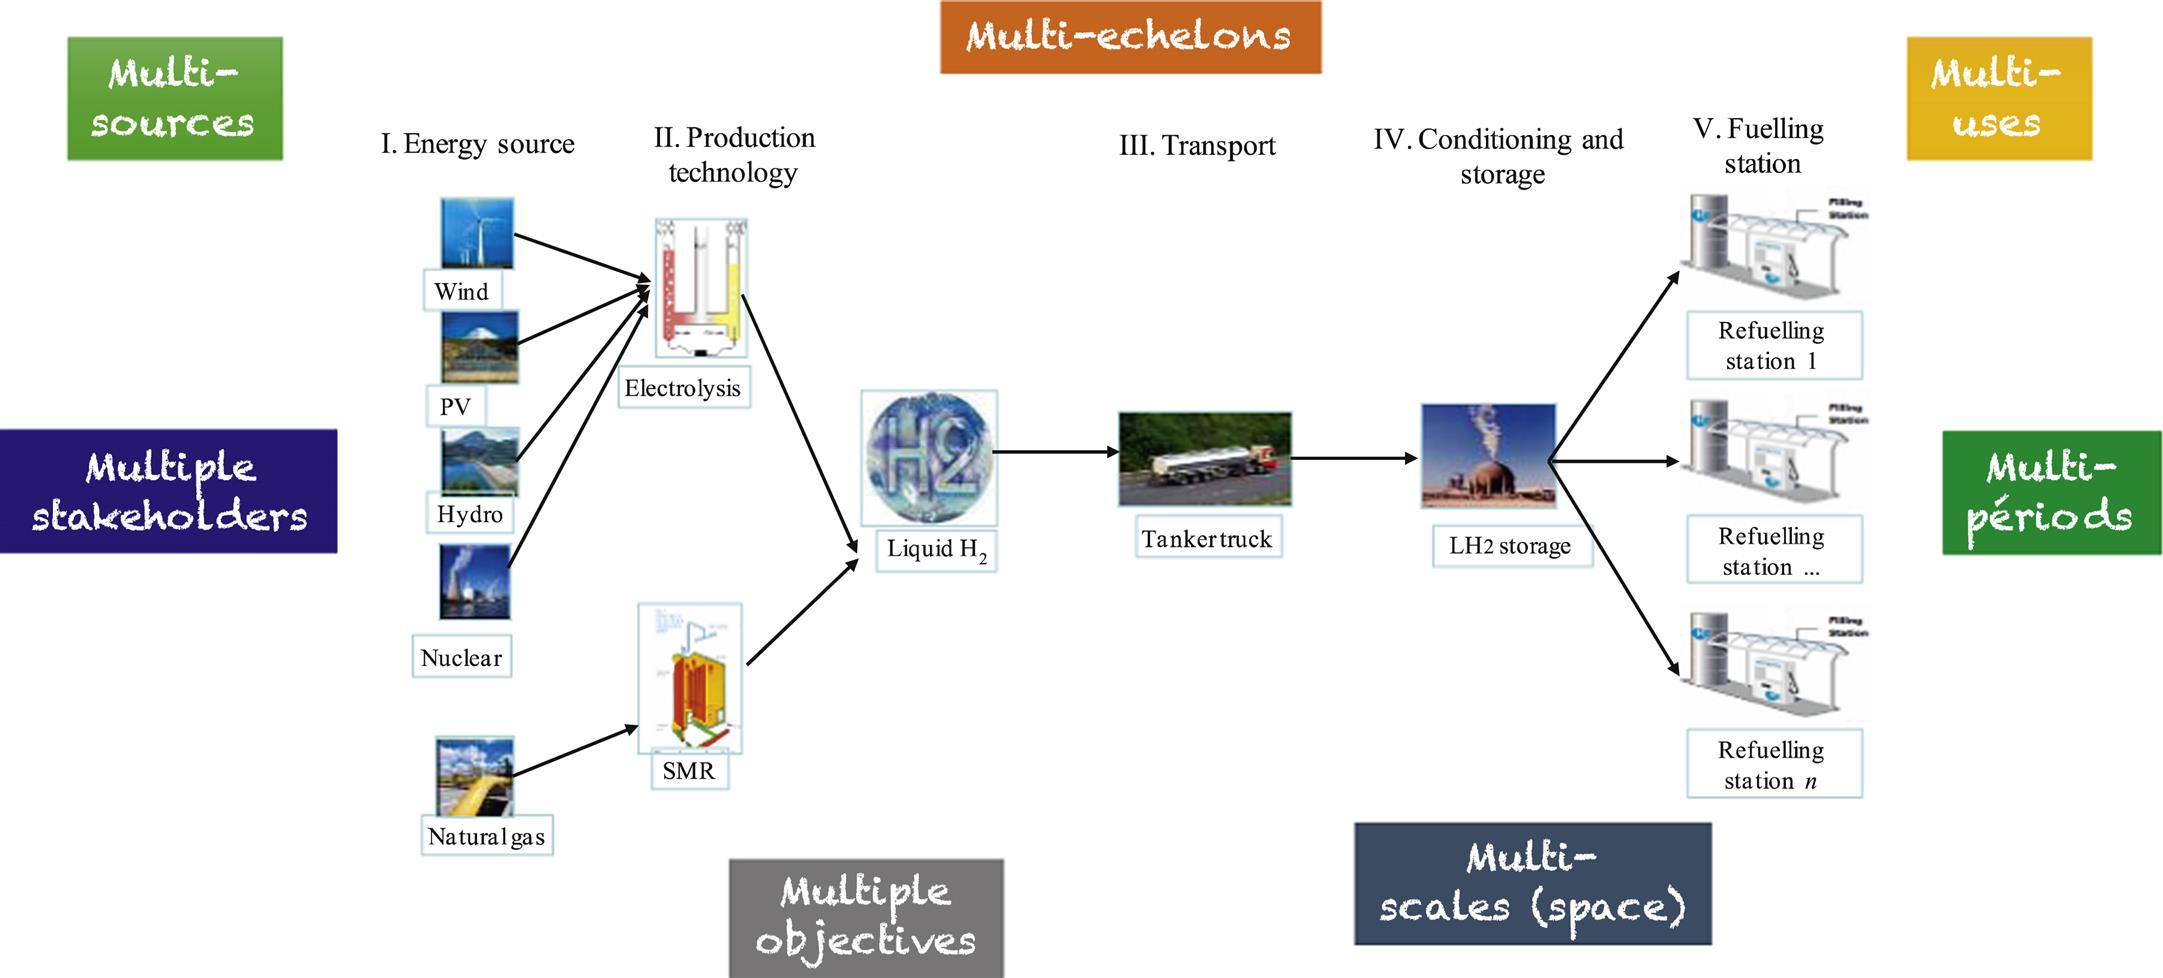
It can be viewed as a “multipurpose problem” with multienergy sources, multiechelons, multiuses, multiperiod, multiple stakeholders, multiple objective functions, and multiscales from regional to national and international. An example of HSC modeling is taken from our previous works (De-León Almaraz et al., 2014) (Fig. 4.9).
The use of mathematical programing for designing a supply chain consists of three major steps as reported in Grossman et al. (2000; Boix, 2011):
1. The representation of all possibilities from which the optimal solution is extracted by defining the so-called superstructure: a superstructure is defined as the set of all possible connections in a network.
2. The formulation of a mathematical model includes generally discrete and continuous variables. The main components of a model are
a. the optimization criteria which are expressed as mathematical functions, and
b. the constraints which can be either of equality or inequality type.
3. The resolution of the mathematical model to determine one or more optimal solutions.
A complementary way consist in using geographic tools to design the HSC. The Geographic Information System (GIS) is a package that can be usefully integrated with a modeling system for SCM. The typical GIS contains an extensive database of geographic census information plus graphical capabilities of displaying maps with overlays pertaining to the company’s supply chain activities (Shapiro, 2001). Besides the use of GIS, additional enhancements could be projected by coupling the GIS component to an additional mathematical model, thus leading to an integrated approach. It must be highlighted that by contrast to the mathematical optimization approaches, the spatial or GIS-based approach cannot be considered as a general methodology for finding the optimal HSC configuration. In fact, the results of the approach are depending on national or regional specific conditions that are strongly related to the local territorial conditions, such as transportation network, population, available resources, local policies, and others (Dagdougui, 2011a).
8.1 Mathematical Modeling
In the mathematical formulation, mixed integer linear programing (MILP) approaches have been widely used. The MILP method consists of maximizing or minimizing an objective function as a function of parameters, variables, and several constraints on these variables (Haeseldonckx and D’haeseleer, 2011). The use of integer variables in general and in particular binary dramatically broadens the capabilities of linear programing modeling, enabling the disjunction of constraints, the logical implication, and general restrictions to the model incorporating certain nonlinear behaviors of reality. Many practical optimization problems lead to consider an extremely large number of feasible solutions so that the problem can be viewed as a combinatorial one. Several solvers can be used to solve MILP problems. In particular, GAMS environment (Brooke et al., 1988), offers a wide variety of optimization procedures that includes well-known algorithms for the solution of MILP (Geletu, 2008): Branch & Bound, Benders Decomposition, Cutting Plane (Gomory) algorithm, and Branch & Cut. Usually, these algorithms are used in combination with the simplex algorithm and/or the interior-point method. For instance, some of the solvers that can solve MILP problems are BARON, BDMLP, LINDO GLOBAL, MOSEK, OSL, XPRESS, and CPLEX.
Almansoori and Shah (2006) have clearly introduced a general model that determines the optimal design of a network (production, transportation, and storage) for vehicle use where the network is demand driven. The model was applied to a Great Britain case study. The same authors extended the model in 2009 (Almansoori and Shah, 2009), to consider the availability of energy sources and their logistics, as well as the variation of hydrogen demand over a long-term planning horizon leading to phased infrastructure development as well as the possibility of selecting different scales of production and storage technologies. Other works (Almansoori and Shah, 2012a) take into account demand uncertainty arising from long-term variation in hydrogen demand using a scenario-based approach: the model adds another echelon including refueling stations and local distribution of hydrogen minimizing the total daily cost.
Hugo et al. (2005) developed an optimization-based formulation that investigates different hydrogen pathways in Germany. The model identifies the optimal infrastructure in terms of both investment and environmental criteria for many alternatives of H2 configurations. This model has been extended and considered as a basis for other works such as Li et al. (2008) for the case study in China. At the same time in Iran, a model for investigation of optimal hydrogen pathway and evaluation of environmental impacts of hydrogen supply system was examined by Qadrdan et al. (2008). Another study also considered hydrogen from water, using electricity from hydro and geothermal power in Iceland for exportation (Ingason et al., 2008).
Additional items have been integrated in Kim et al. (2008) models as deterministic versus stochastic approach to consider demand uncertainty in the new model. The model they proposed determines a configuration that is the best for a given set of demand scenarios with known probabilities. The stochastic programing technique used is based on a two-stage stochastic linear programing approach with fixed recourse, also known as scenario analysis. A strategic design of hydrogen infrastructure was later developed to consider cost and safety using multiobjective optimization where the relative risk of hydrogen activities is determined by risk ratings calculated based on a risk index method (Kim and Moon, 2008).
Patay (2008) has developed a strategic and tactical model for the French territory and Benelux region in cooperation with Air Liquide Company. In this work, the demand and energy costs are exogenous parameters given the uncertainty on these parameters for a long-term horizon. This work studies the transportation and distribution nodes taking into account an economic criterion. The multiperiod model is to scale the infrastructure in each time period of a time horizon (horizon year 2050). The originality of Patay (2008) problem results from the time horizon considered and the dynamic dimension, as well as the size of the supply chain considered.
Guillén Gosálbez et al. (2010) proposed a bi-criterion formulation that considers simultaneously the total cost and life cycle impact of the hydrogen infrastructure and to develop an efficient solution method that overcomes the numerical difficulties associated with the resulting large scale MILP. Sabio et al. (2010) also developed an approach, which allows controlling the variation of the economic performance of the hydrogen network in the space of uncertain parameters examined the case study of Spain. Later, Sabio et al. (2011) take into account eight environmental indicators in a two-step method based on a combination of MILP multiobjective optimization with a postoptimal analysis by principal component analysis to detect and omit redundant environmental indicators.
Murthy Konda et al. (2011) considered the technological diversity of the H2 supply pathways together with the spatial-temporal characteristics to optimize a large-scale HSC. They calculate the transportation costs based in Almansoori and Shah (2006, 2009) approaches. The original models are modified (e.g., inclusion of existing plants, capacity expansion, and pipeline features) and analysis is extended to incorporate the computation of delivered cost of H2, well-to-tank emission, and energy efficiency analyzes. In Haeseldonckx and D’haeseleer (2011), the objective is not only to find the optimal set of activated hydrogen production plants but also to implement a hydrogen infrastructure optimization algorithm that has to decide which hydrogen-production plants will be invested in and which plants will not.
The thesis work of Dagdougui (2011b) describes the risk hazards (delimitation and explanation of potential risks in some parts of the hydrogen infrastructure: pipeline and storage tank) to demonstrate the consequence of hydrogen accident in case of a future infrastructure operation. The risk is integrated into the HSC to minimize the global risk to population and environment. The model is applied to regional case studies to the region of Liguria (North of Italy) and Morocco. A GIS-based methodology was coupled based on the clean feedstock for hydrogen production.
A sensitivity analysis was implemented to investigate the uncertainties of some parameters on the design of the future hydrogen infrastructure in Liu et al. (2012) on the analysis of hydrogen demand from hydrogen FCEVs in Ontario, Canada. Though Yang and Ogden (2013) describes the development and use of a hydrogen infrastructure optimization model using the H2TIMES modeling framework to analyze hydrogen development in California to 2050, H2TIMES is a quasi-spatial model that develops the infrastructure to supply hydrogen fuel in order to meet demand in eight separate California regions in a least cost manner subject to various resource, technology, and policy constraints.
It can be highlighted that several mono-objective optimization approaches have been developed or extended as in Qadrdan et al. (2008), Almansoori and Shah (2006, 2009, 2012a), Ball et al. (2006), Hugo et al. (2005), Kamarudin et al. (2009), Kim et al. (2008), Patay (2008), Liu et al. (2012), and Yang and Ogden (2013). In these studies, the cost is the objective to be minimized. Multiobjective optimization studies are relatively scarce and criteria to be analyzed are based on economic and environmental performances; some examples are presented in Guillén Gosálbez et al. (2010), Hugo et al. (2005), Li et al. (2008), and Sabio et al. (2011): minimizing the expected total discounted cost and the associated financial risk (Sabio et al., 2010) and minimizing the total cost of the network and the total relative risk of the network (Kim and Moon, 2008; Dagdougui, 2011b).
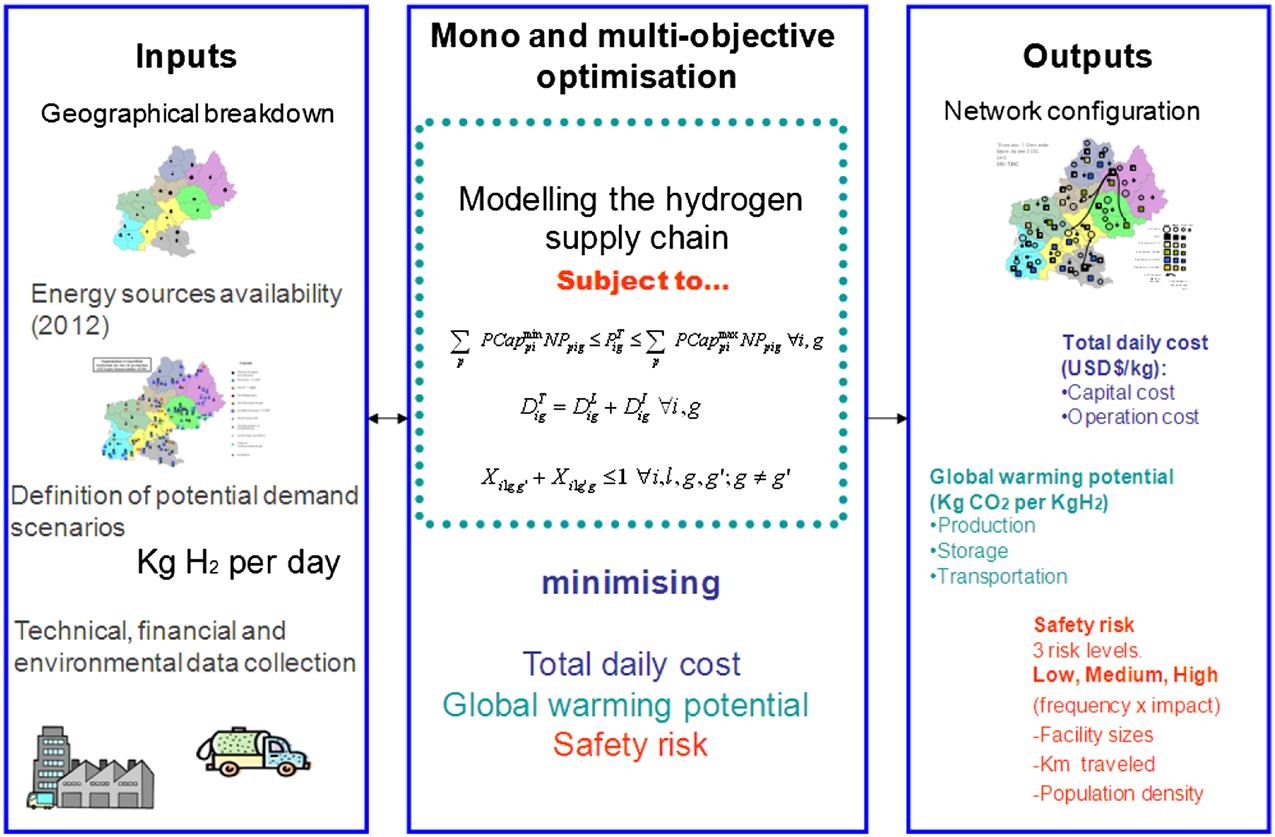
The pathway toward a hydrogen economy as an energy vector must encompass a broad range of items concerning the three pillars of sustainability based on economic, environmental, and social impacts. In this sense, multiobjective optimization has been tackled in the work of De-León Almaraz et al. (2013) demonstrating the importance of the use of multicriteria decision-making for the HSC network design by minimizing the cost, the environmental impact, and the safety risk simultaneously. The sensitivity of geographical scale was also analyzed in De-León Almaraz et al. (2014) to solve a real problem of the HSC in the Midi-Pyrénées region in France for a time horizon 2010–2050 (Fig. 4.10). In order to analyze the economies of scale and the real geographical implications, a comparison between a regional and a national case for France has been discussed in De-León Almaraz et al. (2015).
Recent models are focusing on the integration of carbon capture and storage technologies and in the utilization of pipelines resulting in centralized HSCs using fossil fuels instead of renewable energies if CCS technology is available. One example is the SHIPMod presented in Agnolucci et al. (2013) for an optimization-based framework for the design of HSC and CCS pipeline networks over a long planning horizon. A conclusion of this work is that varying the level and the spatial pattern of demand has significant impacts on both the optimal supply system and on the overall costs of delivered hydrogen. Later, in the work of Moreno-Benito et al. (2016), the SHIPMod has included additional options such as hydrogen imports in the UK for a multiperiod problem until 2070 by optimizing the present value. Almansoori and Betancourt-Torcat (2016) present an extension of previous models improving the definition of the objective function, in this case the total annualized cost to plan the HSC under emission constraints. A case study for Germany in the year 2030 is treated considering also CCS decisions. Besides, some works are evaluating only technologies that use RESs in their models, e.g., renewable electricity (Kim and Kim, 2016) and biomass (Woo et al., 2016).
Recently, a detailed sensitivity analysis using design of experiments methodology is presented in Ochoa Robles et al. (2015). The main conclusions are related to the importance to find better ways to represent the demand uncertainty since the demand is an exogenous parameter in the mathematical models. Demand uncertainty has been a common topic in recent years in this subject, e.g., Dayhim et al. (2014) minimize the total daily social cost (with categories such as economy, emissions, energy consumption, and risk) of the HSC with uncertain demand applying scenario-based approach to solve the proposed multiperiod two-stage stochastic model. Nunes et al. (2015) proposed to represent the logistic infrastructure, considering uncertainty in the demand forecast evaluating different investment alternatives using the sample average approximation method to reduce the number of scenarios, only the cost is minimized based on previous studies of Almansoori and Shah (2012b) and Dayhim et al. (2014).
Finally, the use of a metaheuristic tool to design and solve the HSC has been presented by Ochoa Robles et al. (2016). This work uses genetic algorithms instead of exact methods for multiobjective optimization minimizing the cost and the CO2 emission decreasing the computation effort to generate the Pareto fronts.
8.2 Geographical Simulation
Literature review reveals that few researchers have used the spatial dimension to construct the infrastructure for hydrogen. Some examples of geographic approaches include the study of Ball et al. (2006) who developed the Model for Optimization of Regional Hydrogen Supply approach of the energy system with the integration of geographic aspects in the analysis by the GIS-based method for Germany. This model identifies the cost-optimal way for constructing and implementing an initial hydrogen supply infrastructure as well as possible trade-offs between hydrogen production and electricity generation within a country-specific context (high degree of regionalization) (Ball et al., 2006). Johnson et al. (2008) used also GIS for modeling regional hydrogen infrastructure deployment using detailed spatial data and applied the methodology to a case study of a potential coal-based hydrogen transportation system in Ohio with CCS. The objective in this work was to optimize hydrogen infrastructure design for the entire state. The MARKAL model has been applied to the UK- and GIS-based spatial model has been developed to represent the layout of HSC (Yang and Ogden, 2013). A study presented in Baufumé et al. (2013) assumes a high penetration of hydrogen-fueled vehicles for Germany in 2050 and investigates the structure of a potential pipeline network for hydrogen transmission and distribution under different scenarios for H2 production and demand. More recently, a detailed economics model of hydrogen infrastructure in California has been developed and applied to assess several potential fuel cell vehicle deployment rate and hydrogen station technology scenarios with GIS tools (Brown et al., 2013).
9 Conclusion
The hydrogen economy is already being developed in several countries through pilot projects for mobility applications (FCEV are in precommercialization stage since 2014) and can also be easily used in stationary fuel cells to be coupled with renewable energies. Roadmaps about the potential evolution and important funding projects are active; detailed studies are necessary to find the best way to produce, transport, and store hydrogen as an energy carrier.
Designing the HSC in not a trivial task since different alternatives to produce, store, and distribute H2 exist. An important reference to assess the potential configurations is the correct geographical breakdown and definition of the territory under study. Depending on the available energy sources and installed facilities, it is possible to have a good scenario definition. Based on that, user’s preference, resources availability, regulations and policies, and the local energy strategy should be taken into account. Designing the HSC can be performed based on scenario analysis, mathematical modeling of geographic information system approaches.
In the case of the mathematical works, the most of the works are limited to a mono-objective (cost minimization) or bi-criteria assessment, generally based on either cost environment or cost safety. This is not enough when sustainable development must be taken into account in the strategic stage of any new project, when social, economic, and environmental impacts are interconnected. The spatial or GIS-based approach cannot be considered as a general methodology for finding the optimal HSC configuration but it can be coupled to mathematical programing to design the HSC.
Stochastic methods have been used through the approach of scenario analysis in recent works to deal with the hydrogen demand uncertainty. More efforts and sophisticated methods are necessary to deal with this main input which determines the final proposed configuration for the HSC.
Since several projects worldwide are taking place, tactical and operational projects are also mandatory for the already approved projects. Safety issues should be analyzed in a deep way to guarantee the feasibility of both, hydrogen infrastructure and FCEVs. Life cycle assessment studies are being developed to have more information about the environmental impact of hydrogen. Few studies regarding the social perception exist for the use of the hydrogen in the FCEV. Bellaby et al. (2016) applied a survey in England from which the participants saw benefits in hydrogen energy; none rejected it on safety grounds, though many discussed the risks.
The next step would be to embed the three pillars of sustainability in the HSC design modeling approach.