Critical Factors and Cause–Effect Analysis for Enhancing the Sustainability of Hydrogen Supply Chain
Alessandro Manzardo, Jingzheng Ren, Sara Toniolo and Antonio Scipioni, University of Padova, Padova, Italy
Abstract
The enhancement of sustainability of hydrogen supply chain is of vital importance for the stakeholders/decision-makers to design a sustainable hydrogen supply chain. The objective of this chapter is to develop a method for prioritizing the influential factors, identifying the key driving factors that influence the sustainability of hydrogen supply chain and mapping the cause–effect relationships to improve the sustainability of hydrogen supply chain. In this chapter, 37 criteria in 4 aspects including economic, technological, environmental, and societal aspects are considered for enhancing the sustainability of hydrogen supply chain, and decision-making trial and evaluation laboratory has been used to analyze the relationships among these criteria. The status of hydrogen supply chain in China has been studied by the proposed method, and the results are consistent with the actual conditions. It could be concluded that the proposed method is feasible and could be popularized to some other cases.
Keywords
Sustainability; hydrogen supply chain; decision-making trial and evaluation laboratory
1 Introduction
With the depletion of resource, the shortage of energy and the degradation of environmental, renewable, and clean energy ways, such as biodiesel, hydrogen, hydropower, and wind power, have attracted more and more attentions (Ren et al., 2013; Manzardo et al., 2012; Zhao et al., 2012a, 2012b). Among these energy scenarios, hydrogen is regarded as the most promising energy carrier, because its oxidation does not emit any greenhouse gases. However, hydrogen is not an energy source but rather an energy carrier, and it needs to be produced from other feedstock, e.g., water, natural gas, coal, biomass, etc. (Ozbilen et al., 2011). Different technologies for hydrogen production will lead different impacts on economic, environmental, and societal aspects that are the three main pillars of sustainability. Therefore, different hydrogen technologies for hydrogen production have different performances on sustainability.
Nowadays with the requirement of sustainable development, the sustainability of hydrogen technologies is becoming more and more important. Musango and Brent (2011) pointed out that technology was always embedded in the subsystems of the economy, society, and the natural environment, as they relate to sustainability development. Although there are some significant works about sustainability assessment of hydrogen technologies (Manzardo et al., 2012; Hwang, 2013; Montignac and Chaudourne, 2009; Afgan et al., 2007; Lee et al., 2011; Sadeghzadeh and Salehi, 2011; Chang et al., 2011, 2012; Pilavachi et al., 2009a, 2009b; Heo et al., 2012; Dincer and Zamfirescu, 2012), they lack a complete study on the sustainability of hydrogen technologies in “cradle-to-gate” or “cradle-to-grave” perspective (hydrogen supply chain). In other words, all these studies only focus on a mere step such as hydrogen production process and hydrogen storage process in hydrogen supply chain. In order to understand the sustainability of hydrogen supply chain comprehensively, it is prerequisite to study the sustainability of hydrogen technologies in hydrogen supply chain perspective.
Hydrogen supply chain consists of hydrogen production subsystem, hydrogen storage subsystem transportation subsystem, and hydrogen refueling station subsystem (Ren et al., 2012). The sustainability of hydrogen supply chain is very difficult due to the concerns of multiple influencing factors and multiple stages in the supply chain. It is difficult for the stakeholders to make correct decisions directly on enhancing the sustainability of hydrogen supply, because all the factors that influence the sustainability are not independent but rather interacted and partly reduplicate in concept. Therefore, it is of vital importance to develop a method that can assist decision-makers in designing sustainable hydrogen supply chains or enhancing the sustainability.
The objective of this chapter is to identify the core driving factors that influence the sustainability of hydrogen supply chain, analyze the cause–effect relationships among the factors, and provide useful guidelines for helping the stakeholders make correct decision on enhancing the sustainability of hydrogen supply chain.
In this chapter, multiple aspects including economic, technological, environmental, and societal aspects are considered, and each aspect also consists of several criteria that influence the sustainability of hydrogen supply chain. Decision-making trial and evaluation laboratory (DEMATAL) method is used to analyze the cause–effect relationships among the factors that influence the sustainability of hydrogen supply. Subsequently, the roadmap has been specified for enhancing the sustainability of hydrogen supply chain.
This remainder of this study is organized as follows: Section 2 describes the criteria system for the sustainability assessment of hydrogen supply chain. Section 3 presents the model of DEMATAL. In Section 4, the hydrogen supply chain in China is studied by the proposed method. Finally, this study is concluded and discussed in Section 5.
2 Criteria for the Design of Sustainable Hydrogen Supply Chain
The central concept of sustainability or sustainability development usually refers to achieve simultaneously economic prosperity, environmental cleanness, and social responsibility, namely the so-called triple bottom line (Othman et al., 2010; Jimenez-Gonzalez and Woodley, 2010). Hence, the criteria for sustainability assessment usually concerns three aspects including economic aspect, environmental performance, and social issue. But with the review on many published papers concerning sustainability assessment, particularly for energy systems, the technological aspect is also taken into consideration (Chang et al., 2012; Ghadimi et al., 2012; Evans et al., 2009; Elghali et al., 2007; Jing et al., 2012; Wang et al., 2008), because the criteria of technology aspect usually have significant on economic and environmental performances. For instance, the improvement of technology maturity can not only lower the cost but also mitigate the emissions of harmful gases such as CO2 and NOx. Based on the review of many published works (Chang et al., 2011, 2012; Pilavachi et al., 2009a, 2009b; Heo et al., 2012; Dincer and Zamfirescu, 2012; Wang et al., 2008; Almansoori and Shah, 2009; Kamarudin et al., 2009; Ganhadharan et al., 2012; Afgan and Carvalho, 2004; Bozoglan et al., 2012; Wu and Tsai, 2011; Yang and Tzeng, 2011; Chou et al., 2012; Tugnoli et al., 2008; Zheng et al., 2012; Gangadharan et al., 2012; Keles et al., 2008; Onat and Bayar, 2010; Mcdowall and Eames, 2007; Doukas et al., 2010), 37 criteria in 4 aspects including economic, technological, environmental, and societal aspects are considered for sustainability assessment of hydrogen supply chain in this study, as shown in Table 3.1. These criteria are specified as follows.
Table 3.1
The Criteria for Sustainability Assessment of Hydrogen Supply Chain
| Aspect | Criteria | References |
| Economic (A1) | Facility capital cost (FCC) | Pilavachi et al. (2009b), Almansoori and Shah (2009) |
| Facility operation and maintenance costs (FOM) | Pilavachi et al. (2009b), Almansoori and Shah (2009) | |
| Feedstock cost (FC) | Pilavachi et al. (2009b), Almansoori and Shah (2009) | |
| Transportation capital cost (TC) | Almansoori and Shah (2009) | |
| Transportation operation and maintenance costs (TOM) | Almansoori and Shah (2009) | |
| Primary energy source cost (EC) | Almansoori and Shah (2009) | |
| Storage-operation cost (SC) | Kamarudin et al. (2009) | |
| Net present value (NPV) | Ganhadharan et al. (2012) | |
| Internal rate of return (IRR) | Ganhadharan et al. (2012) | |
| Market share (Ms) | Afgan and Carvalho (2004) | |
| Service life (SL) | Pilavachi et al. (2009b) | |
| Technological (A2) | Technological dependency (TD) | Heo et al. (2012) |
| Reliability of technology (RT) | Heo et al. (2012) | |
| Stability of supply (SS) | Heo et al. (2012) | |
| Technological maturity (TM) | Chang et al. (2011) | |
| Technology development potential (TDP) | Chang et al. (2011) | |
| Domestic technological ability (DTA) | Chang et al. (2012) | |
| Exergy efficiency (EE) | Bozoglan et al. (2012) | |
| Technological capability (TC) | Wu and Tsai (2011) | |
| Flexibility and responsiveness (FR) | Wu and Tsai (2011) | |
| Deliver order reactiveness (DOR) | Yang and Tzeng (2011) | |
| Quality and education of staff (QES) | Chou et al. (2012) | |
| Environmental (A3) | Energy utilization efficiency (EUE) | Chang et al. (2011, 2012) |
| Effect on the mitigation of harmful gases (EMHG) | Chang et al. (2011, 2012) | |
| Land use | Wang et al. (2008) | |
| Fossil fuel consumption | Chang et al. (2011, 2012) | |
| The availability of using renewable energy (AURE) | Dincer and Zamfirescu (2012) | |
| Societal (A4) | Inherent safety index (IS) | Tugnoli et al. (2008), Zheng et al. (2012), Gangadharan et al. (2012) |
| Occupational index (OC) | Tugnoli et al. (2008) | |
| Social attractiveness (SA) | Keles et al. (2008) | |
| Human Health and safety of employees (HHSE) | Onat and Bayar (2010) | |
| Per capita GDP contribution (PC) | Onat and Bayar (2010) | |
| Taxes contribution (TC) | Onat and Bayar (2010) | |
| Cultural influence (CI) | Onat and Bayar (2010) | |
| Political acceptability (PA) | Mcdowall and Eames (2007) | |
| Security of primary energy supply (SPS) | Mcdowall and Eames (2007) | |
| Contribution for energy sufficiency (CS) | Doukas et al. (2010) |
2.1 Economic Aspect
There are 11 criteria in economic aspect, namely facility capital cost (FCC), facility operation and maintenance costs (FOM), feedstock cost (FC), transportation capital cost (TC), transportation operation and maintenance costs (TOM), primary energy source cost, storage cost, net present value (NPV), internal rate of return (IRR), market share (Ms), and service life (SL).
2.1.1 Facility Capital Cost
The FCC refers to the establishment of production plants and storage facilities in hydrogen supply chain (Pilavachi et al., 2009a; Almansoori and Shah, 2009).
2.1.2 Facility Operation and Maintenance Costs
The FOM are related to the expenses of operation and maintenance of the unit (Pilavachi et al., 2009a; Almansoori and Shah, 2009).
2.1.3 Feedstock Cost
The FC consists of all the expenses of the primary materials used in the hydrogen production process (Pilavachi et al., 2009a; Almansoori and Shah, 2009).
2.1.4 Transportation Capital Cost
The TC refers to the costs of purchasing for different transportation modes such as trucks or railcars (Almansoori and Shah, 2009).
2.1.5 Transportation Operation and Maintenance Costs
The TOM consist of all the expenses for the transportation of hydrogen, i.e., fuel, labor, maintenance, and general costs (Almansoori and Shah, 2009).
2.1.6 Primary Energy Source Cost
The primary energy source cost refers to the cost of primary energy sources for hydrogen production in the hydrogen plant (Almansoori and Shah, 2009).
2.1.7 Storage Operation Cost
The storage operation cost refers to the expense on the operation of hydrogen storage (Kamarudin et al., 2009).
2.1.8 Net Present Value
NPV refers to the sum of all cash flows from the beginning of the project to its end as shown in Eq. (3.1), to some extent, it denotes the absolute profitability of the project (Ganhadharan et al., 2012).
(3.1)
where CIj is the total annual income cash flow in the jth year, COj is the total annual outcome cash flow in the jth year, r is the interest rate (%), and n is the lifetime of a project.
2.1.9 Internal Rate of Return
IRR represents the discount rate to make the NPV equal zero, it reflects the expected rate of return when the project undertaken the highest capital cost (Ganhadharan et al., 2012). It can be obtained from Eq. (3.2).
(3.2)
2.1.10 Market Share
The Ms is a measure of the market penetration of hydrogen produced by some certain technology (Afgan and Carvalho, 2004).
2.1.11 Service Life
The SL represents the number of years the power plants can be operated before the equipment needed to be replaced (Pilavachi et al., 2009b).
2.2 Technological Aspect
The technological aspect consists of 11 criteria including technological dependency (TD), reliability of technology (RT), stability of supply (SS), technological maturity (TM), technology development potential (TDP), domestic technological ability (DTA), exergy efficiency (EE), technological capability (TC), flexibility and responsiveness (FR), deliver order reactiveness (DOR), and quality and education of staff (QES).
2.2.1 Technological Dependency
The TD denotes the risk due to dependency on foreign technologies (Heo et al., 2012).
2.2.2 Reliability of Technology
The RT represents the resistance and robustness to the failure of the energy system or device (Heo et al., 2012).
2.2.3 Stability of Supply
The SS represents the stability status of hydrogen supply chain (Heo et al., 2012), because hydrogen supply chain are relatively new, and there are abundant room for improvement for the stability of hydrogen supply chain.
2.2.4 Technological Maturity
The TM is a criterion which represents mature level of each piece of hydrogen production technology (Chang et al., 2011).
2.2.5 Technology Development Potential
The concept of TDP is defined as the evaluation of each technology with regards to its potential for future development and measured by its relative status or progress (Chang et al., 2011).
2.2.6 Domestic Technological Ability
The DTA refers to the relative level of the domestic technologies in hydrogen supply chain (Chang et al., 2012).
2.2.7 Exergy Efficiency
The EE is defined as the ratio of the output exergy (hydrogen product) to the input exergy (feedstock), and exergy is a measure of the usefulness or value or quality of energy form (Bozoglan et al., 2012).
2.2.8 Technological Capability
The TC represents the production capability and transportation capability (Wu and Tsai, 2011).
2.2.9 Flexibility and Responsiveness
The FR represents the flexibility and the responsiveness of hydrogen supply chain (Wu and Tsai, 2011).
2.2.10 Deliver Order Reactiveness
The DOR represents the reactiveness of the staffs who work in hydrogen supply chain to the deliver order (Yang and Tzeng, 2011).
2.2.11 Quality and Education of Staff
The QES represents the level of the professional skills of the staffs working in the whole supply chain (Chou et al., 2012).
2.3 Environmental Aspect
There are five criteria in environmental aspect, namely energy utilization efficiency, effect on the mitigation of harmful gases, land use, fossil fuel consumption, and the availability of using renewable energy.
2.3.1 Energy Utilization Efficiency
The energy utilization efficiency is often described by comparing the system output with energy consumption. It is the ratio of the energy of the product to the total energy required for producing the product (Chang et al., 2011, 2012).
2.3.2 Effect on the Mitigation of Harmful Gases
It is a measure of the effect of the hydrogen technologies on waste gases mitigation such as CO2 and NOx (Chang et al., 2011, 2012).
2.3.3 Land Use
Land use represents the total used land (Wang et al., 2008). In this study, it represents the ecological footprint of the hydrogen supply chain consisting of various lands, i.e., the used land for the establishment of hydrogen production factory and the land for absorbing the waste gases.
2.3.4 Fossil Fuel Consumption
Fossil fuel consumption represents the total amount of fossil fuel consumption in the whole hydrogen supply chain, i.e., the fossil fuel for hydrogen production and transportation (Chang et al., 2011, 2012).
2.3.5 The Availability of Using Renewable Energy
The availability of using renewable energy is a measure of the ratio of renewable energy used for hydrogen production (Dincer and Zamfirescu, 2012).
2.4 Societal Aspect
There are 10 criteria in societal aspect, namely inherent safety index, occupational index, social attractiveness, human health and safety of employees, per capita GDP contribution, taxes contribution, cultural influence, political acceptability, security of primary supply, and contribution for energy sufficiency.
2.4.1 Inherent Safety Index
The inherent safety index is measured in the inherent hazard in the whole hydrogen supply chain including production process, transportation process, and storage process (Tugnoli et al., 2008; Zheng et al., 2012; Gangadharan et al., 2012).
2.4.2 Occupational Index
Occupational index represents the total number of fulltime employees contributed by the whole hydrogen supply chain (Tugnoli et al., 2008).
2.4.3 Social Attractiveness
Social attractiveness represents the acceptability and attractiveness of the society to the performance of hydrogen supply chain (Keles et al., 2008).
2.4.4 Human Health and Safety of Employees
Human health and safety of employees is a measure of the effects of all the processes in the hydrogen supply chain on the health and safety of the employees, because it was reported that human health decreases with the employment of energy systems (Onat and Bayar, 2010).
2.4.5 Per Capita GDP Contribution
Per capita GDP contribution represents the increased GDP contributed by the establishment of hydrogen supply chain divided by the total number of the local residents (Onat and Bayar, 2010).
2.4.6 Taxes Contribution
Taxes contribution represents the taxes contributed by the establishment of hydrogen supply chain (Onat and Bayar, 2010).
2.4.7 Cultural Influence
Cultural influence represents the positive influences of hydrogen supply chain on the culture of the local regions (Onat and Bayar, 2010).
2.4.8 Political Acceptability
Political acceptability represents the acceptability of hydrogen supply chain from the political perspective, and it is a measure of the support and satisfaction to hydrogen supply chain from the government (Mcdowall and Eames, 2007).
2.4.9 Security of Primary Energy Supply
Security of primary energy supply is a measure of the contribution of hydrogen supply for the security of primary energy supply of a region (Mcdowall and Eames, 2007).
2.4.10 Contribution for Energy Sufficiency
Contribution for energy sufficiency is a criterion which depicts that hydrogen supply chain contributes to the region’s energy independence, by substituting certain amounts of the energy imports (Doukas et al., 2010).
There are a lot of reduplications, interactions, and independences among these criteria, but there is not a criterion which can substitute any other criteria. Hence, all the criteria are needed to be considered though it is difficult for the stakeholders to analyze the relationships among these factors directly. In order to solve this problem, an analysis tool, namely so-called decision-making trial and evaluation laboratory, is used in this study. This method is specified in the following section.
3 Decision-Making Trial and Evaluation Laboratory
DEMATAL method developed by the Science and Human Affairs Program of the Battelle Memorial Institute of Geneva between 1972 and 1976 is usually used to study and resolve the complicated and intertwined problem group (Shieh et al., 2010). It is a method based on graph theory which has the ability to divide multiple criteria into a cause-and-effect group, and the causal relationships in a network relationship map could also be obtained to help the stakeholders/decision-makers to have a better understanding of the intertwined problems (Lee et al., 2011). DEMATEL has been widely used to analyze the causal relationships and interaction influences, identify the core driving factors, and help the stakeholders to make correct decision on the complicated problems, i.e., network communication equipment manufacturing industry (Hu et al., 2011), portfolio selection (Ho et al., 2011), organic light-emitting diode technology selection (Ozbilen et al., 2011), human resources for science and technology (Shen et al., 2011), blog design (Chou et al., 2012), emergency management (Zhou et al., 2011), etc.
The DEMATEL consists of five main steps:
1. Invite experts to determine the direct-influenced matrices.
2. Calculate the average matrix.
3. Normalize the initial direct-influenced matrix.
4. Calculate the total relation matrix.
5. Set the threshold value and obtain the network relationship map.
These five steps are specified as follows (Liaw et al., 2011; Falatoonitoosi et al., 2013; Wu, 2012):
Step 1: Invite experts to determine the direct-influenced matrices. The purpose of this step is to obtain the influence of each factor on other factors. The experts concerning the corresponding filed are invited to participate in the decision-making on the direct-influenced matrices.
The corresponding experts are usually invited to attend a colloquium, and the organizer will introduce the purpose of this colloquium, the influenced factors, and the methods to determine the direct influence between any two factors by slides or some other ways.
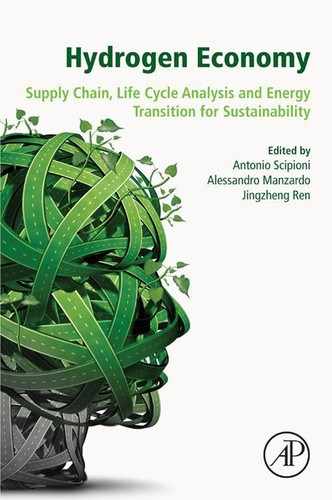
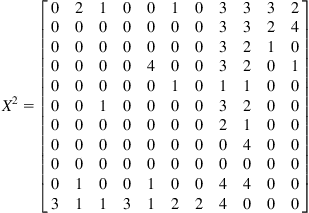
The experts are asked to evaluate the degrees which represents they believe a criterion affects another criterion, assuming there are H experts and n factors to be considered. The influence of factor i on factor j denotes by xij and is given an integer score of 0–4, representing “no influence (0)”, “low influence (1)”, “medium influence (2)”, “high influence (3)”, and “very high influence (4)”, respectively. The scores provided by each expert can form an n×n matrix, as shown in the following equation:
(3.3)
 (3.3)
(3.3)
where Xk represents the direct-influenced matrix determined by the kth expert.
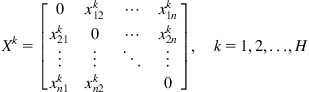
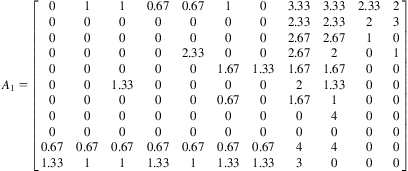
Step 2: Calculate the average matrix. The average matrix which is also called initial direct-relation direct could be calculated by the following equation:
(3.4)
 (3.4)
(3.4)
where A is the average matrix.
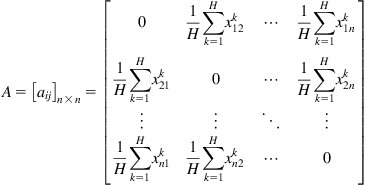
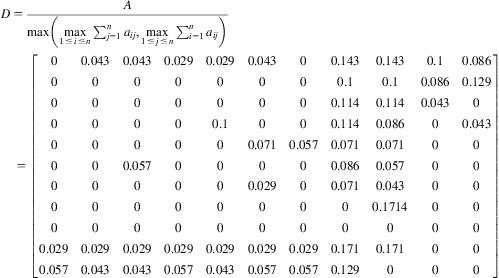
Step 3: Normalize the initial direct-relation matrix. The normalized initial direct-relation matrix D could be obtained by Eqs. (3.5) and (3.6).
(3.5)
 (3.5)
(3.5)
(3.6)
where D is the normalized initial direct-relation matrix, and s represents the biggest value among the sums of each row and each column.
The sum of each row j of matrix D represents the direct effects of the jth factor on the other factors, and ![]() represents the factor has the highest influence on other factors. On the other hand, the sum of each column i represent the direct influences on the ith factor affected by the other factors, and
represents the factor has the highest influence on other factors. On the other hand, the sum of each column i represent the direct influences on the ith factor affected by the other factors, and ![]() represents the factor which is the most influenced by the other factors.
represents the factor which is the most influenced by the other factors.
Step 4: Calculate the total relation matrix. The powers of D represent the indirect effects between any factors. A continuous decrease of the indirect effects of factors along the powers of matrix D, such as D2, D3, …, D∞, similar to Markov chain matrix, guarantees convergent solutions to the matrix inversion. Then, the total relation matrix T could be calculated by the following equation:
(3.7)
where T represents the total relation matrix and I is the identity matrix.
The total effect, that directly and indirectly exerted by the ith factor, is denoted by ri could be calculated by the following equation:
(3.8)
The total effect, including direct and indirect effects received by the jth factor, is denoted by cj could be calculated by the following equation:
(3.9)
Therefore, when i=j, the sum (ri+ci) represents the total effects given and received by the ith factor. In other words, (ri+ci) is a measure of the degree of the importance of the ith factor in the system. The difference (ri−ci) called “relation” showed the net effect that is contributed by the ith factor to the system. When (ri−ci)>0, the ith factor is a net cause, it belongs to the “cause group,” and when (ri−ci)<0, the ith factor is a net receiver or result, it belongs to the “effect group.”
Step 5: Set the threshold value and obtain the network relationship map. After the calculation of the coordinate values (ri+ci, ri−ci) of all the factors, they could be drawn out in the cause–effect diagram. Before drawing the cause–effect diagram, the threshold value is allowed to be set, if the sum (ri+ci) with respect to the ith criterion is smaller than the threshold value, it means that the influence of the ith criterion is relatively small, then the ith criterion could be deleted in the cause–effect diagram.
If the factor i is an effect, and the value of ri+ci is very small, it means that the factor is more independent, and there are less other factors which will influence factor i; on the contrary, if the value of ri+ci is very big, it means that it is the core factor required to be solved. However, it is not the origin of the problem. If the factor i is a cause, and the value of ri+ci is very small, it means that this factor only can affect few other factors; on the contrary, if the value of ri+ci is very big, it means that the core is the driving factor for solving the key problem and should be given priority for improving the whole system (Lee et al., 2010).
4 Application on Enhancing Sustainable Hydrogen Supply Chain
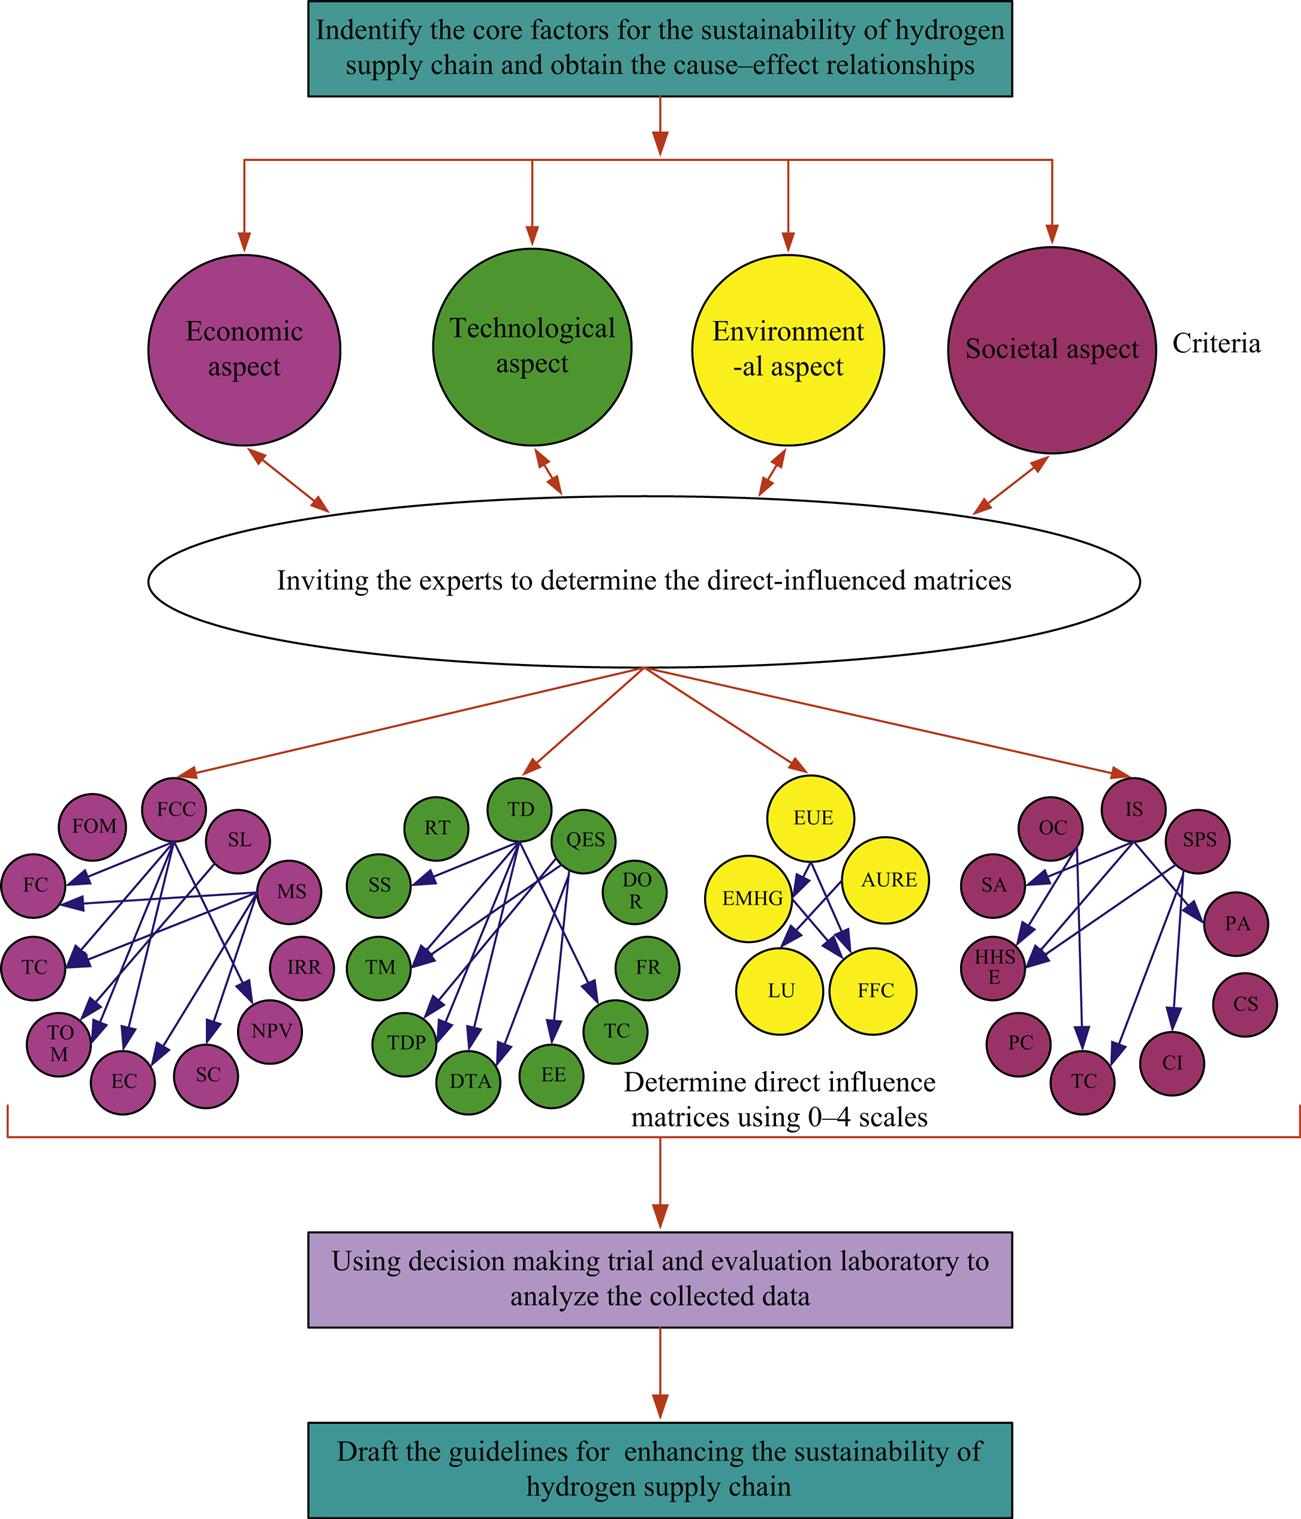
The proposed method was used to analyze the hydrogen supply chain of China, the purpose of this study is to analyze the cause–effect relationships among the influencing factors that influence the sustainability of hydrogen supply chain, identify the core driving factors that are needed to be improved for enhancing the sustainability, and specify the guidelines for helping the stakeholders to make correct decision on taking effective actions to enhance the sustainability of hydrogen supply chain. The framework of using DEMATEL for sustainability analysis of hydrogen supply chain is shown in Fig. 3.1. It consists of four main steps:
Step 1: Determine the criteria that influence the sustainability of hydrogen supply chain.
Step 2: Invite the experts who can give appropriate assessment on the direct influence between any two criteria to participate in the colloquium. The purpose of this step is data collection, namely to determine the average matrices that mentioned in DEMATEL method.
Step 3: Use DEMATEL method to analyze the collected data. It is notable that these five steps in DEMATAL, described in Section 3, are incorporated in Step 3 of the framework.
Step 4: Draft the guidelines for enhancing the sustainability of hydrogen supply chain.
Then, the four steps have been specified as follows by analyzing the hydrogen supply chain in China:
Step 1 in the framework was discussed in Section 2, and 37 criteria in 4 aspects are considered herein.
Step 2 in the framework refers data collection which is prerequisite for DEMATEL analysis, and the Delphi (Li, 1998) is used to collect the needed data. Three groups of experts are invited to participate to determine the direct influence between any two factors (direct-influence matrices). One consists of several engineers from hydrogen production plants and fuel cell vehicle companies, another consists of multiple administrative executors and managers concerning the planning and development of hydrogen energy, and the other consists of plenty professors and PhD students whose research are filed concerning hydrogen technologies. A director in each group will be nominated, and the director will organize a colloquium to discuss the direct-influenced matrix, and the direct-influence matrix until the consistency among all the experts of the group is reached. It is notable to point that some published papers, technical reports, and policies concerning hydrogen supply chain have been provided to the experts for them assess the influence between the two criteria accurately.
For the economic aspect, the calculation is based on the three groups of experts’ options. There are three 11×11 matrices determined by the three groups of experts presented in Eq. (3.10)–Eq. (3.12), respectively.
(3.10)
 (3.10)
(3.11)
 (3.11)
(3.12)
 (3.12)
Then, the average matrix could be determined by Eq. (3.4), as shown in the following equation:
(3.13)
 (3.13)
Eqs. (3.5) and (3.6) calculate normalized initial direct-relation matrix D
(3.14)
 (3.14)
Then, Step 3 in the framework could be carried out, and the total relation matrix is calculated by Eq. (3.7), as shown in the following equation:
(3.15)
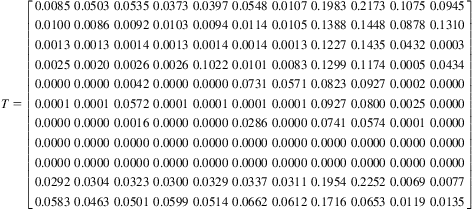 (3.15)
Subsequently, the direct and indirect effects could also be calculated by Eqs. (3.8) and (3.9), as depicted in Table 3.2. The cause–effect relationship diagram in economic aspect is shown in Fig. 3.2.
Table 3.2
The Direct and Indirect Effects of the Criteria in Economic Aspect
| Factor | r+c | r−c |
| Facility capital cost (FCC) | 0.9821 | 0.7626 |
| Facility operation and maintenance costs (FOM) | 0.7107 | 0.4330 |
| Feedstock cost (FC) | 0.5311 | 0.1071 |
| Transportation capital cost (TC) | 0.5630 | 0.2800 |
| Transportation operation and maintenance costs (TOM) | 0.5467 | 0.0724 |
| Primary energy source cost (EC) | 0.5123 | −0.0465 |
| Storage cost (SC) | 0.3422 | −0.0187 |
| Net present value (NPV) | 1.3772 | −1.0343 |
| Internal rate of return (IRR) | 1.3151 | −1.3151 |
| Market share (Ms) | 0.9153 | 0.3943 |
| Service life (SL) | 0.9462 | 0.3652 |
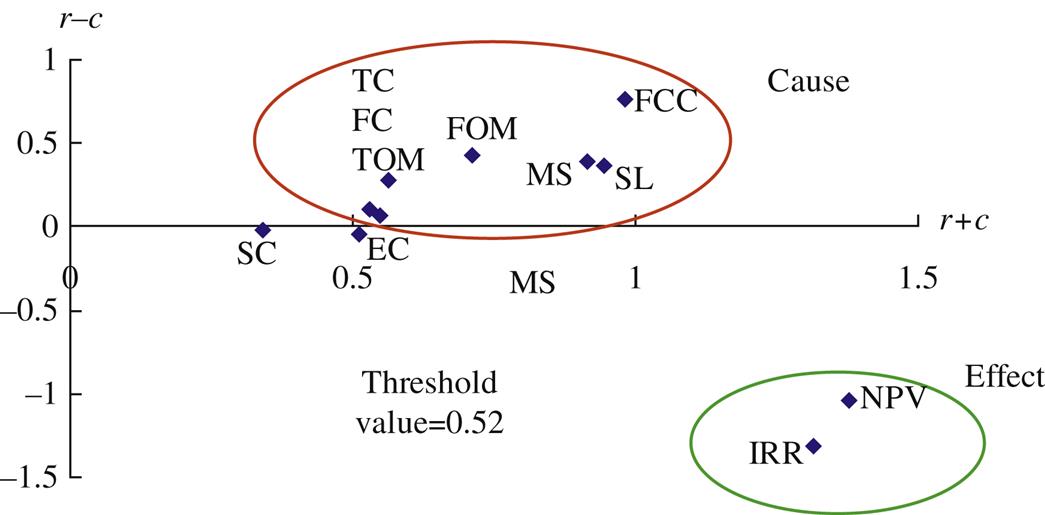
Finally, Step 4 in the framework could be done. According to the suggestions of the experts, the threshold value is set as 0.52, and it is notable that the threshold is not mandatory. It can be deduced that the importance of the 11 criteria can be prioritized as NPV>IRR>FCC>SL>Ms>FOM>TC>TOM>FC>EC>SC based on (r+c) values, and the NPV is the most important criterion with the value of 1.3772, while storage cost is the least important criterion with the value of 0.3422. In addition, the classifications of the criteria could be determined based on the values of (r−c). FCC, SL, Ms, FOM, TC, TOM, and FC are recognized as net causes, whereas NPV, and IRR are net receivers. Though some causes such as TC, TOM, and FC are less important than the net receivers including NPV and IRR that are core problems to be solved, they are also needed to be paid more attentions and been improved, because they are the origins of the problems and have significant effect on NPV and IRR. Moreover, FCC is also the most influential criterion and should be given priority to be improved, followed by FOM, Ms, SL, TC, FC, and TOM. Therefore, all the net causes need to be improved to enhance the economic performances of hydrogen supply chain, and FCC should be given priority to be improved.
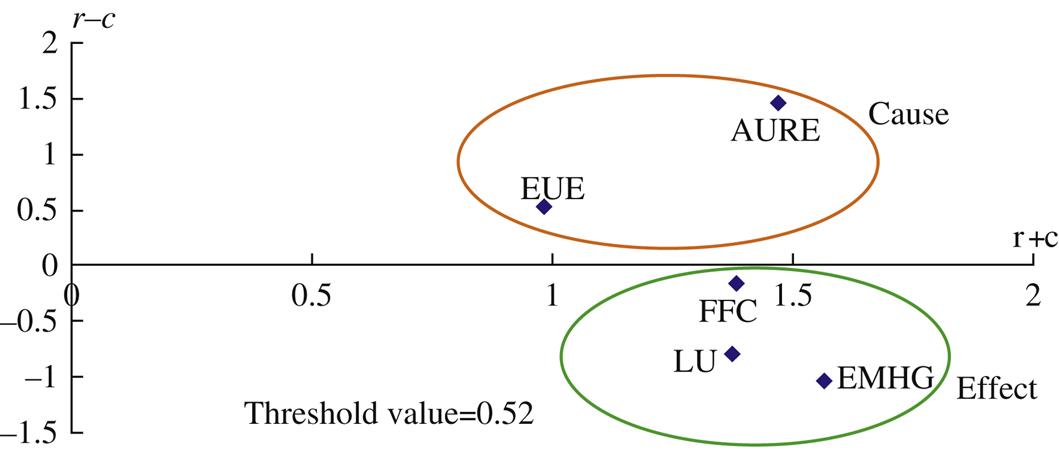
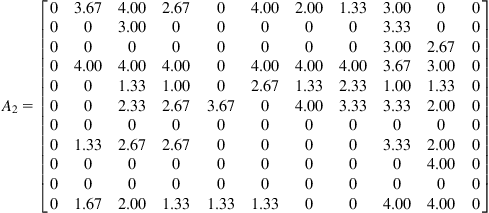
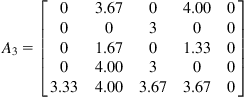
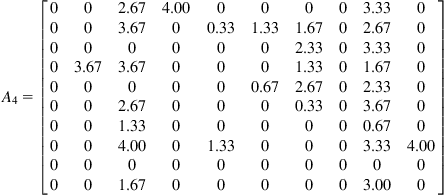
By the same way, the average matrix of the criteria in technological aspect, environmental aspect, and societal aspect could also be determined, as shown in Eqs. (3.16)–(3.18), respectively. The corresponding direct and indirect effects of the criteria in these three aspects are shown in Tables 3.3–3.5, respectively. Then, the cause–effect relationship diagrams could also be determined, as shown in Fig. 3.3–3.5, respectively.
Table 3.3
The Direct and Indirect Effects of the Criteria in Technological Aspect
| Factor | r+c | r−c |
| Technological dependency (TD) | 1.0206 | 1.0206 |
| Reliability of technology (RT) | 0.6944 | −0.2147 |
| Stability of supply (SS) | 1.0487 | −0.6534 |
| Technological maturity (TM) | 2.1113 | 0.8174 |
| Technology development potential (TDP) | 0.7689 | 0.3244 |
| Domestic technological ability (DTA) | 1.4734 | 0.4834 |
| Exergy efficiency (EE) | 0.5280 | −0.5280 |
| Technological capability (TC) | 1.0738 | 0.0472 |
| Flexibility and responsiveness (FR) | 1.2612 | −1.0004 |
| Deliver order reactiveness (DOR) | 0.9797 | −0.9797 |
| Quality and education of staff (QES) | 0.6832 | 0.6832 |
Table 3.4
The Direct and Indirect Effects of the Criteria in Environmental Aspect
| Factor | r+c | r−c |
| Energy utilization efficiency (EUE) | 0.9817 | 0.5227 |
| Effect on the mitigation of harmful gases (EMHG) | 1.5641 | −1.0366 |
| Land use (LU) | 1.3730 | −0.7936 |
| Fossil fuel consumption (FFC) | 1.3819 | −0.1653 |
| The availability of using renewable energy (AURE) | 1.4679 | 1.4679 |
Table 3.5
The Direct and Indirect Effects of the Criteria in Social Aspect
| Factor | r+c | r−c |
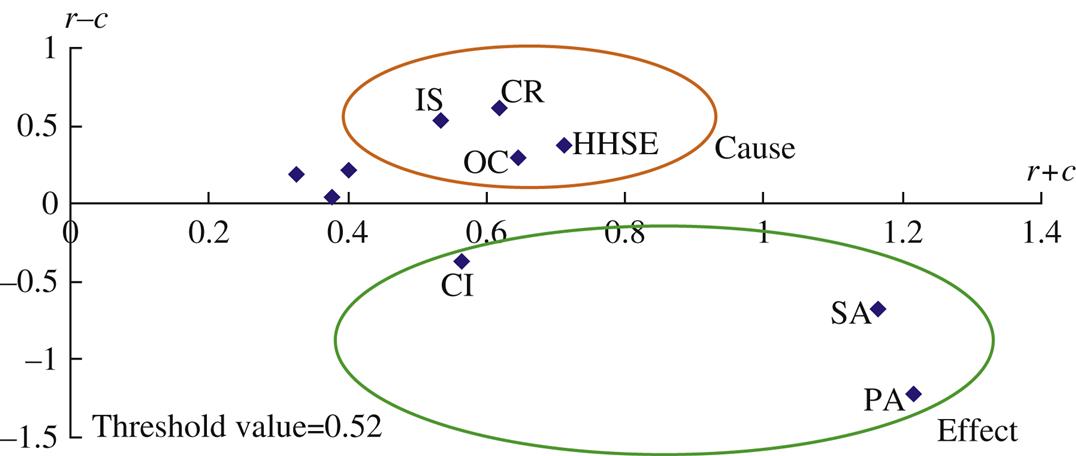
| Inherent safety index (IS) | 0.5348 | 0.5348 |
| Occupational index (OC) | 0.6461 | 0.2893 |
| Social attractiveness (SA) | 1.1661 | −0.6756 |
| Human Health and safety of employees (HHSE) | 0.7119 | 0.3786 |
| Per capita GDP contribution (PC) | 0.3272 | 0.1840 |
| Taxes contribution (TC) | 0.4018 | 0.2113 |
| Cultural influence (CI) | 0.5643 | −0.3705 |
| Contribution for energy sufficiency (CS) | 0.6178 | 0.6178 |
| Political acceptability (PA) | 1.2146 | −1.2146 |
| Security of primary supply (SPS) | 0.3783 | 0.0450 |
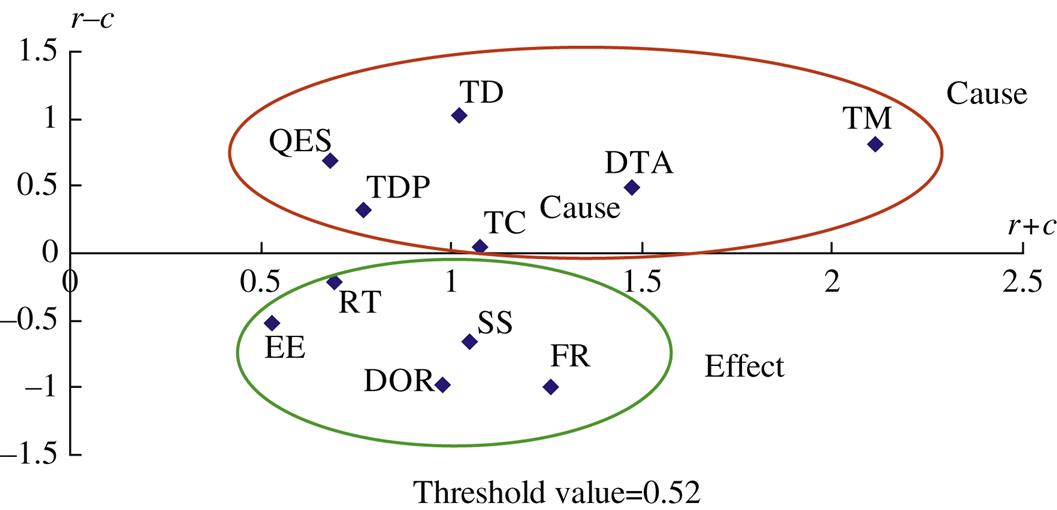
In the technological aspect, the criteria from the most important to the least is TM>DTA>FR>TC>SS>TD>DOR>TDP>RT>QES>EE, and TM, DTA, TC, TD, TDP, and QES are regarded as net causes, whereas FR, SS, DOR, RT, and EE are regarded as net receivers (effect). In addition, FR is the most important issue to be solved, followed by SS, DOR, RT, and EE. The TM is the most important driving factor for improving the technological performances, followed by DTA, TC, TD, TDP, and QES.
(3.16)
 (3.16)
In the environmental, the criteria from the most important to the least is EMHG>AURE>FFC>LU>EUE, and the availability of using renewable energy and energy utilization efficiency are regarded as net causes, whereas effect on the mitigation of harmful gases, fossil fuel consumption, and land use are regarded as net receivers. In addition, the effect on the mitigation of harmful gases is the most important core issue, followed by fossil fuel consumption and land use. The availability of using renewable energy is the most important issue which should be given priority for enhancing the performances in environmental aspect.
(3.17)
 (3.17)
In societal aspect, the criteria in this aspect from the most important to the least important is PA>SA>HHSE>OC>CS>CI>IS, and human health and safety of employees, occupational index, contribution for energy sufficiency, and inherent safety index are regarded as net causes, whereas political acceptability, social attractiveness, and cultural influence are regarded as net receivers. In addition, political acceptability and social attractiveness are the most influential factor, and human health and safety of employees is the most important driving factor for enhancing the performances in societal aspect.
(3.18)
 (3.18)
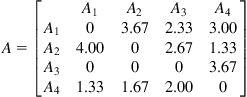
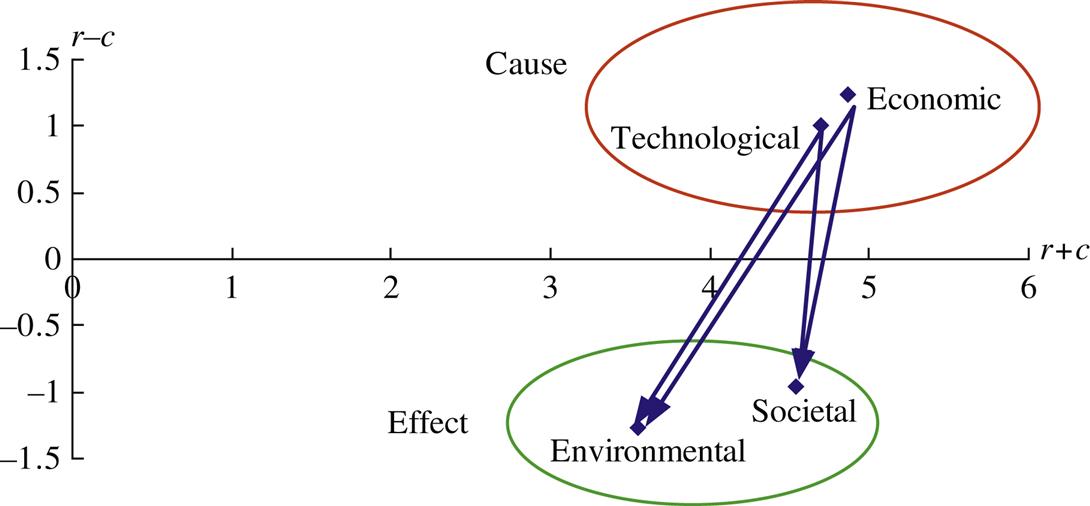
In order to investigate the cause–effect relationships among these four aspects, the average matrix of the four aspects is obtained, as shown in Eq. (3.19). Then, the direct and indirect effects of the four aspects and the cause–effect relationship diagram of the four aspects could also be obtained, as shown in Table 3.6 and Fig. 3.6, respectively. It is apparent that economic and technological aspects are regarded as net causers, whereas societal and environmental aspects are recognized as net receivers. It could be concluded that the development of hydrogen economy and hydrogen technologies is beneficial for improving the performances of environmental and societal aspects.
(3.19)
 (3.19)
5 Discussion and Conclusion
The sustainability of hydrogen supply chain is meaningful for sustainable development of hydrogen industry. The objective of this chapter is to present a method to identify the key factors influencing the sustainability of hydrogen supply chain, obtain the cause–effect relationships in the supply chain, and propose the appropriate actions to enhance the sustainability of hydrogen supply chain.
A complete criteria system which consists of economic, technological, environmental, and societal aspect including 37 criteria have been developed, and the DEMATAL is used to analyze the cause–effect relationships among the criteria in each aspect, and the importance of the criteria can be prioritized; in addition, the core factors needed to be solved and the most important driving factors for enhancing the performances of each aspect can also be identified. Comparing to the previous methodologies for optimizing or designing of hydrogen supply chain, the proposed method has the following advantages:
• It considers not only the economic performances but also other three pillars, namely technological aspects, environmental issues, and societal concerns. The sustainability of the hydrogen supply chain is studied completely.
• The qualitative factors that affect the sustainability of hydrogen supply chain could be incorporated. Moreover, the effects of these factors could also be quantified.
• The specified implementations could be obtained according to the cause–effect relationships among these factors.
• It is an object-oriented method, the proposed method is able to identify the core problems needed to be solved and the key factors that should be improved for enhancing the sustainability of the studied hydrogen supply chain.
• It is an artificial intelligent method which could share the collective wisdom. The views of stakeholders/decision-makers concerning the sustainability of the hydrogen supply chain could be aggregated by data fusion.
The hydrogen supply chain in China is analyzed by the proposed method, and the objective is to use the proposed method to obtain the useful ways for enhancing the sustainability of the hydrogen supply chains in China. The results are obtained, and the specified actions for enhancing the performances of each aspect are proposed.
In economic aspect, the NPV and IRR are not only the important factors but also the core problems that are needed to be improved for enhancing the sustainability of hydrogen supply chain, but they are not the origins of problems; on the contrary, the factors of the “cause group” are prerequisite to be improved for a better sustainability. Among them, the FCC is the most important, followed by SL, Ms, FOM, TC, TOM, and FC. It could be concluded that lowering the FCC is the most urgent problem that is needed to be solved in the hydrogen supply chain of China, and this result is consistent with that studied by Feng et al. (2004), capital cost also occupies a very high ratio in the total cost of per kilogram hydrogen. It is apparent that it is difficult for the local governments in China to invest huge capital in a hydrogen production plant for the development of hydrogen supply; subsequently, the hydrogen supply chain in those local regions are influenced. In addition, some other actions should be carried out to assist in enhancing the sustainability of hydrogen supply chain, for instance, extending the SL and the market, and lowering the FOM, TC, FC, etc. The fulfillments of these actions such as lowering the FOM and FC depend on the improvement of the technologies in hydrogen supply chain.
In the technological aspect, TM is the most important criterion, and it is also the most influential driving factor that affects the corn problems in technological aspect, followed by DTA, TC, TD, TDP, and QES that all belong to “cause group.” The improvements of these factors of “cause group” aim at enhancing the performance of the factors of “effect group” including FR, SS, DOR, RT, and EE. Among these factors in “effect group,” FR is the most important core factor that is urgently needs to be improved; hence, taking some effective actions in the whole process of hydrogen supply chain to improve the FR is prerequisite. Moreover, the enhancements of these net causes such as TM and DTA will not only improve the technological performances including improving the EE, RT, etc. but also can lower the economic, mitigate the negative impacts on the environment, and improve the social performance.
In the environmental aspect, the availability of using renewable energy and energy utilization efficiency are net causes, whereas effect on the mitigation of harmful gases, fossil fuel consumption, and land use are net effects. In addition, the effect on the mitigation of harmful gases is the most important core problem needed to be solved, and the availability of using renewable energy and energy utilization efficiency are the driving factors that can not only mitigate the emission of harmful gases but also lower the use of fossil fuel and land. Therefore, developing new renewable energy sources and improving the energy utilization efficiency is useful for enhancing the environmental performances.
In the social aspect, seven factors are identified as the important factors, and the sequence form the most important to the least is political acceptability, social attractiveness, human health and safety of employees, occupational index, contribution for energy sufficiency, cultural influence, and inherent safety index. Human health and safety of employees, occupational index, complementarily with renewables and inherent safety index are net causes, whereas political acceptability, social attractiveness, and cultural influence are net receivers. According to the results, it is apparent that political acceptability as a factor of “cause group” plays an important role in enhancing the social performances in China, this result fits well with the Chinese conditions, because the whole process of hydrogen supply chain is usually governed by the energy sector of the local government. Similarly, social attractiveness reflecting the acceptability of the local residents is also an important problem to be solved, because they can dominate the success of building a hydrogen project near their hometown. Comparing to political acceptability and social attractiveness, cultural influence is a low influential factor in “effect group.” Among the factors in the “cause group,” human health and safety of employees is the most important driving factor for enhancing the social performance, and occupational index and contribution for energy sufficiency are ranked as the second-tier most important driving factors, followed by inherent safety index, all these driving factors aim improving the political acceptability and social attractiveness.
Among the four aspects, economic aspect is the most important driving factor, followed by technological aspect, and societal performance is the most important core problem needed to be solved, followed by environmental performance. In other words, the improvement of economic and technological performances is the essential prerequisite for enhancing the sustainability of hydrogen supply chain in China nowadays. This conclusion is consistent with the actual condition of China, because the economic and technological performances have tremendous potential for improvement. Levin and Chahine (2010) pointed out that hydrogen is produced, almost exclusively, by steam reformation of methane or by water electrolysis currently. Steam reformation of methane and water electrolysis are also the two most popular pathways for hydrogen production in China. The cost of steam reformation of methane is relatively high, meanwhile, harmful gases emission is also a severe problem, and the cost of water electrolysis depends significantly on the ways of electricity generation. Therefore, the economic performance of hydrogen supply chain in China urgently needs to be improved. In addition, the new technologies for hydrogen production are also prerequisite, because some new technologies such as biomass fermentation for hydrogen production can not only improve energy efficiency but also mitigate CO2 emission (Hsu, 2013). Although there are some promising technologies such as electrolysis of water by photovoltaic, biomass supercritical water gasification and biomass fermentative hydrogen technology that have been studied for several years are still not industrialized in large scale in China (Ren et al., 2013). Meanwhile, some other innovative pathways for hydrogen production such as photosynthesis process and biological water-gas shift reaction are still in pilot stage (Kalinci et al., 2009). It could be concluded that research and development of hydrogen technology is also a main mission for enhancing the sustainability of hydrogen supply chain in China.
All to all, the results determined by the proposed method are consistent with the actual status of the hydrogen supply chain in China, and the weak points and the core problems that influence the sustainability of hydrogen supply chain are identified. According to the results, some specified actions could be obtained for enhancing the sustainability of hydrogen supply chain in China. Therefore, it can be concluded that the proposed method is useful for enhancing the sustainability of hydrogen supply chain. In addition, this method can be popularized to some other cases, and more influencing factors are allowed to be added in this method and more stakeholders are allowed to participate in process of enhancing the sustainability of hydrogen supply chain. But, it is also worth pointing out that there are also some weak points in DEMATEL method for sustainability analysis of hydrogen supply chain, namely some subjective factors such as willingness and preferences of the experts’ involve in the calculation. These subjective factors have negative impact on the accuracy of the results, and large sample is beneficial to the accuracy of the direct-influenced matrices. Thus, the future work is to have a further discussion on mitigating the negative impacts caused by these subjective factors.
Acknowledgments
This chapter is reprinted from International Journal of Hydrogen Energy, 38(33), Author(s), Ren, J., Manzardo, A., Toniolo, S., & Scipioni, A. Sustainability of hydrogen supply chain. Part I: identification of critical criteria and cause–effect analysis for enhancing the sustainability using DEMATEL. Copyright (2013), with permission from Elsevier.