This chapter goes into more detail of HoloLens development using Unity and Visual Studio. This incorporates the architecture of your application and what you will need to debug your application.
Application Architecture
To understand how your applications run and behave you will need to understand the architecture and lifecycle of your application. There are several parts you need to understand, to get a grip on how your application acts in certain conditions. A mixed reality application is built using Unity and Visual Studio. The application runs mainly on the Unity engine using scripts on GameObjects and possibly on code that is written outside the Unity space to perform, for example, other functionality that is not available via Unity. In our case, that is using DLLs to run asynchronous calls to web services due to the single thread mechanism of Unity.
Scripting Lifetime
Unity works with an event system using event functions. Event functions are called at a certain time once or more, depending on the function, to execute scripting in a MonoBehaviour-derived class in the current running scene. This order is called the order of execution. The order in which those event functions are called influences how your application responds. That means you need to understand the order and when each function is called, as you are building a mixed reality application using Unity. Which events are called differs from running the application outside or inside the Unity Editor.
There is no particular order in which objects inside a scene receive the events. You can’t assume that object X is called before object Y. To resolve such issues, you can make use of the Singleton pattern. Do not use the Singleton pattern on a class derived from MonoBehaviour, since that will result in unexpected behavior due to timing issues.

Scripting lifecycle in Unity for applications
Initialization: The Initialization phase is called for each object in the scene when the scene is loaded the first time. Objects added later to that scene are handled in the same way. These events are all called once before the object proceeds to the next phase. Several different phases are passed through during each frame cycle.
Physics: The Physics phase handles all events related to the physics of objects in the scene. Think of processing animations, triggers, and collisions, but also the call to yield WaitForFixedUpdate.
Input events: This phase handles the implemented OnMouse events.
Game Logic: The Game Logic phase is supposed to be used for handling all game logic in your application. Think of updating the location of an object or data presented from a source or specific functions. This phase is also used to process moves for animations. Yields methods and coroutine methods like yield null, yield WaitForSeconds, and yield StartCoroutine() are also handled in this phase. Most of your code will happen in the Update() method. But keep in mind that since these methods are called for each frame cycle, heavy code can cause disruption and performance issues in your application.
Rendering: The Rendering phase is used for rendering the scene, the graphical user interface, and Gizmos. Gizmos can be used as a visual aid for debugging your scene. It allows you to draw all kind of different graphical objects like lines, cubes, text, and others. Gizmos can only be used when running in the Unity Editor. It is not available in your application outside the Unity Editor. In that case, you will need to write your own code to draw lines, cubes, and other graphical output.
Decommissioning: This phase takes care of cleaning everything up. The events called are mostly for quitting the application, and disabling and destroying objects.
Custom Events
It is also possible to create your own events in Unity by using UnityEvents or C# events. Both can be used for different types of functionality like content driven callbacks, predefined calling events, and decoupling of systems. Decoupling of systems is a very important one. Unity scripting code can easily and quickly become entangled, hard to read and convert to complex systems where objects are relying on each other by deep links. Using an event system can prevent this.
Both event systems use the same principle. You define and create an event. Then you add listeners to your event. Listeners are callbacks that you register for a certain event. As soon as the event is invoked, all registered listeners are called.
Static: These function calls are set through the UI of Unity. They use preconfigured values defined in that UI. When the event is invoked, the preconfigured value in the UI is used.
Dynamic: These function calls use the arguments that are sent from the scripting code. This is bound to the type of UnityEvent. The filters used in the UI filter the available callbacks and show only valid calls for the event.
UnityEvents are added to a class derived from MonoBehaviour. Their behavior is the same as standard .NET delegates.
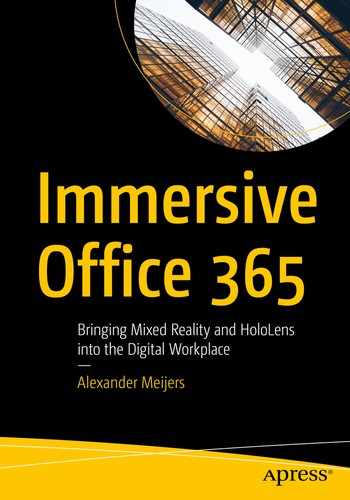
A static function event added through the UI of Unity
Select the type Runtime Only or Editor and Runtime, which determines if the listener only works in runtime or both editor and runtime. In this example, I have dragged the EventManager GameObject into the Object field. That allowed me to select the DoAction(int id) method defined in that class. Since this is a static function call, I must define its value in the UI.

A dynamic event is added through the UI of Unity
In this case, you will notice that when you select the function it shows all dynamic functions at the top in the dropdown. That is done through the filtering mechanism, based on your custom-defined event. You also do not need to specify a value. The value is set through the Invoke() method on the event by calling idEvent.Invoke(23);.
Make sure that the custom UnityEvent class is defined with [Serializable]. Otherwise, it will not appear in the Inspector window of the UI of Unity.
Using UnityEvents is easy and allows you to create an event system for your application by only using the UI interface of Unity. UnityEvents are easy for people who use drag and drop or when they are creating Unity Editor plugins.
Time and Framerate
The current actions of the CPU
Using video streaming or Miracast will downgrade the framerate by half.
Complex and long execution of code written in the Update() event running inside a single framerate
Even if the system is stable enough, it does not guarantee that the length of time between two Update() event calls is always the same. Moving an object using the Update() event will cause an irregular speed, since the time between two Update() calls are not the same.
The property distancePerSecond specifies the distance that the object is moving per second. Multiplying this by the delta time of the framerate will assure that the object is moving the same speed over time. In this case, it is 10 centimeters per second.
Physics in the application makes use of a fixed timestep to maintain accuracy and consistency during the run of the scenario. The system uses a kind of alarm, which will define when physics is doing the calculations. Physics are updated when the alarm goes off. It is possible to change the time of the fixed timestep by using the Time.fixedDeltaTime property . A lower value will result in more frequent updates of the physics but will result in more load on the CPU.
The system takes care of an accurate simulation of physics due to the fixed timestep. But if framerates drop due to various reasons, it can cause issues for the regular updates to be executed, which will result in frozen objects or graphics that get out of sync. As soon as the framerate time takes longer than the maximum allowed timestep, the physics engine stops and gives room for the other steps taken place in the update() event.
It is also possible to slow down the time, to allow animations and script to respond at a slower rate. For this, Unity has a Time Scale property. The Time Scale property controls how fast time is executed relative to real time. A value above 1 will speed up the execution time, while a value below 1 will slow down the execution time. Time Scale is not really slowing down the execution time, but changes the values of both properties Time.deltaTime and Time.fixedDeltaTime to achieve the same result. Time Scale is set through the Time.timeScale property.
With Microsoft HoloLens it sometimes happens that you want to record or stream the video output. Both situations will drop the current framerate by half. That means that your application runs at only 30 frames per second. This is caused by the capturing mechanism of the camera. The performance will also drop, and other visual effects like drifting can take place. There seems to be a solution for this with Unity. Unity provides a Time.captureFramerate property. When the property is set higher than zero, the execution time will be slowed down and frame updates will be executed at a precise regular interval. This can result in better recording or streaming. Nowadays it is possible to stream the output of the Microsoft HoloLens 2 using Miracast to other devices like a laptop without having a framerate drop.
Unity DOTS

An architectural overview of Unity DOTS
C# Job System: This system is used for running multithreaded code efficiently using C# scripting. It allows users to write safe and fast code by exposing the native C++ Job System through C# scripting.
Entity Component System: This system allows programmers to write high-performance code. It takes care of everything for you and allows you to focus mainly on writing your code for data and behavior in your application.
Burst compiler: This compiler can produce highly optimized native code across multiple platforms by using a new LLVM-based backend compiler.
Due to these features, programmers can write multithreaded code with massive performance gains running inside a sandbox. There are several advantages to using this system. It is easier to build scenes with complex simulations that run on a large set of different hardware. Code can be more easily reused due to moving from object-oriented to data-oriented design.
Debugging
Creating applications for HoloLens will not always go as smoothly as you want. This chapter explains how you can debug your application, even when it is running on a HoloLens device or running in the HoloLens emulator.
Lifecycle of Application
Debugging your script files in the Unity Editor
Debugging you script files when your app runs at a device or emulator
Debugging with Unity
Debugging with Unity is one of the easiest forms of debugging your C# scripts with a managed debugger. But it requires you to run your solution in the Unity Editor. While that is OK when testing basic stuff like scene setup, camera, and other Unity specific functions, as soon as you are accessing external code or want to test gestures outside the Unity Editor, you will need to start debugging script on your device or emulator.

Double-click the script you wish to debug
That will start a Visual Studio, which allows you to start a managed debugger. When Visual Studio has loaded all the scripts from the project, the double-clicked script is selected.
Start the project in the Unity Editor by pressing the play button

Set the breakpoint and attach the managed debugger to Unity

The managed debugger hits the breakpoint, allowing you to debug the C# script
Debugging at Your Device or Emulator
The following will describe how we can debug our scripts when running the application on a Microsoft HoloLens 2 device or in the Microsoft HoloLens 2 emulator. Before we can start debugging, some settings and prerequisites must be met to get it to work.
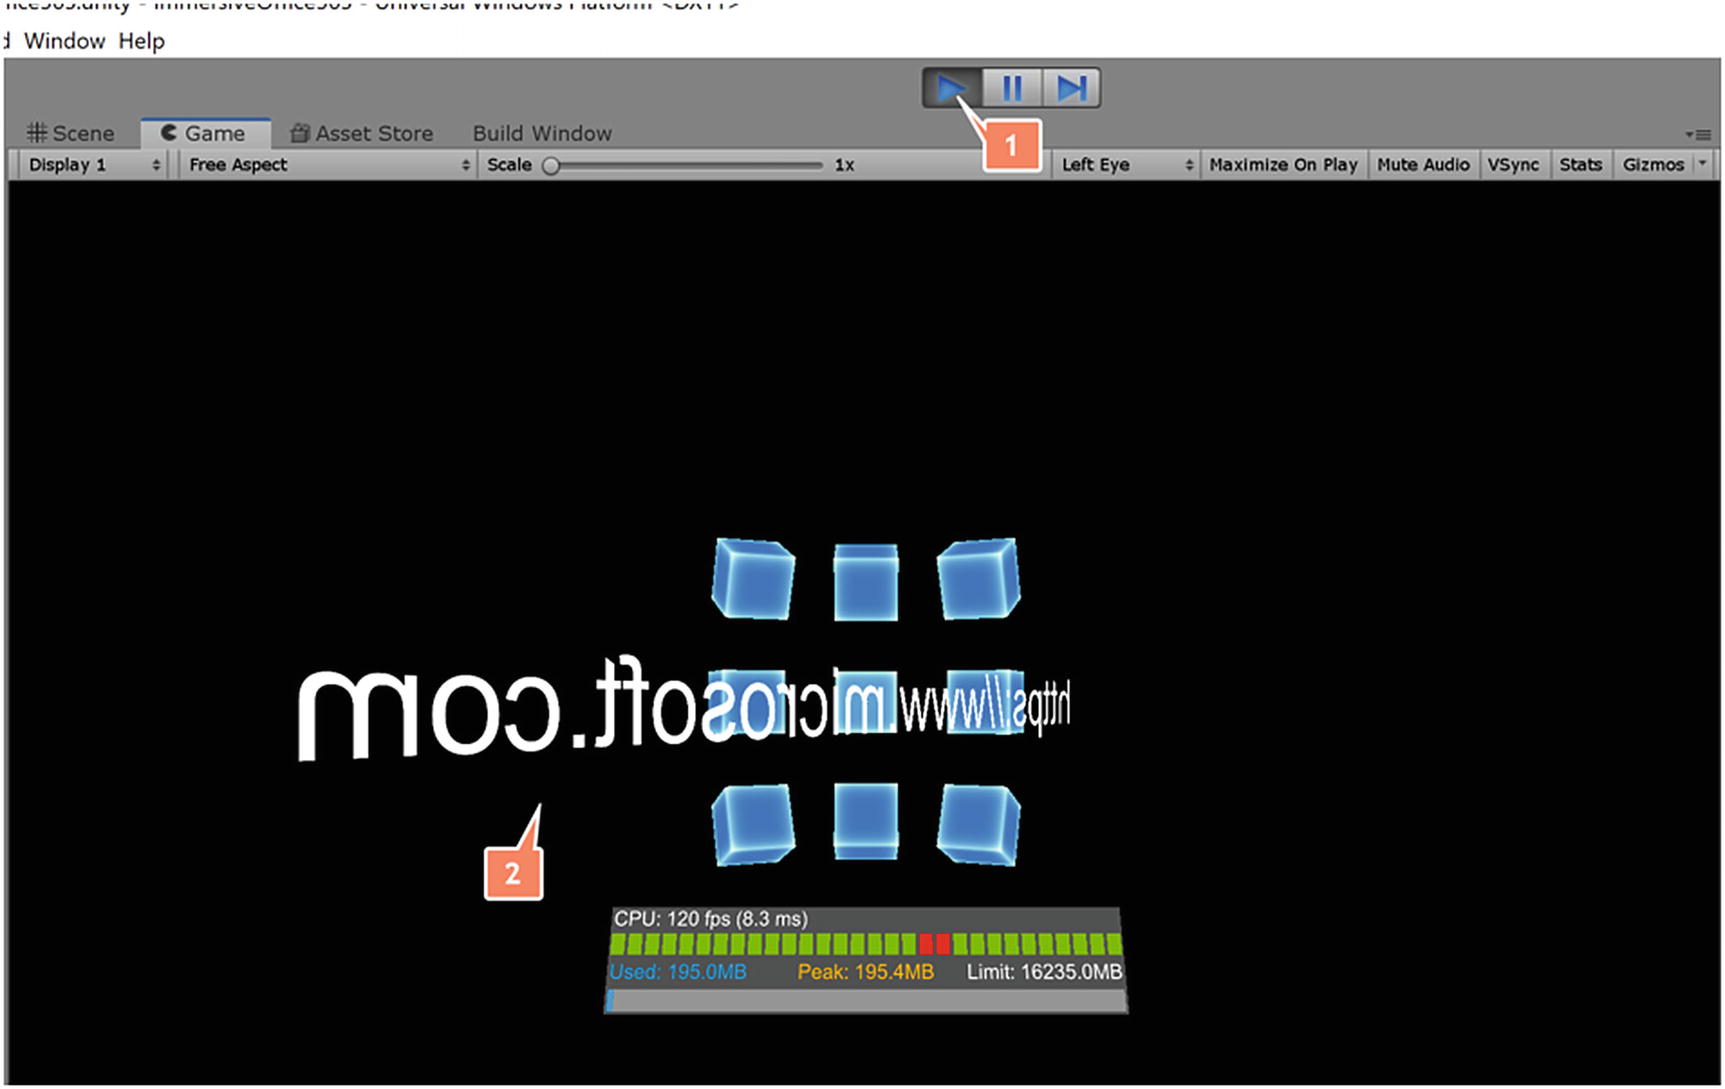
Configuring the Player settings of the Unity project
InternetClient
InternetClientServer
PrivateNetworkClientServer
These capabilities will allow the debugger to connect through the network capabilities of the device or the emulator.

Configure build settings for managed debugging
Make sure that the options Copy References, Development Build, and Script Debugging are selected.

This dialog will be shown when the option Wait For Managed Debugger is selected
The last thing you need to take care of is making sure that Visual Studio is not blocked by the firewall on your machine. Make sure that Visual Studio is allowed to put anything through via TCP and UDP.
Configure the build settings for building and deploying to the device or emulator
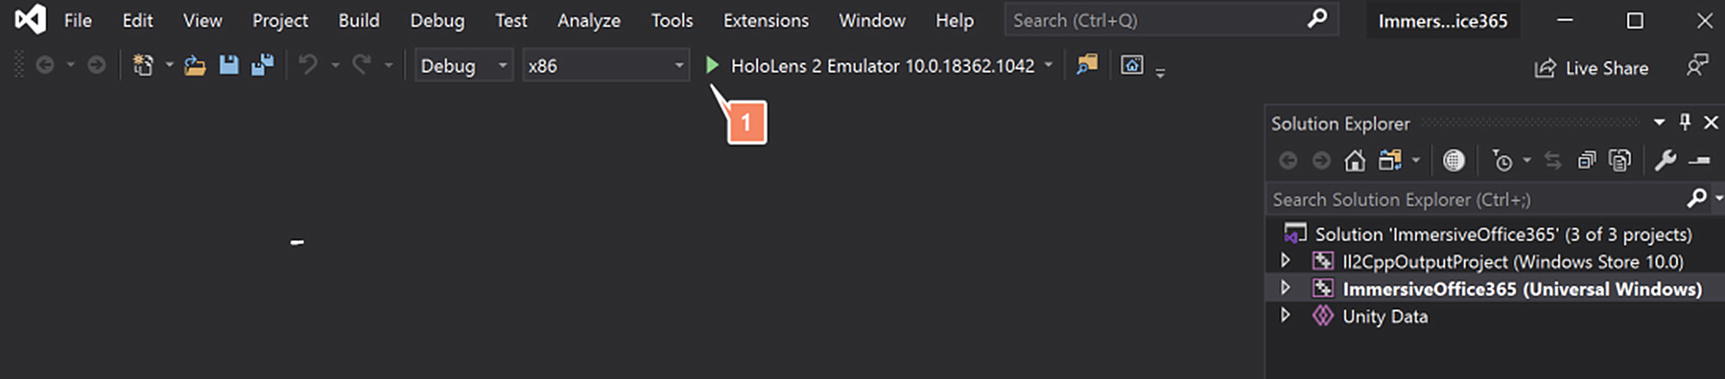
In this example, we will be debugging the app using a Microsoft HoloLens 2 Emulator. Select Debug and x86 from the dropdown boxes at the top. Select the HoloLens 2 Emulator as the target.
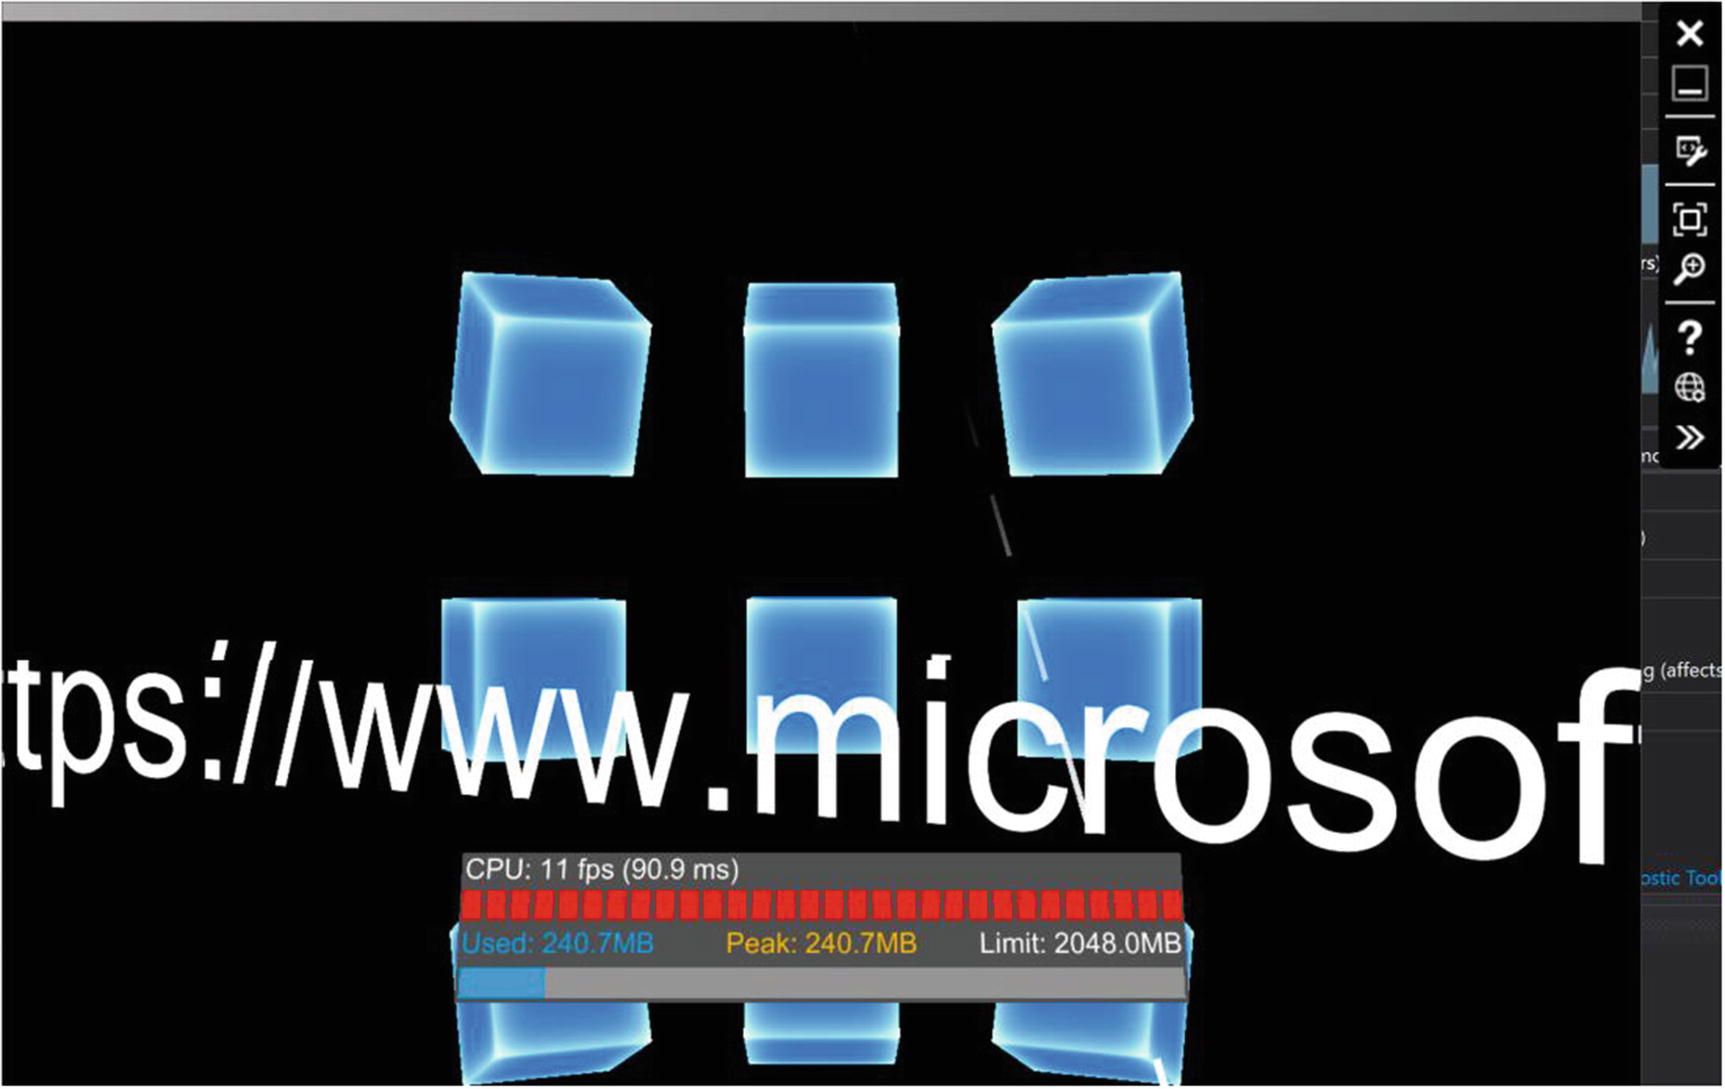
The application is running in the Microsoft HoloLens 2 emulator

Double-click the script you want to debug to open Visual Studio

Visual Studio as the managed debugger with a breakpoint set in C#
This time, we have the C# scripts in front of us. Place your breakpoint at the row that you want to debug into.
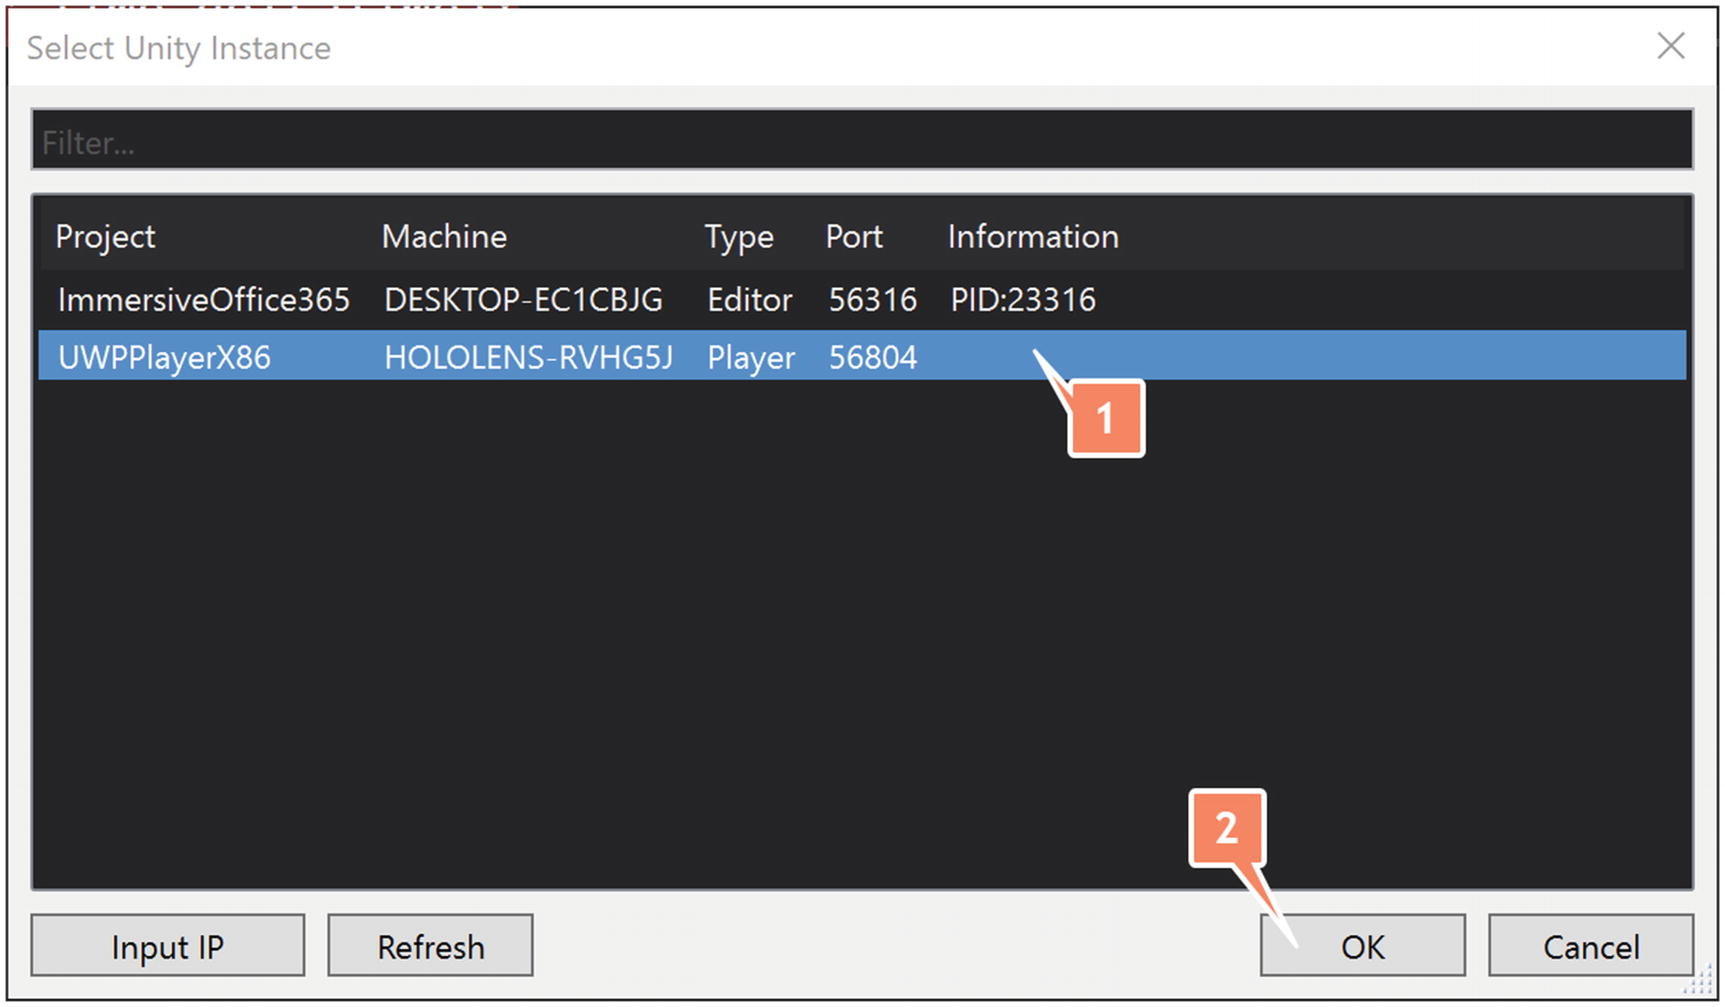
Select the instance running on the device or emulator
If you instead click Attach to Unity at the top of Visual Studio, that would connect to the Unity instance by default, rather than showing all available instances.
There are some issues with different versions of the Microsoft HoloLens 2 emulator that cause the device not to appear when you want to connect your managed debugger. At the time of writing this book we used the Visual Studio 2019 version 16.4.2 and the Microsoft HoloLens 2 emulator version 10.0.18362.1042 together with Windows 10 version 1909 build 18363.535. Make sure you are using at least the same or higher versions.

The managed debugger hits the breakpoint, allowing you to debug the C# script
This technique allows you to debug your C# scripts using a managed debugger. Keep in mind that changing the C# scripts will require a solution build from Unity and a build and deploy from Visual Studio.
Performance monitoring
Building applications for devices like the Microsoft HoloLens requires a certain skill to think further than only programming and creating scenes in Unity. Everything you do has an impact on how the CPU, GPU, and the HPU are utilized. Using, for example, more CPU can impact the performance of your application. But it can also impact the battery life of the device. It is possible to build applications that literally drain your batteries in less than 1 hour.
Heavy scenes will affect the framerate of your applications. Normal applications should run around 60 frames per second (fps). The lower the fps, the more unstable your application becomes. Instability could develop into drifting of holograms, color changes, and even hanging holograms.
There are several techniques that can help to create better performing applications for Microsoft HoloLens 2. This book we will not go into detail. Check the appendices for references to improvements to your application.
Performance tracing: Performance tracing captures Windows Performance Recorder (WPR) traces from your device. There are several profiles available to choose from. To perform a trace, you can select the profile and start tracing. As soon as you want to stop tracing, click the stop link and wait till the complete trace file has been downloaded.
Viewing processes: You can view all the running processes through the processes page. Each process has memory in use, CPU utilization, and the account that is used to run the process specified. This list contains both application processes as system processes.
System performance: This allows you to view current system metrics as graphs of different systems in your device in real time. Metrics like system-on-chip power and system power utilization, GPU utilization, percentages of CPU used, how many I/O read and writes are happening, network connectivity, memory, and the number of frame rates per second. The information shown can differ if you are running on an emulator or HoloLens device.
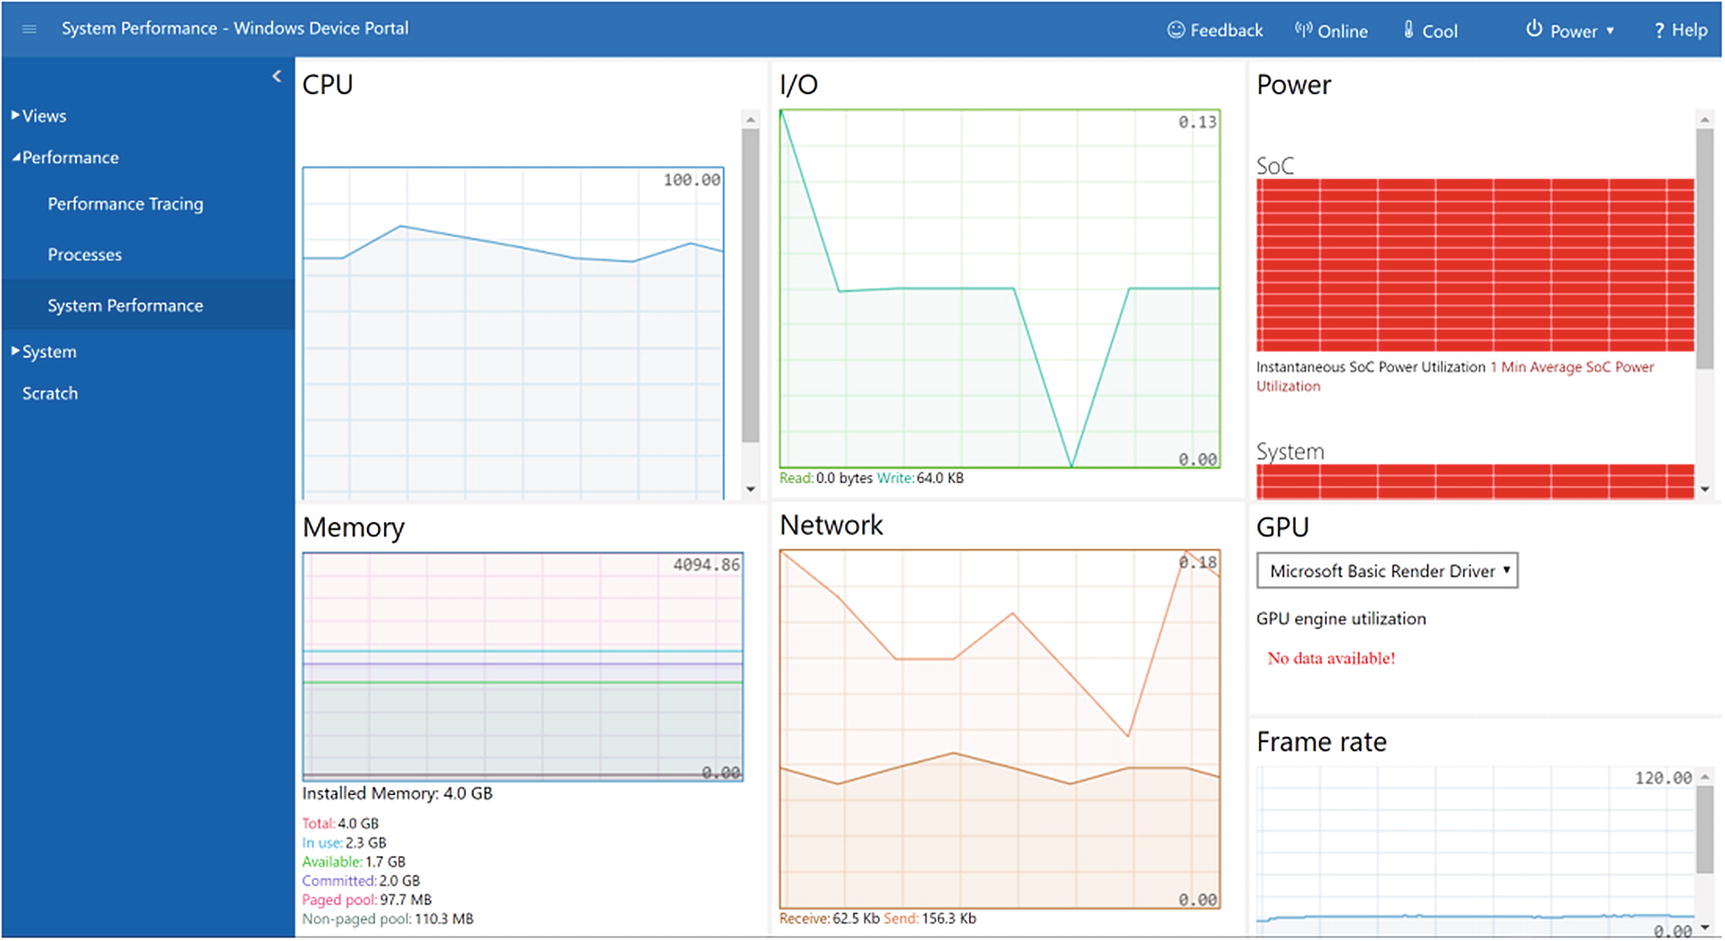
An example of the system performance graphs on an emulator