Chapter 4. Waste
Write Less Code
If we were to look for the root cause of waste in software development, a really good candidate would be complexity. Complexity calcifies our code and causes it to turn brittle and break. In Conquering Complexity in Your Business, Michael George suggests that complexity is like cholesterol: It clogs up the arteries of an organization; it is “the silent killer of profits and growth.1 The prescription for complexity in software development is simple: Write Less Code!
Let’s take a look at how a multibillion Euro company has gone about doing just that.
Zara
When Madonna gave a series of concerts in Spain recently, the outfit she wore at her first concert could be spotted on teens in the audience at her last concert. The Madonna look-alike outfits were purchased at Zara, a rapidly growing fashion clothing chain. Zara’s strategy is to be a fast follower, betting that it’s more profitable to develop the fashions its customers ask for than to push new designs onto the market. In the rapidly changing world of fashion, a fast follower has to be very fast—Zara can go from concept to cash in two weeks; entirely new lines might take a month.
Zara accounts for perhaps 70 percent of the sales of Inditex, a clothing company located in western Spain with over €5 billion in annual sales. Zara competes fiercely with Stockholm-based H&M, Venice-based Benetton, and San Francisco-based Gap and posts some of the healthiest profits in its industry. It has close to 900 stores as of this writing, about three-quarters of them in Europe, and is expanding rapidly.
Instead of hiring high-profile designers to create new products for each selling season, Zara hires the best graduates from design schools and has them work with store managers to create the garments that customers are looking for. Zara launches 11,000 new items a year, compared to its competitors’ 2,000 to 4,000.2 Zara stores are lightly stocked. Orders are sent to headquarters twice a week, and the clothes arrive two or three days later—on hangers, priced, and ready to sell. Zara eschews economies of scale and manufactures in small lots, usually in cooperatives in western Spain. It operates well below capacity so as to be able to maintain its ability to fill orders twice a week even during peak demand.3
Zara gets more revenue for its efforts than its competitors: It sells 85 percent of its stock at full price, compared to an industry average of 60 percent to 70 percent. Unsold items account for less than 10 percent of sales compared to an industry average of 17 percent to 20 percent.4 Zara also spends less money than its competitors: Zara’s parent company, Inditex, spends about 0.3 percent of sales on advertising compared to a 3 percent to 4 percent industry average. And it spends perhaps 0.5 percent of sales on IT compared to an industry average of about 2 percent.5
Stop. Let’s go over that one again. A €5 billion company spends 0.5 percent of sales on IT? Indeed, Inditex’s IT staff of about 50 people develops all of its applications. Stores use PDAs and a modem to transmit sales totals and new orders to headquarters. Instead of a CRM system, designers are expected to talk to store managers. And with such low inventories, an ERP system would be overkill. Interestingly, the CEO who orchestrated this minimalist approach is a former IT manager.6
In “Do You Have Too Much IT?”7 Andrew McAfee lists five principles that guide Inditex’s use of technology:
1. IT is an aid to judgment not a substitute for it. Information systems help managers sort though the data they need to make decisions, but they do not make decisions for people, or even suggest them.
2. Computerization is standardized and targeted. Stores and regions are not allowed to deviate from the single corporate solution, and developers minimize system features rather than maximize them.
3. Technology initiatives begin from within. Business goals always shape the company’s use of technology, not vice versa. The IT department works with line managers to understand their needs, and only then do they look at available technology to find solutions.
4. The process is the focus. The store’s PDAs are not “personal productivity devices” for managers. They support the daily cadence of sales reports and the twice-weekly cadence of orders and shipments. They enforce a consistent process across all stores.
5. Alignment is pervasive. It helps to have a CEO who used to be an IT manager, but business-IT alignment takes much more. The business people and technology people really understand each other’s worlds. There is no we-they divide and no over-the-wall software.
Complexity
Just about every start-up company with a single software product is nimble and can quickly respond to customers and adapt to change. But after a couple of years of success, software companies often start to slow down and become unresponsive. They have developed a complex code base, a complex array of products, and a complex organizational structure. Unless they get the complexity under control quickly at this point, it will gradually strangle the very responsiveness that gave the company its initial competitive advantage.
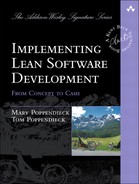
The cost of complexity is not linear, it is exponential, and the cost of complexity eventually comes to dominate all other costs in most software systems (see Figure 4.1). Complex code is brittle and breaks easily, making it almost impossible to change safely. Wise software development organizations place top priority on keeping the code base simple, clean, and small.
Justify Every Feature
The first step to controlling complexity is to aggressively limit the features and functions that make it into the code base in the first place. Every feature that gets developed should pass the hurdle of proving that it will create more economic value than its fully loaded, lifecycle cost. Loading software products with a laundry list of features is the lazy approach to marketing: We don’t know what customers will value, so we put in lots of features in hopes that customers will find some things they like. But loading software with features is worse than just laziness; it’s a recipe for disaster. Software is complex by nature, and unless that complexity is carefully managed, it rapidly grows out of control.
It takes courage to limit the feature set of a development effort, but it almost always pays for itself many times over. In the product world, launching a product with just the right features, no more and no less, demonstrates that the company really understands what customers want. This was Intuit’s strategy when it launched QuickBooks. Intuit realized that very small businesses did not want software designed for accountants, and so it developed a product that did not even have double entry bookkeeping, something its competitors considered fundamental. Intuit understood well who its customers were and what job they were trying to do, and delivered only the capabilities that its customers were looking for.
Jeff Sutherland, CTO of PatientKeeper (a company we discuss in Chapter 5) emphasizes that developers should not develop any feature until there is a well-defined market demand. He says:8
The task then is to refine the code base to better meet customer need. If that is not clear, the programmers should not write a line of code. Every line of code costs money to write and more money to support. It is better for the developers to be surfing than writing code that won’t be needed. If they write code that ultimately is not used, I will be paying for that code for the life of the system, which is typically longer than my professional life. If they went surfing, they would have fun, and I would have a less expensive system and fewer headaches to maintain.
Minimum Useful Feature Sets
Whether we are developing custom or product software, the ideal approach is to divide the software into minimum useful feature sets, and deploy these one set at a time, highest priority (or highest payback) first. A minimum useful feature set is one which helps customers do a useful portion of their job better. While there are environments in which an all-or-nothing approach might seem like the only way to proceed, this is rarely necessary either from a technical or from the customers’ job point of view.9 We have been conditioned to think that the large-batch, all-or-nothing approach to software development is good. It’s time to recondition ourselves to think that this is the worst possible approach to good software development.
Deploying small, useful feature sets in a custom development project allows customers to start using the software much faster. When these feature sets start generating a return on investment earlier, the company can invest less money, payback the investment sooner, and, usually, generate more profit over the life of the system.10 Technically, implementing minimum useful feature sets is not only practical, but when done correctly, the code is refactored and simplified with each new feature set. This helps minimize the complexity of the code base, thus minimizing its lifecycle cost. From a customers’ viewpoint, receiving minimum useful feature sets means getting their job done sooner and finding out how they really would like the software to work while there is plenty of time to ask for changes. And from a sustainability point of view, systems implemented incrementally with minimum useful feature sets are usually easier to maintain because incremental development can be extended over the life of the system. There is nothing not to like about implementing software in minimum useful feature sets.
Don’t Automate Complexity
We are not helping our customers if we simply automate a complex or messy process; we would simply be encasing a process filled with waste in a straight jacket of software complexity. Any process that is a candidate for automation should first be clarified and simplified, possibly even removing existing automation. Only then can the process be clearly understood and the leverage points for effective automation identified.
The Seven Wastes
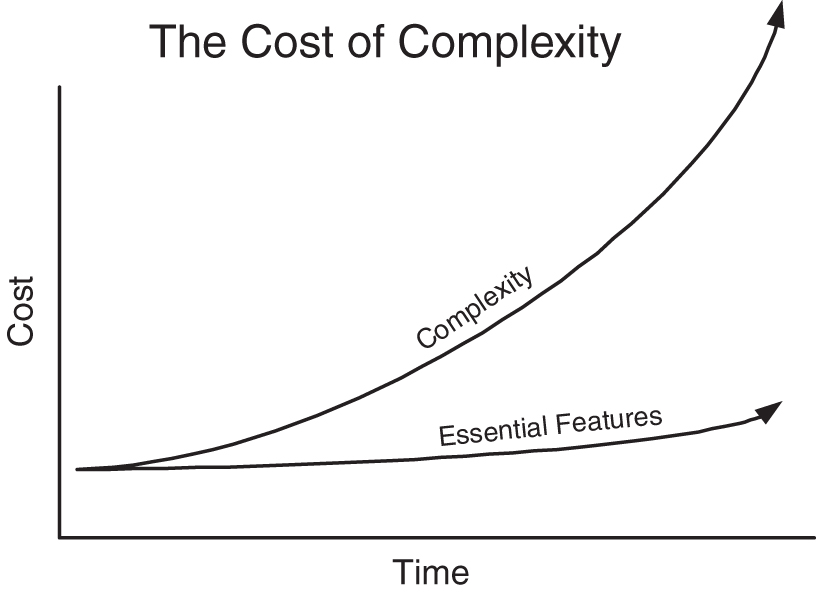
Everyone who has studied lean manufacturing has learned Shigeo Shingo’s seven wastes of manufacturing.11 In our previous book, we translated these seven wastes into the seven wastes of software development. In this section we revisit that translation, making a few changes presented in Table 4.1. Finding waste is not about putting waste in a category; categories help reinforce the habit of seeing waste. The real purpose of discovering and eliminating waste is to reduce costs and make our products more effective.
Partially Done Work
The inventory of software development is partially done work. The objective is to move from the start of work on a system to integrated, tested, documented, deployable code in a single, rapid flow. The only way to accomplish this is to divide work into small batches, or iterations.
Extra Features
Taiichi Ohno emphasized that overproduction—making inventory that is not needed immediately—is the worst of the seven wastes of manufacturing. Similarly, the worst of the seven wastes of software development is adding features that are not needed to get the customers’ current job done. If there isn’t a clear and present economic need for the feature, it should not be developed.
Relearning
Recently we were participating in a panel discussion about how agile software development affects customers when someone asked, “Are there any customers in the room? We should hear the perspective of real customers.” One lonely person raised his hand. He was asked, “What makes agile development challenging for you?”
“I think,” he said, “that the biggest problem I have is remembering what decisions I have already made and what things I have already tried, so I tend to try them over again.”
Rediscovering something we once knew and have forgotten is perhaps the best definition of “rework” in development. We know we should remember what we have learned. Nevertheless, our approach to capturing knowledge is quite often far too verbose and far less rigorous than it ought to be. The complex topic of creating and preserving knowledge will be addressed further in Chapter 7.
Another way to waste knowledge is to ignore the knowledge people bring to the workplace by failing to engage them in the development process. This is even more serious than losing track of the knowledge we have generated. It is critical to leverage the knowledge of all workers by drawing on the experience that they have built up over time.
Handoffs
There’s nothing quite like teaching a child how to ride a bicycle. First she has to learn balance while moving, so you run along beside her holding the bike lightly until she gets the hang of it. That’s pretty tiring, so the moment she has just a bit of the feeling of balance you quickly teach her how to get started. The first time she successfully pedals away from you, it suddenly dawns on you that you have forgotten to teach her how to stop! A few more mishaps, and the child is on her own. A couple of hours later you are amazed at how confidently she is hurtling down the path, starting easily and stopping with brakes screeching.
Handoffs are similar to giving a bicycle to someone who doesn’t know how to ride. You can give them a big instruction book on how to ride the bike, but it won’t be much help. Far better that you stay and help them experience the feeling of balance that comes with gaining momentum. Then give some pointers as they practice starting, stopping, turning, going down a hill, going up a hill. Before long your colleague knows how to ride the bike, although she can’t describe how she does it. This kind of knowledge is called tacit knowledge, and it is very difficult to hand off to other people through documentation.
When work is handed off to colleagues, a vast amount of tacit knowledge is left behind in the mind of the originator. Consider this: If each handoff leaves 50 percent of the knowledge behind (a very conservative estimate) then:
• 25 percent of the knowledge is left after two handoffs,
• 12 percent of the knowledge is left after three handoffs,
• 6 percent of the knowledge is left after four handoffs, and
• 3 percent of the knowledge is left after five handoffs.
Because tacit knowledge is so difficult to communicate, handoffs always result in lost knowledge; the real question is how to minimize that waste.
Task Switching
Software development requires a lot of deep concentrated thinking in order to get one’s arms around the existing complexity and correctly add the next piece of the puzzle. Switching to a different task is not only distracting, it takes time and often detracts from the results of both tasks. When knowledge workers have three or four tasks to do, they will often spend more time resetting their minds as they switch to each new task than they spend actually working on it. This task switching time is waste.
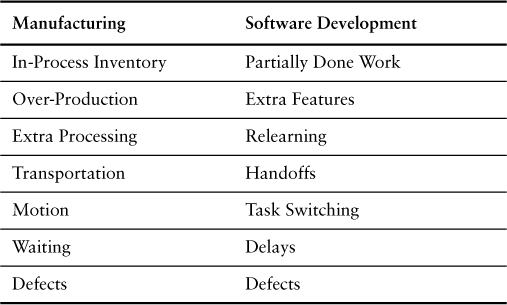
Furthermore, trying to do multiple tasks at the same time usually doesn’t make sense. Assume that you have three tasks to do, tasks A, B, and C. Assume for the sake of argument that each task takes a week. If you do the tasks one at a time, then at the end of the first week, task A will be done and begin delivering value. At the end of the second week, task B will also be delivering value, and at the end of their third week, you will be done with all three tasks and a lot of value will already have been realized.
But let’s say that you decide to work on all three at once, perhaps to make the customer for each task feel that their work is important to you. Figure 4.2 shows the best case outcome for this scenario. Each task is divided into eight even parts, and a minimum amount of time spent in task switching. Even with this ideal case, none of the tasks will be done at the end of three weeks. In addition to the wasted time needed to complete the tasks, the potential value they could have contributed by being done earlier is also wasted.
Delays
Waiting for people to be available who are working in other areas is a large cause of the waste of delay. Developers make critical decisions about every 15 minutes—and it’s naive to think that all the information necessary to make these decisions is going to be found in a written document. A decision can be made quickly if the developer has a good understanding of what the code is supposed to accomplish, and if there is someone in the room who can answer any remaining questions. Lacking that, developers have three options: stop and try to find out the answer, switch to some other task, or just guess and keep on going. If the hassle factor of finding out the answer is high, the developer will take the second or third course of action. If there isn’t much penalty involved, developers are likely to spend a good deal of time waiting for answers before they proceed. None of these approaches is good.
Complete, collocated teams and short iterations with regular feedback can dramatically decrease delays while increasing the quality of decisions. This is not the only approach to reducing delays, but no matter where team members are physically located, it is important to make sure that knowledge is available exactly when and where it is needed—not too soon, or it will have to be changed, and not too late, or it will have to be ignored.
Defects
Every code base should include a set of mistake-proofing tests that do not let defects into the code, both at the unit and acceptance test level. However, these tests can only prove that the code does what we think it should do and doesn’t fail in ways that we anticipated. Somehow software still finds devious ways to fail, so testing experts who are good at exploratory testing should test the code early and often to find as many of these unexpected failures as possible. Whenever a defect is found, a test should be created so that it can never happen again. In addition, tools may be needed to test for security holes, load capability, and so on. Combinatorial test tools can also be very useful. We should attempt to find all defects as early as possible, so that when we get to final verification, we do not routinely find defects. If software routinely enters final verification with defects, then it is being produced by a defective process.
A good agile team has an extremely low defect rate, because the primary focus is on mistake-proofing the code and making defects unusual. The secondary focus is on finding defects as early as possible and looking for ways to keep that kind of defect from reoccurring.
But the real reason for moving testing to the beginning of development is deeper than mistake-proofing. Acceptance tests are best when they constitute the design of the product and match that design to the structure of the domain. Unit tests are best considered the design of the code; writing unit tests before writing code leads to simpler, more understandable, and more testable code. These tests tell us exactly and in detail how we expect the code and the ultimate product to work. As such, they also constitute the best documentation of the system, documentation that is always current because the tests must always pass.
Mapping the Value Stream
As we mentioned in Chapter 2, Taiichi Ohno summed up the Toyota Production System thus: “All we are doing is looking at the timeline from the moment a customer gives us an order to the point when we collect the cash. And we are reducing that timeline by removing the nonvalue-added wastes.”15 The timeline that Ohno mentions can be drawn as a value stream map, a diagnostic tool frequently used in lean initiatives. We like to use the same timeline diagnostic in a development environment, but we change the start and stop points to reflect the different interaction of a customer with development.
Value stream maps always begin and end with a customer. In development, the clock starts on a value stream map when a customer places an order—exactly what this means will differ from one organization to the next. The clock stops when the solution is successfully deployed—or launched—solving the customer’s problem. The value stream map is a timeline of the major events that occur from the time the clock starts until it stops.
The objective of lean is to reduce the development timeline by removing nonvalue-adding wastes. Value stream maps have proven remarkably effective at exposing waste, because delays in the flow are almost always a sign of significant waste. By looking for long delays (which indicate queues) and loop-backs (which indicate churn), a clear picture of the waste in the process emerges. In our classes, small teams do rough value stream maps in a half an hour. Even though these maps are rough guesses at reality, they are surprisingly useful in helping people understand the major issues in their processes.
Preparation
Choose a Value Stream
The first step in developing a value stream map is to decide what to map. The ideal is to map a process, not a single event, but this can be difficult in development. A good alternative is to map a single project that is representative of an “average” project or a class of projects. In choosing a value stream to map, group similar types of development together. For example, you might map how long it takes to go from product concept to launch of a medium-sized product. Or you might do a timeline for adding a high-priority new feature to an existing application.
Most software maintenance departments already understand how to group similar types of development together. Typically they divide maintenance requests into three categories and guarantee a response time by category. For example, they may guarantee resolution of an extremely urgent problem in two hours, an important problem in one day, and a routine problem may get relegated to the next biweekly release. Software maintenance organizations with service level agreements might teach us a lesson or two about value stream maps.
Choose When to Start and Stop the Timeline
The first question to answer is when to start the timeline. In new product development, it is typical to start the clock when a product concept is approved. However, this does not take into account the fuzzy front end of product development, so you might want to start the clock earlier, for example, when marketing recognizes the need. You should not start the product development clock any later than approval of product concept, even if your particular organization does not get involved until later. If you are working with embedded software, you should ideally start the clock with the main product not the software portion. The objective is to draw a value stream map from concept to cash: Start the timeline either when a customer need is identified or when the organization commits to developing a product, and stop the timeline when the product is launched.
When software is developed in response to customer requests, the timeline should generally be started when a request is submitted—assuming that the request is the equivalent of placing an order. Usually you would not wait to start the timeline when a feature is approved, because in most cases the approval process should be included in the value stream. You are looking at value from the customers’ point of view, and customers do not care about other requests or how busy you are, they care about how long it takes for you to act on their request. Back up one step and see if you can start the process from the customers’ perspective. How do customers place an order?
Identify the Value Stream Owner
You can map a value stream without an owner, but you will get a lot more mileage out of value stream mapping if the exercise is led by the value stream owner. When we do value stream maps in our class there usually is no value stream owner. We find that the biggest problems always occur at organizational boundaries, where no one is responsible for the customers’ request and people on each side of the boundary try to optimize their own local efficiency. It might languish in a queue before it gets approved, wait for ages to move from one function to another, or sit forever waiting for deployment. But unless there is a value stream owner responsible for the customers’ request throughout the system, no one seems empowered to tackle these sources of waste.
Keep It Simple
Value stream maps are diagnostic tools to help you find waste; all by themselves they usually don’t add a lot of value. They help you put on your customers’ glasses and look at your development process through their eyes. They have a tendency to change your perspective and start up useful conversations. They are a good starting point for finding and eliminating waste.
Your objective is to map maybe ten or so major steps—from customer order to customer satisfied—on one or two sheets. It is more important to go from end-to-end—from concept to cash—than to go into detail on one small area. Once you have finished the map, answer two questions:
1. How long does it take to get a product developed or to fill a customer request? (You are looking for elapsed time, not chargeable hours.)
2. What percent of that elapsed time is spent actually adding value? (This is called process cycle efficiency.16)
We have seen many different value stream map formats, every one of them acceptable because they all generate a lot of insightful discussion about waste. You might make some notations about capacity or defect rates if that helps identify waste. Just don’t lose site of the purpose of value stream maps in the process for creating them: Learn to see waste so that you can eliminate it.
Examples
Probably the best way to understand value stream mapping is to just do it. We find that people in our classes can dive in and create useful maps with a minimum of instruction. However, the value of the maps lies not in creating them, but in diagnosing what they are telling us. So we will sketch some maps that are typical of ones we have seen in our classes and discuss their implications.17
Example 1
Example 1 (Figure 4.3) shows a value stream map of a small, high-priority feature change, and is taken from a value stream map drawn in one of our classes. The customer’s request comes in by e-mail to a supervisor, who approves it in an average of two hours. It takes another two hours for a brief technical assessment, at which time it is assigned to a developer. The person describing this map to us then said: “Of course, a developer is available because this is high priority.” Thus the development starts within an hour, and the two hours of work is completed promptly. It immediately goes to final verification and is rapidly deployed. Bottom line: A small, high-priority feature takes an average of eight hours from request to deployment. Two hours and forty minutes are spent actually working on the request, which is one third of the eight hours total time, giving a process cycle efficiency of 33 percent.
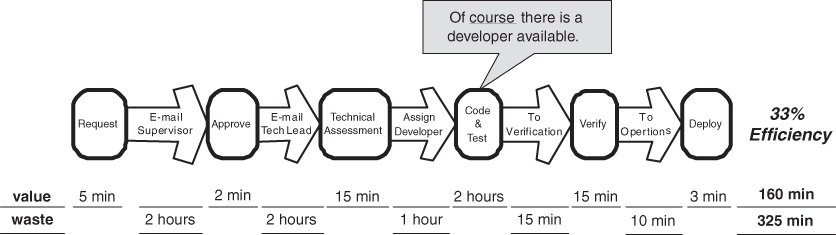
Many software maintenance organizations have processes similar to this. It is a very efficient process, as will be seen by comparison to the next example. But there is room for improvement, because the request waits for two hours for technical assessment. If the developer could also do this assessment, an average of two hours could be saved.
Example 2
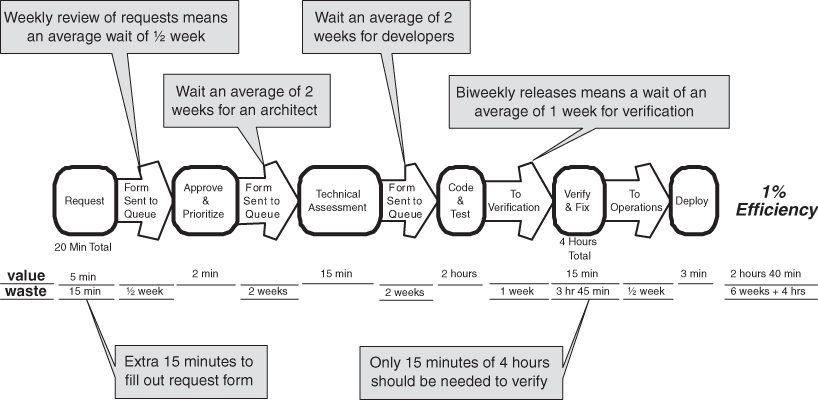
Example 2 (Figure 4.4) is a value stream map for a request of about the same size as the request in Example 1; a simple feature change that takes about two hours to code and test. However, it takes more than six weeks to complete the work. From the customers’ viewpoint, it takes an extra 15 minutes to write up a request because a standard form must be used that requires a lot more information. Since requests are reviewed once a week, the request waits an average of a half week before approval. Then the request waits an average of two weeks for one of the scarce architects, and after a technical review, it waits an average of two more weeks for developers to become available. After two hours of coding and testing, the request waits for an average of a week, because releases are scheduled for once every two weeks. Just before release there is a final verification. Even though the code was thoroughly tested when it was written, some code added to the release package in the last week has introduced a defect into the feature which went undetected until final verification. So it takes four hours to fix and retest the release, which, you will notice, is twice the time it took to write and test the code in the first place. Since verification only took 15 minutes in the previous example, the other three hours and forty five minutes are waste introduced by the process. Finally everything is ready to deploy, but it takes an average of another half week for the original requestor to get around to using the new feature in production.
Examples 1 and 2 are close approximations of real value stream maps that were done in the same class, so we were able to ascertain that the environments and problems were quite similar. Organization B agreed that if they had been using the process of Organization A, they could have completed their request in about a day.
There are two lessons to take away from these two examples. First, even though developers in both organizations are equally busy, Organization A was organized so that there were always some developers available to drop low-priority work to tackle high-priority requests. On the other hand, Organization B was focusing so hard on full resource utilization that the request had to wait twice in queues that were two weeks long. As we will see in Chapter 5, chasing the phantom of full utilization creates long queues that take far more effort to maintain than they are worth—and actually decreases effective utilization. Organization A was able to eliminate the overhead of maintaining queues by using low-priority tasks to create slack and scheduling high-priority tasks Just-in-Time.
The second lesson is that periodic releases force us to accumulate batches of undeployed software. The biweekly releases of Organization B encouraged the development team to accumulate code changes for two weeks before integration testing. This is a mistake. Even if releases are periodic, integration testing should be done much more frequently. The goal is that the final test should not find defects; they should have been found earlier. If you routinely find defects at final testing, then you are testing too late.
It’s pretty clear that the overhead of the queues maintained by Organization B, as well as the wasteful big-bang integration at the end, completely overwhelmed any phantom utilization advantage of their batch-and-queue approach.
Example 3
In Example 3 (Figure 4.5) we examine the value stream map of a fast-track project similar to one we saw in a class. Due to competitive pressure, the company was in a hurry to get features developed, so the features were divided into small projects and assigned to teams to develop. The analysts, developers, and testers worked closely together, so each team rapidly completed its task and sent their well-tested code to the quality assurance (QA) department for final verification. At this point the project teams were assigned new features, and they paid no attention to what happened next. But upon probing, we found that one person in the room knew what happened next: The QA department spent two to three months merging the multiple branches and resolving incompatibilities. This waste was more or less invisible, because it occurred after a handoff between geographically separate organizations, and no one seemed to be responsible for the software after it left the site for QA.
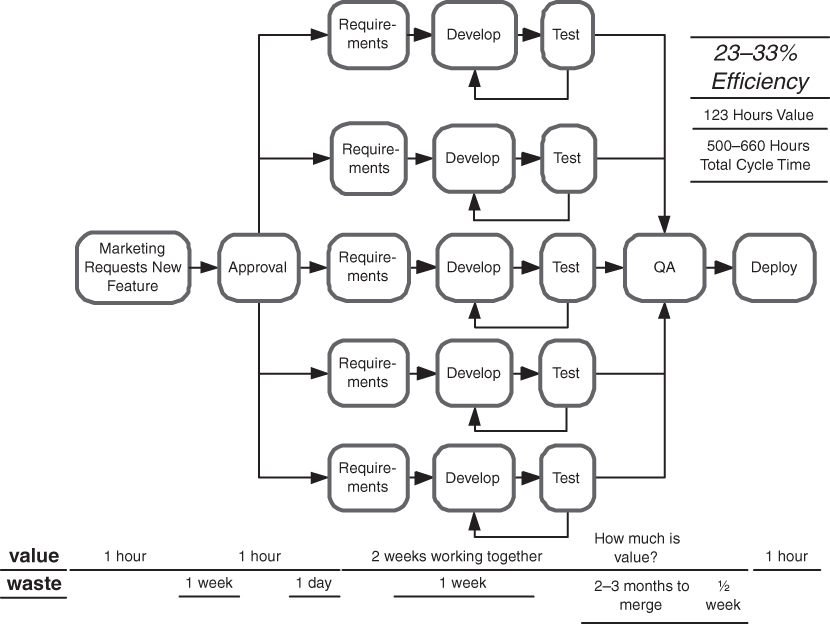
Later in the class we did an exercise where we scored the basic disciplines of the company. (See exercise 4 at the end of Chapter 8.) All four groups in the company rated their configuration management discipline as 2 or lower on a scale of 0–5. We had never seen configuration management ratings so low. It turned out that most of the developers knew the configuration management system was not capable of tracking branches correctly, but the organization was branching more aggressively than any company we’ve seen. As can be expected, merging the branches took far longer than the coding itself.
In this case, the value stream owner was in the room, and when we did a future value stream map, he sketched how things were going to change. Since the branching was causing such problems, it would be abandoned and replaced with continuous integration tools, which already existed. He expected that the two to three months of integration testing could be reduced to a day or two.
Example 4
In almost every class, we see at least one value stream map similar to Example 4 (Figure 4.6). In this map, a request makes its way to a monthly review meeting after two months of analysis and waiting, only to be rejected twice before it finally obtains approval. This is symptomatic of a long queue of waiting work, so we usually ask how long that queue really is. After all, each project in the queue has been estimated, and it’s easy to total up the numbers. We find that initial queues of undone work can be years long. We invariably suggest that most of the work in this queue should be abandoned, and the queue size should be limited to an amount of work that the organization can reasonably expect to do in the near term future. After all, there is usually no danger of running out of work. Maintaining queues of several years of work serves no purpose other than to waste reviewers’ time and build up false expectation on the part of requesters. Investing time estimating projects that will never get done is also a waste.
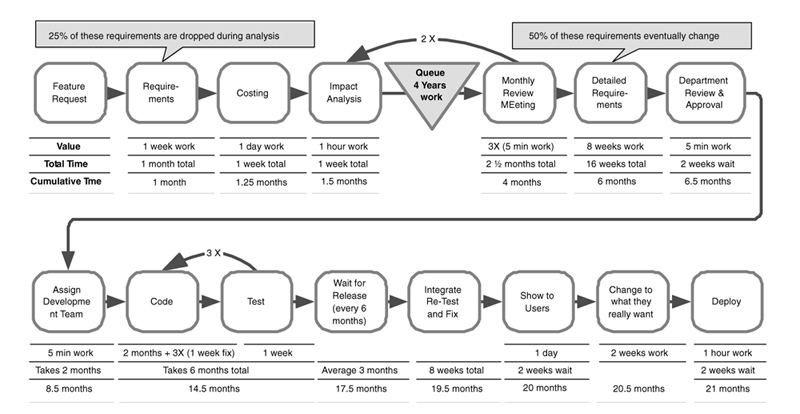
In Example 4, detailed requirements are not done until the project is approved, but once they are completed and approved by the department, there is still a two month wait before a development team is assigned. The team is not dedicated to the project, so it takes six months to complete about two months of coding. In addition, testing does not occur until after coding, so there are three cycles of testing and fixing defects. Once the feature passes its tests, it has to wait for the next release, which occurs every six months, resulting in an average wait of three months. When the tested modules are finally merged, it takes two months to fix all of the defects that occur between feature sets, since there was no continuous integration and ongoing testing as new features were added to the release.
Finally the software is ready to show to the users, a few months short of two years after they requested it. Not surprisingly, many of their requirements have changed. In fact, by the time the software is ready to release, a quarter of the high-level requirements are no longer valid, and half of the detailed requirements have changed. The development and testing teams interrupt current projects to change the code to do what the users really want, which usually takes only a couple of weeks. But when they are done the people in operations are not ready to deploy the software, so it takes about two more weeks before the feature is available in production. Twenty-one months have elapsed since the feature was requested, and we might generously say that four months of that time was spent adding value, giving a 19 percent process cycle efficiency. A less generous view of how much of the time was really spent adding value would yield a far lower process cycle efficiency.
Unfortunately, we see this kind of value stream map all the time. We hear that organizations are overloaded with work, but when we look at the value stream maps we see huge opportunities to increase the output of the organization by eliminating waste. In this example, if we just look at the churn, we see that 50 percent of the detailed requirements are changed. Requirements churn is a symptom of writing requirements too early. Requirements should be done in smaller chunks, much closer to the time they will be converted to code, preferably in the form of executable tests. In this example we also see churn in test and fix cycles, both during initial development and upon integration. This is a symptom of testing too late. Code should be tested immediately and then continuously plugged into a test harness to be sure no defects appear as other parts of the code base are changed.
Finally, we see that the six-month release cycle, which is supposed to consolidate efforts and reduce waste, only serves to introduce more waste. Features have to wait an average of three months after development to be deployed, giving them plenty of time to grow obsolete and get out of sync as new features are added. Meanwhile developers are off on other projects, so when they have to fix these problems, it takes time to get reacquainted with the code. The two week delay before deployment could also be reduced if people from operations were involved earlier in the process.
Diagnosis
Value stream maps are a timeline of the steps from concept to launch or from feature request to deployed code. They should depict average times for the typical steps in a process. Once the map is done, the first things to look for are churn and delays. Churn indicates a timing problem. Requirements churn indicates that requirements are being detailed too soon. Test-and-fix churn indicates that tests are being developed and run too late.
Delays are usually caused by long queues, indicating that too much work has been dumped into the organization. As we will see in Chapter 5, things move through a system much faster when work is limited to the capacity of the organization to complete it. Delays can also indicate an organizational boundary: A delay occurs when work is handed off to an organization that is not ready for it. The best cure for this is to get people from the receiving organization involved well before the handoff occurs.
There are other sources of waste that will be exposed by value stream maps: failure to synchronize, an arduous approval process, lack of involvement of operations and support. But these will show up only if you map the end-to-end process from concept to cash.
Future Value Stream Maps
Every organization we encounter has more work than it can possibly do. However, we generally find that far more work can be done, faster and with higher quality, by simply removing the enormous waste seen in most value stream maps. Toward the end of our classes we ask each group to create a future value stream map, using lean principles to redesign their process. We ask that maps depict a process that is practical for the organization to implement in a three to six month timeframe. No matter where the group started with their current value stream map, the future maps invariably shows improvements in process cycle efficiency and overall cycle time in the range of 50 percent to 500 percent.
Current value stream maps are relatively useless unless they are used to find and eliminate waste. Drawing a future value stream map is a good way to create a plan for removing the biggest wastes. However, we caution that a future map should not be an ideal map. It should show the path for immediate improvement. Pick the biggest delays or the longest queues or the worst churn and address it first. Draw a new map that shows where your organization can reasonably expect to be in three to six months with one to three key changes. Once those changes are made, it’s time to draw a new current value stream map and to help pinpoint the next most important areas to address.
Try This
1. How long would it take your organization to deploy a change that involved just one single line of code? Do you deploy changes at this pace on a repeatable, reliable basis?
2. Complexity Score: Give your organization a complexity score on a scale of 1–5, where 1 = a minimalist approach similar to Inditex, and 5 = an approach which results in maxumim complexity. What one single thing could you do to reduce your complexity score one point? (Note: A more complex approval process is not a good candidate for reducing complexity. Inditex’s approach to governance and approval is as minimalist as the systems themselves.)
3. Seven Wastes: Pick the one waste that is the worst offender in your organization—1) partially done work, 2) extra features, 3) relearning 4) handoffs, 5) task switching, 6) delays, 7) defects. What single thing can you do to significantly reduce that waste?
4. Hold a weekly waste clean-up hour. During the first week, start the hour by talking about one of the seven wastes. Spend the first quarter of the meeting coming to an agreement about what the waste really means in your world. Then spend the next 15 minutes brainstorming to create a list of examples of that particular waste in your development process. Pick the top five candidates and during the next week measure how much waste each one actually causes. At the next weekly meeting, look at your measurements and decide which waste is the “biggest loser” and create a plan to do something about it. Execute the plan and measure the results during the next week. At the next weekly meeting, decide if the results warrant a permanent change, and if so, make the change permanent. At the next weekly meeting, move on to the next waste and repeat the process.
5. Value stream map: If you want to draw a value stream map of your process, try it in steps:
• Gather anyone who is interested and take an hour to draw a map—no more—and a half hour to discuss what you’ve learned.
• Now take a half day to gather some data that was missing during the first exercise and encourage the involvement of a few key people who seemed to be missing. This time, take two hours to draw the map and an hour to discuss its implications.
• Have you learned enough from these two quick experiments to know where your biggest waste is? If so, move on to doing one or two quick future value stream maps, and then start addressing the biggest waste.
Endnotes
1. Michael George and Stephen Wilson, Conquering Complexity in Your Business: How Wal-Mart, Toyota, and Other Top Companies Are Breaking Through the Ceiling on Profits and Growth, McGraw-Hill, 2004.
2. Data from “Inditex: The Future of Fast Fashion,” The Economist, June 18, 2005.
3. Kasra Ferdows, Michael A. Lewis, and Jose A.D. Machuca, “Rapid-Fire Fulfillment,” Harvard Business Review, November 2004.
4. From “Rapid Fire Fulfillment,” Ibid.
5. Andrew McAfee, “Do You Have Too Much IT?” MIT-Sloan Management Review, Spring 2004.
6. From “Do You Have Too Much IT?” Ibid.
7. Ibid.
8. Posted on [email protected] on March 11, 2003, Message 121. Used with permission.
9. Games are a notable exception.
10. See Mark Denne and Jane Cleland-Huang, Software by Numbers: Low-Risk, High-Return Development, Prentice Hall, 2004.
11. Shigeo Shingo, Study of “Toyoda” Production System from an Industrial Engineering Viewpoint, Productivity Press, 1981, Chapter 5.
12. See Fit for Developing Software: Framework for Integrated Tests, by Rick Mugridge and Ward Cunningham, Prentice Hall, 2005. See also www.fitnesse.org. Chapter 7 begins with a case study involving FIT and Fitnesse.
13. We would like to thank to Bent Jensen for mentioning this approach, which he finds very useful.
14. Shingo, Ibid., p. 288.
15. Taiichi Ohno, Toyota Production System: Beyond Large Scale Production, Productivity Press, 1988, p. 6.
16. See Michael George and Stephen Wilson, Conquering Complexity in Your Business: How Wal-Mart, Toyota, and Other Top Companies Are Breaking Through the Ceiling On Profits and Growth, McGraw-Hill, 2004, p. 29.
17. Note that the maps are always hand drawn. We are using a text editor for clarity, but we recommend flip chart paper and pens for value stream maps.