CHAPTER NINE
PROJECT DEFINITION: THE TEN ESSENTIAL STEPS
Processes are the windows into the way the organization operates. If we look there, we will find many hidden opportunities, new passages that promise more powerful performance.
—PRICE PRITCHETT
One of the great strengths of the Rummler-Brache Group’s (RBG’s) methodology is that you can scale it to your needs and it will still yield robust results. From our experience, creating only the minimum Rummler-Brache deliverables will still deliver significant performance improvements in a critical process. For most organizations, this amount represents large financial gains. What are the critical deliverables in a process improvement project? If you were to boil Phases 1 and 2 of the RBG methodology down to their cores, what would be the most important things to know?
Chapters Nine and Ten cover the mission-critical steps and tools in the project definition, analysis, and design phases of the RBG methodology. The tools will help you produce the minimum outputs for a Rummler-Brache “Quick PIP” (Process Improvement Project). This is all practical, real-world stuff. No fluff or academic theory. For each tool, we explain how and when to use it, how long it will take to use it, and the materials required. Plus, we provide an example of an actual deliverable that each tool creates. The bare-bones essentials of Rummler-Brache’s Phase 1 (“DEFINE”) involve ten steps, as shown in Figure 9.1.
FIGURE 9.1. PHASE 1 STEPS

Phase 1: Project Definition
Phase Ø, Performance Improvement Planning, should be completed before Phase 1. Phase Ø is designed to ensure that the process improvement and management effort is driven by strategic and operational priorities.
Step 1: Review the Outputs from Phase Ø—Performance Improvement Planning
The Phase Ø outputs include:
- The Critical Business Issues (CBIs), which are the threats or opportunities that are most pivotal to the success of the strategy. Because it has organizationwide implications, a CBI often is not process-specific. CBIs usually relate to revenue, profit, or market share.
- The Critical Success Factors (CSFs)—those variables essential to world-class performance in the environment (super-system) in which the organization does business—serve as the guide to the identification of the core processes.
- The core (or other) processes that, if improved, will have the greatest impact on the CBIs. A powerful input to this determination is the current cost of each process.
- A Process Improvement Management plan that includes the actions to be taken to address the CBIs through Process Improvement Projects (PIPs).
Step 2: Train Facilitator and Determine the Level of Facilitation Required
We recommend that a Facilitator receive a minimum of two weeks of training in project definition, process analysis and design, and metric chains. Rummler-Brache certifies Facilitators in our methodology if they have attended training and worked side by side with a Rummler-Brache consultant on at least one significant project.
The Facilitator’s role is critical to project success, so making sure this person is properly trained, well experienced, and up to date on the Rummler-Brache methodology is an important step.
During the “DEFINE” Phase (Phase 1), the Facilitator:
- Leads the Project Sponsor, Process Owner, and Executive Team in defining the project scope, goals, boundaries, staffing, and timetable
During the “IS” Phase (Phase 2), the Facilitator:
- Helps keep the Design Team focused by providing structure for its work and documentation
- Prepares a draft map of the “IS” Process based on interviews with those knowledgeable about the process
- Plans and conducts the “IS” Sessions with the Design Team and is responsible for collecting, recording, and summarizing information on process performance
During the “SHOULD” Phase (Phase 2), the Facilitator:
- Continues to provide assistance to the Design Team by helping them prepare for their meeting with the Steering Team
- Prepares draft maps to assist in designing the new process(es)
- Facilitates “SHOULD” sessions
- Updates the map between “SHOULD” sessions and prepares documentation
- Guides the Design Team as it prepares its recommendations and implementation plans for presentation to management
The Facilitator of the project should have strong planning and organizing skills and the skills to influence senior executives. The Facilitator will be the methodology expert on the Design Team.
We recommend all Design Team members attend at least two days of training to learn the basics on how to:
- Define critical business issues
- Scope improvement projects
- Create maps that document the “IS” state
- Identify areas for improvement
- Construct maps to document the “SHOULD” process
Training in the Rummler-Brache methodology gives Design Team members a greater appreciation for the critical, central role that processes play in the execution of the organization’s strategy.
The level of facilitation support that Design Teams receive during a project can vary according to your answers to the questions shown in Figure 9.2.
FIGURE 9.2. DETERMINANTS OF FULL, PARTIAL, OR NO FACILITATION

Full Facilitation
Full facilitation means that a trained Rummler-Brache Facilitator assumes an active role in all phases of the project, attends all team meetings, and generally takes the lead in interviewing, Process Map development, and team meetings.
Full facilitation is recommended for:
- Projects aimed at resolving high-profile business issues
- Projects involving complex, cross-functional processes
- Projects initiated by organizations new to the Rummler-Brache Process Improvement methodology
Following are success factors associated with full facilitation:
- A certified Rummler-Brache Facilitator (Rummler-Brache suggests that at least two Facilitators work together on large-scale projects involving full facilitation)
- Clear understanding of, and agreement on, the roles and responsibilities of the Facilitator, the Sponsor, Steering Team members, and Design Team members
- Written documentation at all phases of the project
- Formal progress reviews with senior management at major milestones in a project
Rummler-Brache’s methodology software is designed to support full facilitation of a Process Improvement Project.
Partial Facilitation
In partial facilitation, the Rummler-Brache Facilitator supports the Steering Team and the Design Team at key points in the project, but may not be present at all meetings and may not necessarily lead or participate in all phases of the project.
The Design Team typically does much or all of the process mapping and conducts its own meetings.
Partial facilitation can be appropriate when:
- The business issue associated with the project is relatively low-profile
- The business is not overly complex (for example, it is contained within a small number of functions)
- The organization and the Design Team members have had experience with Rummler-Brache Process Improvement methodology
Such support could include:
- Helping the Sponsor define the project
- Conducting or supporting team training
- Participating in the Project Startup Meeting
- Responding to requests for assistance from Design Team members as they develop the “IS” map
- Attending the “IS” session
- Reviewing the results of the “IS” session prior to presentation of results to the Steering Team
- Assisting the Sponsor and Design Team Leader in developing a “SHOULD” design strategy
- Attending all or selected parts of the “SHOULD” sessions
- Reviewing the results of the “SHOULD” sessions prior to their being presented to the Steering Team
- Assisting in development of an implementation and high-level implementation plan
Some success factors associated with partial facilitation are:
- An experienced Sponsor and/or Design Team Leader
- Experienced Design Team members
- Thorough project definition
- Specification of critical points for facilitation support
- Clear expectations about the level of facilitation support
- Dependable access to a certified Rummler-Brache Facilitator
No Facilitation
No facilitation means that the Design Team conducts its project without a Rummler-Brache Facilitator. This approach may be feasible when:
- The project is associated with a low-visibility issue
- The process to be improved is relatively simple (for example, it is contained within one function)
- The organization (including the Design Team) has been trained and has considerable experience in the Rummler-Brache Process Improvement methodology
Success factors associated with no facilitation:
- A highly experienced Sponsor and/or Design Team Leader
- Experienced and trained Design Team members
- A Sponsor or Team Leader willing and able to perform facilitation tasks, as necessary, during the course of the project
- A reliable source of Rummler-Brache facilitation help, if needed
Step 3: Profile Critical Processes
Tool: Critical Process Profile
The Critical Process Profile helps you understand each key process at a high level. It provides information about:
- Where the process starts (trigger) and ends (outputs)
- What other processes provide input or receive output from the process
- The supplier and customer of the process
- Major portions of work or subprocesses included in the process
When to Use
The questions you use to profile a critical process are typically asked early in your data-gathering interviews. Usually you will gather this information from individuals identified by the Executive Team rather than from Executive Team members themselves, because senior managers generally cannot provide the level of detail you need to profile a critical process.
How to Use
Answer the questions in the Critical Process Profile that follows to ensure you understand the process to be improved and its boundaries. The Critical Process Profiles will also be used to develop a series of linked measures for the critical processes.
Time Required
Expect to spend at least fifteen to thirty minutes profiling each process. The actual amount of time will depend on the complexity of the process and how much thinking the organization has given to the process in the past.
Materials Required
- Critical Process Profile (see the following example)
TABLE 9.1. SIGNIFICANCE OF RELATED PROCESSES
| Other Processes | Significance |
| Sales process | No significance—will assume proper sale has been made |
| Sales forecasting process | Affects inventory levels in customer order process—may require a separate Process Improvement Project |
| Procurement process | No significance |
| New product development process | No significance |
FIGURE 9.3. SAMPLE PROCESS

Step 4: Identify Critical Process Issues
Tool: Critical Process Issues
Critical Process Issues (CPIs) are the link between the target process and the Critical Business Issue (CBI).
CPIs:
- Describe the specific aspect(s) of process performance that must be addressed in a Process Improvement Project (PIP)
- Serve as a focus for a PIP and are a major factor in determining Project Goals
- Can guide the Design Team in deciding how to improve the process and in developing appropriate measures for managing the improved process
- Answer the question, “What is it about the process that must be improved to have a positive effect on the Critical Business Issue?”
When to Use
You will identify the CPIs after the CBI has been identified. The CPIs need to link the target processes to the CBI.
How to Use
Time Required
Information gathered in your interviews with the Steering Team and others will inform you of the CPIs.
Materials Required
- CBI
- Interview notes
- Frequently we are unable to deliver orders on the dates promised to the customer.
- It takes us three years to get a new product to market—twice as long as our major competitor.
- Approximately 20 percent of the orders submitted by the sales reps are inaccurate or incomplete. This results in added cost and time to fill those orders.
- We perform poorly in delivering specials to customers:
- Order fulfillment:
- Financial reporting and budgeting through expenditure to payment and corporate reporting:
- Preventive maintenance:
- Renewal:
Step 5: Establish Project Goals
Tool: Project Goals
Process Improvement Project Goals are based on how the organization wants the process to perform. You must know how the process is currently performing so you can determine the gap between current and desired performance. This will also help you conduct a cost-benefit analysis.
When to Use
Identify Project Goals prior to launching a Process Improvement Project and after the Critical Process Issues (CPIs) have been identified.
How to Use
- Specific
- Measurable
- Ambitious, but achievable
- Understandable
- Ideally, performance data are collected by your organization on an ongoing basis. “Cost per unit” or “average days from order received to order shipped” are both examples. These data help provide the baseline needed to demonstrate the success of the project.
- If ongoing data are not available, conduct a brief study of historical performance data. For example, a review of project files for the past three years may enable you to determine an average cycle time to get new products to market.
- If no data exist, determine how to gather data starting now, so that you have several months of baseline data by the time implementation begins. If you are unable to determine how to gather the data, you may need to change the Project Goal.
- Create a customer-focused culture.
- Standardize the look and feel of process documentation.
- Create a common language within the organization for the target process.
- Increase empowerment of frontline employees.
TABLE 9.2. PROJECT GOALS EXAMPLE 1

TABLE 9.3. PROJECT GOALS EXAMPLE 2

Time Required
The time required to establish Project Goals depends on the type of current performance data you must gather. If current data exist, it is a matter of quickly establishing and validating goals with the Executive Team. If current data do not exist, considerable time could be required to determine:
- What measures to track
- The tracking frequency
- Where to place the “meters” so data are collected and formatted
Materials Required
- Critical Business Issue
- Critical Process Issues
- Baseline performance data, if available
Step 6: Identify Process Dependencies
Tools: Process Inventory
A Process Inventory is a list of the major processes in the organization. It is a useful input to profiling processes and developing a Process Relationship Map (PRM).
When to Use
Use the Process Inventory when summarizing your “DEFINE” interview notes and prior to developing a PRM.
How to Use
Using the Process Inventory Template
TABLE 9.4. EXAMPLE OF A PARTIAL PROCESS INVENTORY

Example: Process Inventory
Tool: Process Relationship Map
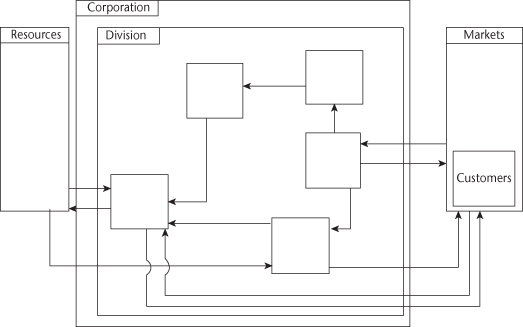
The Process Relationship Map (PRM) is a picture of the input-output relationships between the major work processes in an organization (see Figure 9.4). It will help you understand and display the network of processes required to run the business. It will also identify how other processes affect or are affected by a specific process selected for improvement.
FIGURE 9.4. COMPONENTS OF A STANDARD PRM

When to Use
Use the PRM:
- Any time the business’s operating context needs to be understood
- During any analytical, definition, or design work where it is important to understand the big picture
- During any project where it is important to understand how processes affect each other
How to Use
First, develop a Process Inventory using the Process Inventory Tool. Then follow these steps to build a PRM:
- The customer band represents the processes that occur in the client’s customers’ organizations that interface with the client’s processes.
- The management band represents the processes that provide direction and guidance to the organization, such as strategic planning process, budgeting process, and business planning process.
- The primary band represents the processes that produce the product or service that the client organization produces. The value chain is another name for these key or core processes, such as selling process, order fulfillment process, customer support process.
- The support band represents the processes that enable the other processes to work effectively, such as staffing process, IS or IT process, accounts payable process, capital appropriation process.
- The supplier band represents the processes that occur in the client’s suppliers’ organizations that interface with the client’s processes.
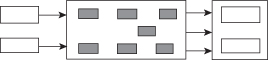
FIGURE 9.5. SAMPLE CHART

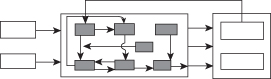
FIGURE 9.6. SAMPLE CHART WITH PROCESS BOX

FIGURE 9.7. SAMPLE CHART WITH “UPSTREAM” AND “DOWNSTREAM” PROCESSES
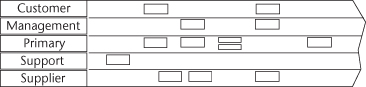
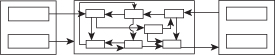
FIGURE 9.8. SAMPLE CHART WITH INPUT AND OUTPUT ARROWS

Time Required
The information you need to build a PRM is the process profile data gathered in your interviews with either the Executive Team or other designated specialists. Once that information is collected, it may take you several hours to build the map, depending on its complexity.
Materials Required
You will need the following materials to construct your PRM:
- Process Profile information
- Process Inventory
Tips
Give each process box a title that indicates the name of the process and not the name of the department with most responsibility for the process. It is easy to misinterpret the map if the boxes “sound” like departments. For example, it is better to call a process “Product Design” than “Engineering” or “New Product Development” instead of “R&D.” If necessary, add the word “Process” to each title to ensure the user reads the map as processes, and not as departments. See the example maps in Figures 9.9 and 9.10.
FIGURE 9.9. PRM EXAMPLE 1
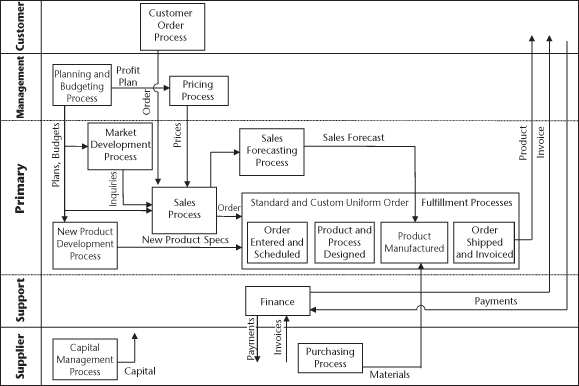
FIGURE 9.10. PRM EXAMPLE 2
Step 7: Identify Functional Dependencies
Tool: Function Relationship Map
The Function Relationship Map (FRM) depicts the functions (departments) in the organization and their input-output relationships. The purpose of this map is to help analyze, improve, and design the organization’s functional relationships. The map can be developed so that it depicts the general relationships of all functions or specific relationships that exist within a process.
General FRM (see Figure 9.11 for a sample General FRM):
- The general FRM is a picture of the organization that helps relationship managers and consultants understand how the business operates.
- The general FRM is often depicted as the center of the Supersystem Map. It shows the inputs and outputs of the organization to the rest of the system. The arrows between the functions identify the outputs of the functions and which functions receive the outputs. It is possible to “trace” the high-level path of the organization’s value chain using the general FRM.
FIGURE 9.11. SAMPLE GENERAL FRM TEMPLATE

Specific FRM (see Figure 9.12 for a sample Specific FRM):
- The specific FRM is a tool analysts use to see more detail about how the business or part of the business operates.
- Specific FRMs are usually built to depict the functions (departments) that are involved in a specific process or system of processes.
FIGURE 9.12. SAMPLE SPECIFIC FRM TEMPLATE
As a Process Improvement Project progresses, the FRM can become a critical map. It can be used for organization or process redesign and for testing the impact of various changes.
When to Use
Use the FRM when:
- The business’s value chain needs to be understood
- Functions involved in one or more processes need to be identified
- Functional relationships need to be understood
How to Use
Follow these steps to create a general FRM:
Follow these steps to create a specific FRM:

OR


Time Required
After interview information is collected, it may take you several hours to build the map.
Materials Required
You will need the following materials to construct your FRM:
- Information gathered from your “DEFINE” interviews
- Organization chart(s)
- 11" × 17" grid paper and flip chart paper
- Sticky notes and pens
- Business-diagramming software
FIGURE 9.13. FRM EXAMPLE 1

FIGURE 9.14. FRM EXAMPLE 2 (GENERAL FRM)

FIGURE 9.15. FRM EXAMPLE 3 (SPECIFIC FRM)

Step 8: Identify Constraints and Assumptions
These include the limitations placed on resources available for the project and organizational boundaries within which the project is confined.
Some examples of project constraints are:
- Capital availability is very limited. Recommendations should be for solutions requiring limited capital. Any recommendations for capital should have a detailed cost-benefit analysis including alternatives considered.
- The organization has recently undergone massive restructuring. Proposed process improvements must not involve changes to organization structure.
- We never outsource work.
- The recommendations must be linked with other key efforts underway, such as the implementation of the new ERP system such as SAP.
- You cannot change anyone’s compensation.
Some examples of project assumptions are:
- The CEO never supports projects that involve investments in new technology.
- Process changes cause a significant dip in productivity.
- Frontline staff cannot participate on project teams because we can’t afford for them to be taken away from their jobs for any period of time.
Constraints and assumptions typically fall into one or more of these categories:
- Availability of the appropriate people to:
- Money for:
- Time by which the team must:
- Access to:
- Authority of:
- Extent of the changes that can be made to:
- Upcoming internal or external changes that may affect the process
- Communications requirements involving:
Consider a company president who, when he formed a Design Team, personally gave team members authority to make all changes needed to improve process performance, with three constraints:
Because the constraints involved considerable empowerment, they had no negative effects on the team’s ability to achieve project goals (which were ambitious).
On the other hand, it is important to remember that there are times when constraints can and should be challenged. For example, consider a Design Team that challenges its constraints by: (1) redesigning the process within its specified constraints and recommending changes that would result in meeting project goals, and (2) presenting a second set of recommendations that ignored several of the constraints—but that would result in markedly greater savings. Many of the second set of recommendations would likely be accepted and implemented by management.
Step 9: Define Project Roles
Tool: Summary of Project Team Roles
This tool describes the teams and individuals involved in a typical Process Improvement Project (PIP).
Design Team
The Design Team is composed of eight to fifteen members who:
- Represent the functions involved in the process being analyzed and improved.
- Represent all geographic areas affected (if the process crosses regional or national boundaries).
- Are stakeholders in the process (selected if necessary to assure their commitment to implementation).
- Are not assigned just because they have the least amount of work to do at a particular time or are otherwise “available.”
The Design Team may include individual contributors and supervisors if:
- There are no direct reports included on the team.
- The supervisor(s) are intimately familiar with the day-to-day workings of the “IS” Process.
The Design Team begins its work in the “IS” Phase by adhering to the interview schedule and handling “front-end” interview logistics. During the “IS” Sessions, the Design Team confirms and identifies relationships, inputs, outputs, problems or issues, and baseline measures. It also develops “SHOULD” design specifications and “COULD BE” alternatives. After the “IS” Sessions, the Design Team identifies linkages to other processes and reviews all “IS” documentation.
Continuing its work in the “SHOULD” Phase, the Design Team designs the new process, summarizes the recommended changes, and checks to be sure the new process addresses all the disconnects identified during “IS” Analysis. The team then develops its recommendations (including a strategy for implementing them) and presents them to management.
At the conclusion of “SHOULD” Design, Design Team members are recognized for their performance and are recommissioned to Implementation Teams, as appropriate. It is common to recommission Design Team members as Implementation Team Leaders.
The Design Team can profit from having one or more “catalysts” among its membership. These are people who can energize and challenge the whole team.
Design Team membership can be expected to change somewhat as the project progresses. People quit, get transferred, and so forth. It is also not unusual to add (temporarily) resource people during the “SHOULD” Phase or technical experts during the “IS” Phase.
Design Team Leader
The Design Team Leader takes the lead role, working closely with the Facilitator in all Design Team sessions. He or she leads the Design Team in doing the work.
Executive Team
If there is an Executive Team, its role during the “DEFINE” Phase is to be a primary resource for data gathering to define the project. They also raise any questions or concerns and select membership for the Steering Team. This team continues to review and monitor progress throughout the PIP and clarify objectives, when needed.
Facilitation Support Team
On large projects, the task of coordinating meetings, collecting information, creating maps, and facilitating sessions can become too much for one person. To avoid burnout, it is a good idea to augment the primary Facilitator with additional support. Usually this can be accomplished by defining project support requirements. In some cases, however, it may be necessary to have another Facilitator.
Facilitator
See Step 2 of Phase 1 for a description of the Facilitator’s role.
Implementation Team
After the new process has been designed, the Implementation Teams are organized around work to be done to implement the new process and are cross-functional in structure. For example, the recommendation to update or install a new information system that will support process automation will be implemented by experts from the systems department and others whose jobs or expertise are integral to the task. The recommendation to revise a policy would include those people whose expertise or specific job would help in developing the new policy.
Implementation Team Leader
After the new process has been designed, the Implementation Team Leader manages the activities of her or his Implementation Team as they implement the new process. She or he is responsible for communicating the status of the team’s progress to the Project Manager on a regular basis.
Project Manager
During Implementation, the Project Manager coordinates the efforts of all the Implementation Teams to make sure the Implementation Plan is executed on time and within budget. He or she conducts regular status meetings with management to inform them of progress and escalate issues, as applicable. He or she typically reports to the Process Owner.
Project Sponsor
The Project Sponsor is the champion for the project—he or she is generally the person who initiated the PIP. The Facilitator is accountable to the Project Sponsor (and the Process Owner) for results. This person may be the same person as the Process Owner.
Process Owner
The Process Owner is the person who is on the line for the success of the process—this role may be equated to a Process Manager. The Process Owner’s primary activities include:
- Establishing and clarifying the project scope
- Acquiring project resources
- Providing access to interviewees, as needed, to ensure their attendance at the interviews
- Providing access to key decision makers in the organization and ensuring their commitment
- Helping to plan Steering Team review meetings and attending those meetings personally, as much as possible
- Briefing the Steering Team and Executive Team and other key stakeholders on progress, issues, and recommendations
The Process Owner must be on the Steering Team. If the organization is in flux, there may be no logical Process Owner at the beginning of the project; however, in this situation, an interim or temporary Process Owner must be appointed. If the process is being fundamentally redefined, the logical owner of the process may change as the boundaries of the cross-functional process change. He or she may be the same person as the Project Sponsor; however, his or her key responsibility is process ownership.
Receiving Organization
The Receiving Organization(s) install the new process in their organizations with assistance from the Implementation Teams. These groups then take on responsibility for monitoring daily process performance to achieve performance targets.
Stakeholders
Stakeholders are persons or organizations that potentially will be affected by the changes. Determining who these people are, how the changes will affect them, and gaining their support is very important to the eventual installation of the new design. This group generally plays an advisory role, as opposed to a decision-making role throughout the PIP. Stakeholders are advised of progress throughout the project by the Process Owner.
Steering Team
The Steering Team is formed toward the end of the “DEFINE” Phase once the project is clearly scoped. This team reviews and monitors progress throughout the PIP and plays the role of decision-maker. Its members may also raise issues and resolve them.
Step 10: Develop Project Plan
Tool: Project Plan
The Project Plan lists the major activities and deliverables associated with a Process Improvement Project (PIP).
While there are many ways to represent a Project Plan (such as Gantt charts and PERT charts), this should be a high-level plan and kept as simple as possible.
When to Use
You should develop a Project Plan after the PIP has been fully defined and validated. (See Table 9.5 for an example.)
TABLE 9.5. EXAMPLE: PROJECT PLAN
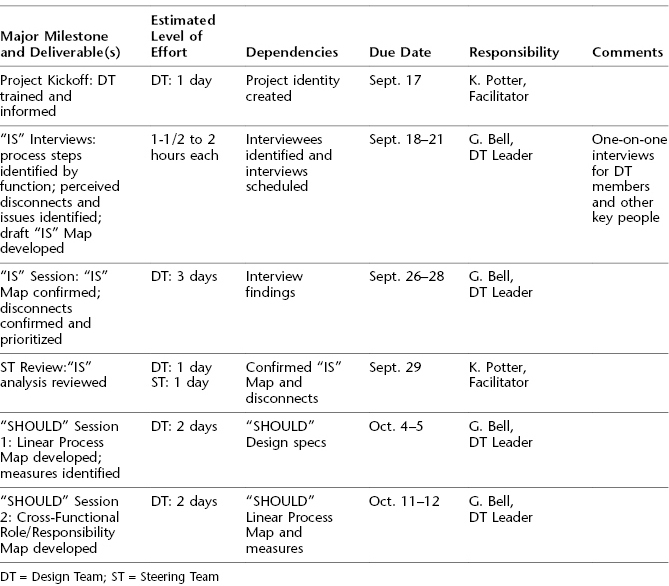
How to Use
Review the steps involved in a PIP to determine:
- The major milestones applicable to the PIP
- The estimated level of effort required to accomplish each milestone
- The dependencies between milestones
- The due date for each milestone
- The person responsible for each milestone
Time Required
The time required to complete a high-level Project Plan will depend on the complexity of the project and whether you will be including communications and change management–related milestones. Although this plan will be your road map going forward, it will be a working document. Therefore, do not spend too much time thinking about any one milestone. Make your best estimate and move on.
Materials Required
- Project planning software
- Generic milestones for a Project Plan
Tips
- Although dependencies and level of effort may be helpful in determining due dates or sequence, it is not always necessary to document them in the Project Plan.
- Add a “Notes” column to your Project Plan to capture any important information that does not fit into the other sections of the plan.