
Afterword: Endcaps and the “Promotional” Store
After completing the second edition, I am uneasy about “the elephant in the room,” so-to-speak. But let me give you a few thoughts before I clarify that—and then some more interesting/validating data!
The “science of shopping” rightly has as its focus first on the shopper and then on the products. But there are actually at least five entities directly connected to that two-point nexus of shoppers and products. More or less in their order of priority from the shopper’s point of view, they are:
![]() The shoppers themselves.
The shoppers themselves.
![]() The products those shopper seek, plus the host of “also ran” products that are relatively rarely purchased.
The products those shopper seek, plus the host of “also ran” products that are relatively rarely purchased.
![]() The store itself—the building, displays, fixtures, and various supplements (restrooms and so on).
The store itself—the building, displays, fixtures, and various supplements (restrooms and so on).
![]() The retailer, in the sense of the staff, management, and the whole corporate image.
The retailer, in the sense of the staff, management, and the whole corporate image.
![]() The suppliers of goods (manufacturers, particularly branded), and sometimes services.
The suppliers of goods (manufacturers, particularly branded), and sometimes services.
Interestingly, the suppliers have invested billions in studying the shoppers—#5 studying #1—but a large share of that research was basically trying to understand people and, secondarily, their reaction to the products—#2—with an increasing focus on that interaction inside real stores—#3. (That real interaction in real stores was a large part of the impetus for the growth of Sorensen Associates in the 90s, a lot of preparation for which occurred in the 80s.)
The retailers’—#4—major role has been the management of the physical store—#3—including staff and inventory—#2—and the all-important business relationship with suppliers—#5.
The “elephant in the room,” so to speak, about these five prime components of retail is that they all are subject to changes that can range from hourly/daily/weekly to more glacial changes that occur over quarters/years/decades. The most active changes occur amongst the shoppers and the store merchandising. Just as an example, the Ehrenberg-Bass Institute has been prominent in discovering the inconstancy of shoppers—loyalty is a myth—and the necessity of steady recruitment of new shoppers for a store, just to stand still with respect to growth.
But the inconstancy we want to draw attention to here is about the perimeter of the store where most of the endcaps are, as well as a lot of “drop shippers,” temporary displays prestocked with merchandise and shipped to the store, ready to be “dropped” anywhere on the floor there is space and availability to shoppers.
Now, endcaps are one of the most constant displays of promotional merchandise, usually—but not always—with prices reduced. A few of these, like the “battery endcap,” are relatively constant even from year to year, but most of them change on a regular schedule of weekly, biweekly, and so on. And, appropriately, as valuable instore “media,” that is, with exposure to shoppers, they are competitively priced for the suppliers—#5—to fund the retailer—#4.
From a research point of view, this regular churn of endcaps and a good deal of the store perimeter, is a serious impediment to the type of detailed xyz-t (location and time), both of products—#2—and people—#1—that has driven our scientific research of shopping. At present, it is very difficult to be as detailed and scientific about endcaps and promotional displays as we are about aisles. In aisles, both shoppers and products are regimented into orderly rows (aisles) and columns (shelves) which move—both in terms of sales and physical organization—at a glacial pace compared to the “promotional store.” That is, a very large share of total store sales come from the dynamic “promotional store,” not from the relatively static center-of-store aisles.
At a time when industry-standard thinking was that maybe 10% of total sales come from endcaps, by eye-tracking shoppers through one supermarket we found that 50% of all Coca-Cola product sales came from promotional locations, mostly endcaps, and not from the aisles. In the much larger RFID-PathTracker study across nine nationally distributed, diverse supermarkets, we learned that across all the products in the store, 43% of the products are purchased from the perimeter/promotional part of the store, which probably has something like 20% of the individual item SKUs on display. What this means is that any given item displayed in the highly fluid area of the store is about twice as likely to be purchased as one displayed in the center-of-store aisles.
But here’s the problem: Our measurements are likely far more accurate for the center of the store than for the highly fluid endcap/promotional area. Thus, we understand more accurately the least important part of the store. This means our carefully measured category management and planogram design approaches some measure of scientific validity, but the management of the far more important promotional side of the store is still mostly a matter of art and horse-trading.
We often cite what we refer to as the hierarchy of truth in shopping research, in which exactly what shoppers buy in the store—as evidenced by the transaction logs—is at the pinnacle of the truth pyramid. This is not because the Tlog is a perfect report of sales in the store. And again, center-of-store aisles are the most reliable. But for those items, when they are sold in secondary locations, like endcaps, there is no simple way to determine which of multiple locations they might have come from. Our RFID PathTracker methods were very good for this, based on linking measured paths, foot by foot, to the scan-audit of the exact xyz location of every item in the store, and linking these to the shoppers’ purchases at the checkout. However, these very costly methods are not practical for widespread, everyday use.
But there are many items in the store, particularly in the promotional part of the store, that don’t even have a UPC look-up code for scanning, but may have a PLU, “price-look-up” code, particularly if it is an item sold by weight. This is just the tip of the iceberg, at the pinnacle of truth in the store. That is, the highest selling items often are least well identified in the transaction logs, because they are not standard, branded/coded merchandise. And they are also most fluid in moving around the store, whether on endcaps or other “promotional” locations. Another way to look at this is that the most important information about shopper behavior in the store (products and shoppers) is most difficult to obtain, reliably.
It’s very easy to have a simplistic view of shopping. Some researchers either don’t recognize the environment they are working in or simply sweep the complications under the rug. Okay, at times even I have been guilty on both counts. But I applaud the serious efforts my colleagues at Ehrenberg-Bass are making to identify exactly how much of each item is being sold off of each endcap, daily. At Accelerated Merchandising, we are making a special focus on the accurate measurement of the amount of time shoppers spend, in aggregate, before each and every display in stores. We’re working through the details of that problem in some small stores, where the problems are as small as the stores. Figure A.1 shows a graphic from an endcap display study at a full-size supermarket.
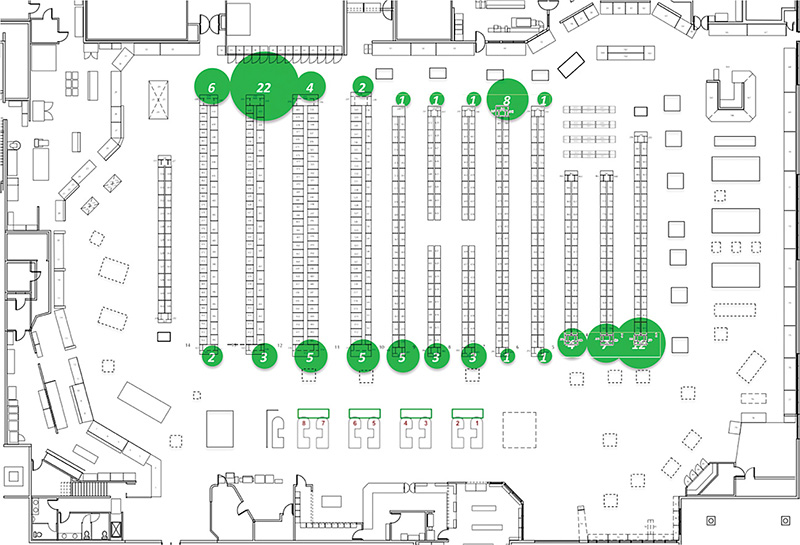
Our goal has been to produce an accurate measure of exposures at endcaps. You can see that two or three endcaps get the lion’s share of shopper exposures in this store. This should parallel the measurement of purchases at endcaps—see the sidebar “Endcaps Audit: Do Retailers Reduce Visual and Choice Complexity?”
Endnotes
1. Source: Caruso, W., Bogomolova, S., Corsi, A., Cohen, J., Sharp, A. and Lockshin, L. 2015 Exploring the effectiveness of endcap locations in a supermarket: early evidence from in-store video observations, ANZMAC, Sydney.