
2 First steps with Istio
- Installing Istio on Kubernetes
- Understanding the Istio control-plane components
- Deploying an application with the Istio proxy
- Controlling traffic with the Istio
VirtualServiceresource - Exploring complementary components for tracing, metrics, and visualization
Istio solves some of the difficult challenges of service communication in cloud environments and provides a lot of capabilities to both developers and operators. We’ll cover these capabilities and how it all works in subsequent chapters; but to help you get a feel for some of the features of Istio, in this chapter we do a basic installation (more advanced installation options can be found in appendix A) and deploy a few services. The services and examples come from the book’s source code, which you can find at https://github.com/istioinaction/book-source-code. From there, we explore the components that make up Istio and what functionality we can provide to our example services. Finally, we look at how to do basic traffic routing, metrics collection, and resilience. Further chapters will dive deeper into the functionality.
2.1 Deploying Istio on Kubernetes
We’re going to deploy Istio and our example applications using containers, and we’ll use the Kubernetes container platform to do that. Kubernetes is a very powerful container platform capable of scheduling and orchestrating containers over a fleet of host machines known as Kubernetes nodes. These nodes are host machines capable of running containers, but Kubernetes handles those mechanisms. As we’ll see, Kubernetes is a great place to initially kick the tires with Istio—although we should be clear that Istio is intended to support multiple types of workloads, including those running on virtual machines (VMs).
2.1.1 Using Docker Desktop for the examples
To get started, we need access to a Kubernetes distribution. For this book, we use Docker Desktop (www.docker.com/products/docker-desktop), which provides a slim VM on your host computer that’s capable of running Docker and Kubernetes.
Docker Desktop also has nice integration between the host machine and the VM. You’re not constrained to using Docker Desktop to run these examples and follow along in this book: these examples should run well on any variant of Kubernetes, including Google Kubernetes Engine (GKE), OpenShift, or your own self-bootstrapped Kubernetes distribution. To set up Kubernetes, see the Docker Desktop documentation (www.docker.com/products/docker-desktop) for your machine. After successfully setting up Docker Desktop and enabling Kubernetes, you should be able to connect to your Kubernetes clusters as shown next:
$  kubectl get nodes
NAME             STATUS   ROLES    AGE   VERSION
docker-desktop   Ready    master   15h   v1.21.1
NOTE Istio 1.13.0, used in this book, requires a minimum of Kubernetes version 1.19.x.
2.1.2 Getting the Istio distribution
Next, we want to install Istio into our Kubernetes distribution. We use the istioctl command-line tool to install Istio. To do that, download the Istio 1.13.0 distribution from the Istio release page at https://github.com/istio/istio/releases and download the distribution for your operating system. You can choose Windows, macOS/Darwin, or Linux. Alternatively, you can run this handy script:
After downloading the distribution for your operating system, extract the compressed file to a directory. If you use the downloadIstio script, the archive is extracted automatically. From there, you can explore the contents of the distribution, including examples, installation resources, and a binary command-line interface for your OS. This example explores the Istio distribution for macOS:
$  cd istio-1.13.0
$  ls -l
total 48
-rw-r--r--   1 ceposta  staff  11348 Mar 19 15:33 LICENSE
-rw-r--r--   1 ceposta  staff   5866 Mar 19 15:33 README.md
drwxr-x---   3 ceposta  staff     96 Mar 19 15:33 bin
-rw-r-----   1 ceposta  staff    853 Mar 19 15:33 manifest.yaml
drwxr-xr-x   5 ceposta  staff    160 Mar 19 15:33 manifests
drwxr-xr-x  20 ceposta  staff    640 Mar 19 15:33 samples
drwxr-x---   6 ceposta  staff    192 Mar 19 15:33 tools
Browse the distribution directories to get an idea of what comes with Istio. For example, in the samples directory, you’ll see a handful of tutorials and applications to help you get your feet wet with Istio. Going through each of these will give you a good initial idea of what Istio can do and how to interact with its components. We take a deeper look in the next section. The tools directory contains a few tools for troubleshooting Istio deployments, as well as bash-completion for istioctl. And the manifests directory contains Helm charts and istioctl profiles for customizing the installation of Istio for your specific platform. You likely won’t need to use these directly (as we’ll see), but they’re there for customization purposes.
Of particular interest is the bin directory, where you’ll find a simple command-line interface (CLI) istioctl tool for interacting with Istio. This binary is similar to kubectl for interacting with the Kubernetes API, but it includes a handful of commands to enhance the user experience of using Istio. Run the istioctl binary to verify that everything works as expected:
$  ./bin/istioctl version
no running Istio pods in "istio-system"
1.13.0
At this point, you can add the istioctl CLI to your path, so it’s available wherever you navigate on the command line. This is platform specific and up to you to figure out.
Finally, let’s verify that any prerequisites have been met in our Kubernetes cluster (such as the version) and identify any issues we may have before we begin the installation. We can run the following command to do that:
$  istioctl x precheck

✔ No issues found when checking the cluster.
➥Istio is safe to install or upgrade!
  To get started, check out
  ➥https://istio.io/latest/docs/setup/getting-started/
At this point, we’ve downloaded the distribution files and verified that the istioctl CLI tools are a fit for our operating system and Kubernetes cluster. Next, let’s do a basic installation of Istio to get hands-on with its concepts.
2.1.3 Installing the Istio components into Kubernetes
In the distribution you just downloaded and unpacked, the manifests directory contains a collection of charts and resource files for installing Istio into the platform of your choice. The official method for any real installation of Istio is to use istioctl, istio-operator, or Helm. Appendix A guides you through installing and customizing Istio using istioctl and istio-operator.
For this book, we use istioctl and various pre-curated profiles to take a step-by-step, incremental approach to adopting Istio. To perform the demo install, use the istioctl CLI tool as shown next:
$  istioctl install --set profile=demo -y

✔ Istio core installed
✔ Istiod installed
✔ Ingress gateways installed
✔ Egress gateways installed
✔ Installation complete
After running this command, you may have to wait a few moments for the Docker images to properly download and the deployments to succeed. Once things have settled in, you can run the kubectl command to list all of the Pods in the istio-system namespace. You may also see a notification that your cluster doesn’t support third-party JSON Web Token (JWT) authentication. This is fine for local development, but not for production. If the error appears during the installation in a production cluster, follow the Istio documentation on how to configure third-party service account tokens (http://mng.bz/Vl7G), which is the default with most cloud providers and shouldn’t be necessary.
The istio-system namespace is special in that the control plane is deployed into it and can act as a cluster-wide control plane for Istio. Let’s see what components are installed into the istio-system namespace:
$  kubectl get pod -n istio-system
NAME                                   READY  STATUS    RESTARTS   AGE
istio-egressgateway-55d547456b-q2ldq   1/1    Running   0          92s
istio-ingressgateway-7654895f97-2pb62  1/1    Running   0          93s
istiod-5b9d44c58b-vvrpb                1/1    Running   0          99s
What exactly did we install? In chapter 1, we introduced the concept of a service mesh and said that Istio is an open source implementation of a service mesh. We also said that a service mesh comprises data-plane (that is, service proxies) and control-plane components. After installing Istio into a cluster, you should see the control plane and the ingress and egress gateways. As soon as we install applications and inject the service proxies into them, we will have a data plane as well.
The astute reader may notice that for each component of the Istio control plane, there is only a single replica or instance. You may also be thinking, “This appears to be a single point of failure. What happens if these components fail or go down?” That’s a great question and one we’ll cover throughout the book. For now, know that the Istio control plane is intended to be deployed in a highly available architecture (with multiple replicas of each component). In the event of failures of the control-plane components or even the entire control plane, the data plane is resilient enough to continue for periods of disconnection from the control plane. Istio is implemented to be highly resilient to the myriad of failures that can occur in a distributed system.
The last thing we want to do is verify the installation. We can run the verify-install command post-install to verify that it has completed successfully:
This command compares the install manifest with what is actually installed and alerts us to any deviations. We should see a listing of the output ending with
Finally, we need to install the control-plane supporting components. These components are not strictly required but should be installed for any real deployment of Istio. The versions of the supporting components we install here are recommended for demo purposes only, not production usage. From the root of the Istio distribution you downloaded, run the following to install the example supporting components:
Now, if we check the istio-system namespace, we see the supporting components installed:
$  kubectl get pod -n istio-system

NAME                                  READY  STATUS
grafana-784c89f4cf-8w8f4              1/1    Running      ❶
istio-egressgateway-96cf6b468-9n65h   1/1    Running
istio-ingressgateway-57b94d999-48vmn  1/1    Running
istiod-58c5fdd87b-lr4jf               1/1    Running
jaeger-7f78b6fb65-rvfr7               1/1    Running      ❷
kiali-dc84967d9-vb9b4                 1/1    Running      ❸
prometheus-7bfddb8dbf-rxs4m           2/2    Running      ❹
❶ Visualizes metrics generated by the proxies and collected by Prometheus
❷ Distributed tracing system to visualize request flow through the mesh
❸ A web console for the mesh; more about it in chapter 8
❹ Collects and stores the generated metrics as time-series data
2.2 Getting to know the Istio control plane
In the previous section, we did a demo installation of Istio that deployed all of the control-plane components and supporting components to Kubernetes. The control plane provides a way for users of the service mesh to control, observe, manage, and configure the mesh. For Istio, the control plane provides the following functions:
The bulk of these responsibilities is implemented in a single control-plane component called istiod. Figure 2.1 shows istiod along with gateways responsible for ingress traffic and egress traffic. We also see supporting components that are typically integrated with a service mesh to support observability or security use cases. We’ll take a closer look at all of these components in the forthcoming chapters. Now, let’s examine the control-plane components.

Figure 2.1 Istio control plane and supporting components
2.2.1 Istiod
Istio’s control-plane responsibilities are implemented in the istiod component. istiod, sometimes referred to as Istio Pilot, is responsible for taking higher-level Istio configurations specified by the user/operator and turning them into proxy-specific configurations for each data-plane service proxy (see figure 2.2).

Figure 2.2 Istio control plane: understanding how istiod takes configuration from operators and exposes it to the data plane (Istio proxies)
NOTE We will learn more about the xDS API in chapter 3. For now, it suffices to know that it enables the control plane to dynamically configure the service proxies.
For example, through configuration resources, we can specify how traffic is allowed into the cluster, how it is routed to specific versions of services, how to shift traffic when doing a new deployment, and how callers of a service should treat resiliency aspects like timeouts, retries, and circuit breaking. istiod takes these configurations, interprets them, and exposes them as service-proxy-specific configurations. Istio uses Envoy as its service proxy, so these configurations are translated to Envoy configurations. For example, for a service trying to talk to a catalog service, we may wish to send traffic to v2 of the service if it has the header x-dark-launch in its request. We can express that for Istio with the following configuration:
apiVersion: networking.istio.io/v1alpha3
kind: VirtualService
metadata:
  name: catalog-service
spec:
  hosts:
  - catalog.prod.svc.cluster.local
  http:
  - match:                           ❶
    - headers:
        x-dark-launch:
          exact: "v2"                ❷
    route:
    - destination:                   ❸
        host: catalog.prod.svc.cluster.local
        subset: v2
  - route:
    - destination:                   ❹
        host: catalog.prod.svc.cluster.local
        subset: v1
❹ Where to route all other traffic
For the moment, don’t worry about the specifics, as this example is just to illustrate that this YAML configuration is translated to the data plane as a proxy-specific configuration. The configuration specifies that, based on header matching, we would like to route a request to the v2 deployment of the catalog service when there is a header x-dark-launch that equals v2; and that for all other requests, we will route to v1 of the catalog service. As an operator of Istio running on Kubernetes, we would create this configuration using a tool like kubectl. For example, if this configuration is stored in a file named catalog-service.yaml, we can create it as follows:
We’ll dig deeper into what this configuration does later in the chapter. For now, just know that configuring Istio traffic routing rules will use a similar pattern: describe intent in Istio resource files (YAML) and pass it to the Kubernetes API.
Istio reads Istio-specific configuration objects, like VirtualService in the previous configuration, and translates them into Envoy’s native configuration. istiod exposes this configuration intent to the service proxies as Envoy configuration through its data-plane API:
"domains": [
  "catalog.prod.svc.cluster.local"
],
"name": "catalog.prod.svc.cluster.local:80",
"routes": [
  {
    "match": {
      "headers": [
        {
          "name": "x-dark-launch",
          "value": "v2"
        }
      ],
      "prefix": "/"
    },
    "route": {
        "cluster":
        "outbound|80|v2|catalog.prod.svc.cluster.local",
        "use_websocket": false
    }
  },
  {
    "match": {
      "prefix": "/"
    },
    "route": {
      "cluster":
      "outbound|80|v1|catalog.prod.svc.cluster.local",
      "use_websocket": false
    }
  }
]
This data-plane API exposed by istiod implements Envoy’s discovery APIs. These discovery APIs, like those for service discovery (listener discovery service [LDS]), endpoints (endpoint discovery service [EDS]), and routing rules (route discovery service [RDS]) are known as the xDS APIs. These APIs allow the data plane to separate how it is configured and dynamically adapt its behavior without having to stop and reload. We’ll cover these xDS APIs from the perspective of the Envoy proxy in chapter 3.
With the Istio service mesh, service proxies run alongside each application instance, and all application traffic goes through these proxies. When an application wishes to issue a request to another service, the proxies on the sender and receiver talk to each other directly.
One of Istio’s core features is the ability to assign an identity to each workload instance and encrypt the transport for calls between services since it sits at both ends (origination and termination) of the request path. To do this, Istio uses X.509 certificates to encrypt the traffic.
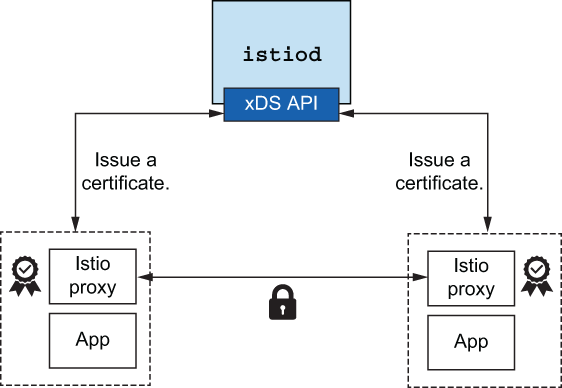
Figure 2.3 Istio control plane issues certificates to each workload.
Workload identity is embedded in these certificates following the SPIFFE (Secure Production Identity Framework For Everyone; https://spiffe.io) specification. This gives Istio the ability to provide strong mutual authentication (mTLS) without the applications being aware of certificates, public/private keys, and so on. istiod handles attestation, signing, and delivery of the certificates and rotation of the certificates used to enable this form of security (see figure 2.3). We’ll cover security in chapter 9.
2.2.2 Ingress and egress gateway
For our applications and services to provide anything meaningful, they need to interact with applications that live outside of our cluster. Those could be existing monolith applications, off-the-shelf software, messaging queues, databases, and third-party partner systems. To do this, operators need to configure Istio to allow traffic into the cluster and be very specific about what traffic is allowed to leave the cluster. Modeling and understanding what traffic is allowed into and out of the cluster is good practice and improves our security posture.
Figure 2.4 shows the Istio components that provide this functionality: istio-ingressgateway and istio-egressgateway. We saw those when we printed out the control plane components.
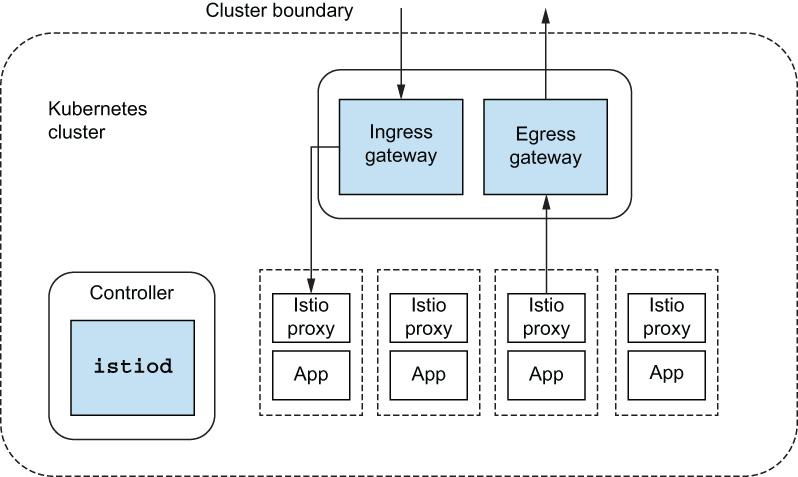
Figure 2.4 Incoming and outgoing traffic flow through Istio gateways
These components are really Envoy proxies that can understand Istio configurations. Although they are not technically part of the control plane, they are instrumental in any real-world usage of a service mesh. These components reside in the data plane and are configured very similarly to Istio service proxies that live with the applications. The only actual difference is that they’re independent of any application workload and are just to let traffic into and out of the cluster. In future chapters, we’ll see how these components play a role in combining clusters and even clouds.
2.3 Deploying your first application in the service mesh
The ACME company is redoing its website and the systems that power inventory and checkout. The company has decided to use Kubernetes as the core of its deployment platform and to build its applications to the Kubernetes API and not a specific cloud vendor. ACME is looking to solve some of the challenges of service communication in a cloud environment, so when its head architect found out about Istio, the company decided to use it. ACME’s application is an online web store that consists of typical enterprise application services (see figure 2.5). We’ll walk through the components that make up the store, but for this first look at Istio’s functionality, we focus on a smaller subset of the components.

Figure 2.5 Example application consisting of web app and catalog services
To get the source code for this example, download it from http://istioinaction.io or clone it from https://github.com/istioinaction/book-source-code. In the services directory, you should see the Kubernetes resource files that describe the deployment of our components. The first thing to do is create a namespace in Kubernetes in which we’ll deploy our services:
$  kubectl create namespace istioinaction
$  kubectl config set-context $(kubectl config current-context)
 --namespace=istioinaction
Now that we’re in the istioinaction namespace, let’s take a look at what we’re going to deploy. The Kubernetes resource files for catalog-service can be found in the $SRC_BASE/services/catalog/kubernetes/catalog.yaml file and looks similar to this:
apiVersion: v1
kind: Service
metadata:
  labels:
    app: catalog
  name: catalog
spec:
  ports:
  - name: http
    port: 80
    protocol: TCP
    targetPort: 3000
  selector:
    app: catalog
---
apiVersion: apps/v1
kind: Deployment
metadata:
  labels:
    app: catalog
    version: v1
  name: catalog
spec:
  replicas: 1
  selector:
    matchLabels:
      app: catalog
      version: v1
  template:
    metadata:
      labels:
        app: catalog
        version: v1
    spec:
      containers:
      - env:
        - name: KUBERNETES_NAMESPACE
          valueFrom:
            fieldRef:
              fieldPath: metadata.namespace
        image: istioinaction/catalog:latest
        imagePullPolicy: IfNotPresent
        name: catalog
        ports:
        - containerPort: 3000
          name: http
          protocol: TCP
        securityContext:
          privileged: false
Before we deploy this, however, we want to inject the Istio service proxy so that this service can participate in the service mesh. From the root of the source code, run the istioctl command we introduced earlier:
The istioctl kube-inject command takes a Kubernetes resource file and enriches it with the sidecar deployment of the Istio service proxy and a few additional components (elaborated on in appendix B). Recall from chapter 1 that a sidecar deployment packages a complementing container alongside the main application container: they work together to deliver some functionality. In the case of Istio, the sidecar is the service proxy, and the main application container is your application code. If you look through the previous command’s output, the YAML now includes a few extra containers as part of the deployment. Most notably, you should see the following:
      - args:
        - proxy
        - sidecar
        - --domain
        - $(POD_NAMESPACE).svc.cluster.local
        - --serviceCluster
        - catalog.$(POD_NAMESPACE)
        - --proxyLogLevel=warning
        - --proxyComponentLogLevel=misc:error
        - --trust-domain=cluster.local
        - --concurrency
        - "2"
        env:
        - name: JWT_POLICY
          value: first-party-jwt
        - name: PILOT_CERT_PROVIDER
          value: istiod
        - name: CA_ADDR
          value: istiod.istio-system.svc:15012
        - name: POD_NAME
          valueFrom:
            fieldRef:
              fieldPath: metadata.name
...
        image: docker.io/istio/proxyv2:{1.13.0}
        imagePullPolicy: Always
        name: istio-proxy
In Kubernetes, the smallest unit of deployment is called a Pod. A Pod can be one or more containers deployed atomically together. When we run kube-inject, we add another container named istio-proxy to the Pod template in the Deployment object, although we haven’t actually deployed anything yet. We could deploy the YAML file created by the kube-inject command directly; however, we are going to take advantage of Istio’s ability to automatically inject the sidecar proxy.
To enable automatic injection, we label the istioinaction namespace with istio-injection=enabled:
Now let’s create the catalog deployment:
$  kubectl apply -f services/catalog/kubernetes/catalog.yaml

serviceaccount/catalog created
service/catalog created
deployment.apps/catalog created
If we ask Kubernetes what Pods are deployed, we see something like this:
$  kubectl get pod
NAME                       READY     STATUS    RESTARTS   AGE
catalog-7c96f7cc66-flm8g   2/2       Running   0          1m
If the Pods are not ready, it may take a few moments to download the Docker images. After things come to a steady state, you should see the Pod with Running in the Status column, as in the previous snippet. Also note the 2/2 in the Ready column: this means there are two containers in the Pod, and two of them are in the Ready state. One of those containers is the application container, catalog in this case. The other container is the istio-proxy sidecar.
At this point, we can query the catalog service from within the Kubernetes cluster with the hostname catalog.istioinaction. Run the following command to verify everything is up and running properly. If you see the following JSON output, the service is up and running correctly:
$  kubectl run -i -n default --rm --restart=Never dummy
--image=curlimages/curl --command --
sh -c 'curl -s http://catalog.istioinaction/items/1'

{
  "id": 1,
  "color": "amber",
  "department": "Eyewear",
  "name": "Elinor Glasses",
  "price": "282.00"
}
Next we deploy the webapp service, which aggregates the data from the other services and displays it visually in the browser. This service also exposes an API that ends up calling the catalog service, which we just deployed and verified. This means webapp is like a facade of the other backend services:
$  kubectl apply -f services/webapp/kubernetes/webapp.yaml

serviceaccount/webapp created
service/webapp created
deployment.apps/webapp created
If we list the Pods in our Kubernetes cluster, we see our new webapp deployment with 2/2 containers running:
$  kubectl get pod

NAME                       READY   STATUS    RESTARTS   AGE
catalog-759767f98b-mcqcm   2/2     Running   0          3m59s
webapp-8454b8bbf6-b8g7j    2/2     Running   0          50s
Finally, let’s call the new webapp service and verify that it works:
$  kubectl run -i -n default --rm --restart=Never dummy
--image=curlimages/curl --command --
sh -c 'curl -s http://webapp.istioinaction/api/catalog/items/1'
If this command completes correctly, you should see the same JSON response as when we called the catalog service directly. Additionally, we can visualize the content of all the services behind the webapp service by accessing it through the browser. To do so, port-forward the application to your localhost:
You can open the web application UI on your browser at http://localhost:8080, as shown in figure 2.6.

Figure 2.6 The web app user interface presents the data queried from the other services.
So far, all we’ve done is deploy the catalog and webapp services with the Istio service proxies. Each service has its own sidecar proxy, and all traffic to or from the individual services goes through the respective sidecar proxy (see figure 2.7).
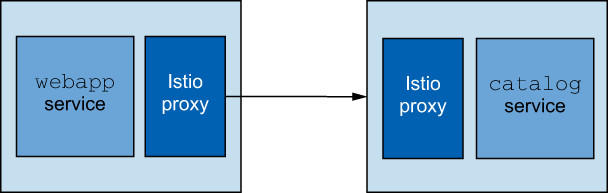
Figure 2.7 The webapp service calling the catalog service both with istio-proxy injected
2.4 Exploring the power of Istio with resilience, observability, and traffic control
In the previous example, we had to port-forward the webapp service locally because, so far, we have no way of getting traffic into the cluster. With Kubernetes, we typically use an ingress controller like Nginx or a dedicated API gateway like Solo.io’s Gloo Edge to do that. With Istio, we can use an Istio ingress gateway to get traffic into the cluster, so we can call our web application. In chapter 4, we’ll look at why the out-of-the-box Kubernetes ingress resource is not sufficient for typical enterprise workloads and how Istio has the concepts of Gateway and VirtualService resources to solve those challenges. For now, we’ll use the Istio ingress gateway to expose our webapp service:
$  kubectl apply -f ch2/ingress-gateway.yaml

gateway.networking.istio.io/coolstore-gateway created
virtualservice.networking.istio.io/webapp-virtualservice created
At this point, we’ve made Istio aware of the webapp service at the edge of the Kubernetes cluster, and we can call into it. Let’s see whether we can reach our service. First we need to get the endpoint on which the Istio gateway is listening. On Docker Desktop, it defaults to http://localhost:80:
If you’re running on your own Kubernetes cluster—for example, on a public cloud—you can find the public cloud’s external endpoint by listing the Kubernetes services in the istio-system namespace :
$  URL=$(kubectl -n istio-system get svc istio-ingressgateway
-o jsonpath='{.status.loadBalancer.ingress[0].ip}')

$  curl $URL/api/catalog/items/1
If you cannot use a load balancer, an alternative approach is to port-forward to your local machine using kubectl, as follows (updating the URL to localhost:8080):
$  kubectl port-forward deploy/istio-ingressgateway
-n istio-system 8080:8080
After hitting the endpoint with curl as we did here, you should see the same output as in the previous steps where we hit the services individually.
If you have encountered any errors up to this point, go back and make sure you successfully complete all of the steps. If you still encounter errors, ensure that the Istio ingress gateway has a route to our webapp service set up properly. To do that, you can use Istio’s debugging tools to check the configuration of the ingress gateway proxy. You can use the same technique to check any Istio proxy deployed with any application, but we’ll come back to that. For now, check whether your gateway has a route:
$  istioctl proxy-config routes
deploy/istio-ingressgateway.istio-system
You should see something similar to this:
NOTE: This output only contains routes loaded via RDS.
NAME       DOMAINS  MATCH              VIRTUAL SERVICE
http.80    *        /*                 webapp-virtualservice.istioinaction
           *        /healthz/ready*
           *        /stats/prometheus*
If you don’t, your best bet is to double-check that the gateway and virtual service resources were installed:
$  kubectl get gateway
$  kubectl get virtualservice
Additionally, make sure they are applied in the istioinaction namespace: in the virtual service definition, we use the abbreviated hostname (webapp), which lacks the namespace and defaults to the namespace the virtual service is applied to. You can also add the namespace by updating the virtual service to route traffic to the host webapp.istioinaction.
2.4.1 Istio observability
Since the Istio service proxy sits in the call path on both sides of the connection (each service has its own service proxy), Istio can collect a lot of telemetry and insight into what’s happening between applications. Istio’s service proxy is deployed as a sidecar alongside each application, so the insight it collects is from “out of process” of the application. For the most part, this means applications do not need library- or framework-specific implementations to accomplish this level of observability. The application is a black box to the proxy, and telemetry is focused on the application’s behavior as observed through the network.
Istio creates telemetry for two major categories of observability. The first is top-line metrics or things like requests per second, number of failures, and tail-latency percentiles. Knowing these values can provide great insight into where problems are starting to arise in a system. Second, Istio can facilitate distributed tracing like OpenTracing.io. Istio can send spans to distributed-tracing backends without applications having to worry about it. This way, we can dig into what happened during a particular service interaction, see where latency occurred, and get information about overall call latency. Let’s explore these capabilities hands-on with our example application.
We’ll first look at some Istio observability features we can get out of the box. In the previous section, we added two Kubernetes deployments and injected them with the Istio sidecar proxies. Then we added an Istio ingress gateway, so we could reach our service from outside the cluster. To get metrics, we will use Prometheus and Grafana.
Istio by default comes with some sample add-ons or supporting components that we installed earlier. As noted in the previous sections, these components from the Istio installation are intended for demo purposes only. For a production setup, you should install each supporting component following its respective documentation. Referring again to the diagram of the control plane (figure 2.8), we can see how these components fit in.
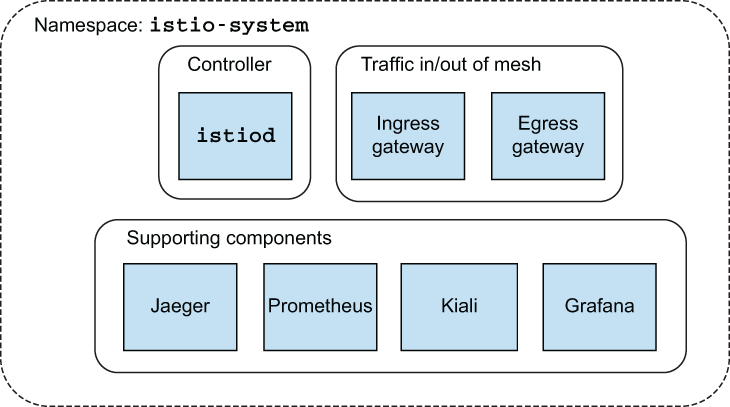
Figure 2.8 Istio control plane and supporting components
Let’s use istioctl to port-forward Grafana to our local machine, so we can see the dashboards:
$  istioctl dashboard grafana
http://localhost:3000
This should automatically open your default browser; if it doesn’t, open a browser and go to http://localhost:3000. You should arrive at the Grafana home screen, as shown in figure 2.9. In the upper-left corner, select the Home dashboard to expose a drop-down list of other dashboards we can switch to.
Istio has a set of out-of-the-box dashboards that give some basic details about the services running in Istio (see figure 2.10). With these dashboards, we can see the services we have installed and running in the mesh and some of the Istio control-plane components. In the list of dashboards, click Istio Service Dashboard. (If you don’t see it in Recents, click to expand the Istio section under Recents.)

Figure 2.9 Grafana home screen
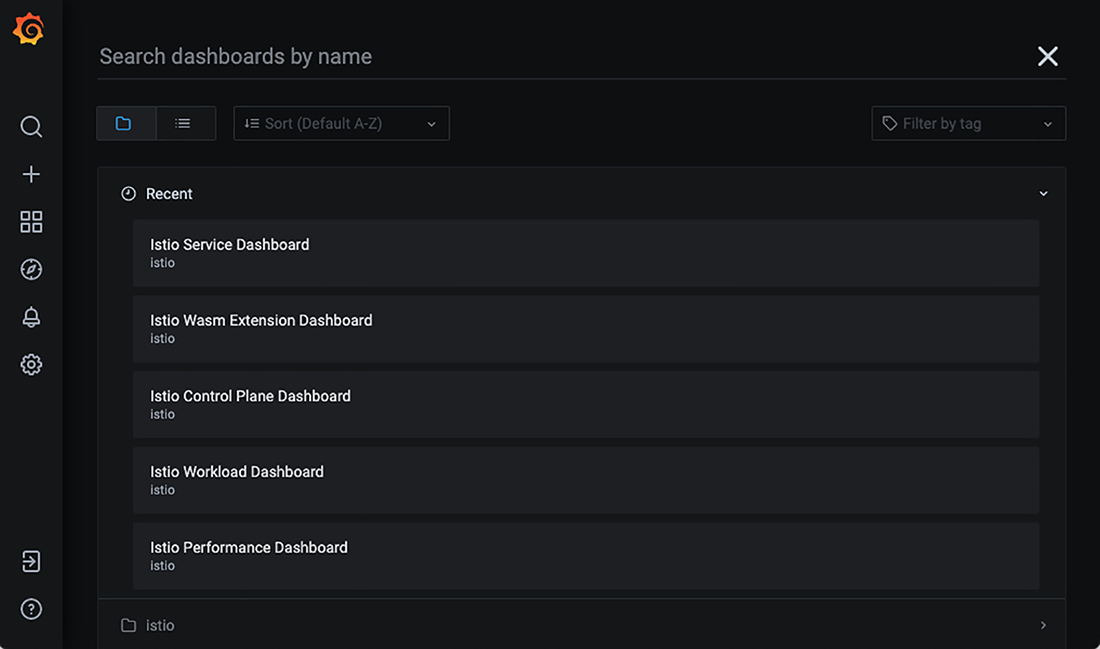
Figure 2.10 List of installed Grafana dashboards, including the Istio out-of-the-box dashboards
The dashboard should show some top-level metrics of the particular service selected. In the Service drop-down box toward the top of the dashboard, make sure the webapp.istioinaction.svc.cluster.local service is selected. It should look similar to figure 2.11.

Figure 2.11 Dashboard for the webapp service
We see metrics like Client Request Volume and Client Success Rate, but the values are mostly empty or “N/A”. In your command-line shell, let’s send some traffic to the services and watch what happens:
Press Ctrl-C to exit this while loop. Now, if you look at the Grafana dashboard, you should see some interesting traffic, as shown in figure 2.12 (you may have to refresh the dashboard).
Our service received some traffic, we had a 100% success rate, and we experienced P50, P90, and P99 tail latencies. Scroll down the dashboard, and you can see other interesting metrics about what services and clients are calling the webapp service and what that behavior looks like.

Figure 2.12 Top-level metrics for our web app as seen in Grafana
You will notice we have not added any instrumentation to our application code. Although we should always heavily instrument our applications, what we see here is what the application actually did over the network regardless of what the application thinks happened. From a black-box perspective, we can observe how the applications and their collaborators are behaving in the mesh—and all we did was add the Istio sidecar proxies. To get a more holistic view of individual calls through the cluster, we can look at things like distributed tracing to follow a single request as it hits multiple services.
Distributed tracing with open tracing
We can use Istio to take care of most of the heavy lifting to get distributed tracing out of the box. One of the add-ons that comes with Istio’s installation is the Jaeger tracing dashboard, which we can open like this:
$  istioctl dashboard jaeger

http://localhost:16686
Now, let’s use our web browser to navigate to http://localhost:16686, which should take us to the Jaeger web console (see figure 2.13). The service in the Service drop-down in the upper-left pane should be istio-ingressgateway.istio-system. If it isn’t, click the drop-down and select istio-ingressgateway.istio-system. Then click Find Traces at the lower left in the side pane. You should see some distributed tracing entries. If you don’t, re-run the traffic-generation client from your command line:
Press Ctrl-C to exit the while loop.
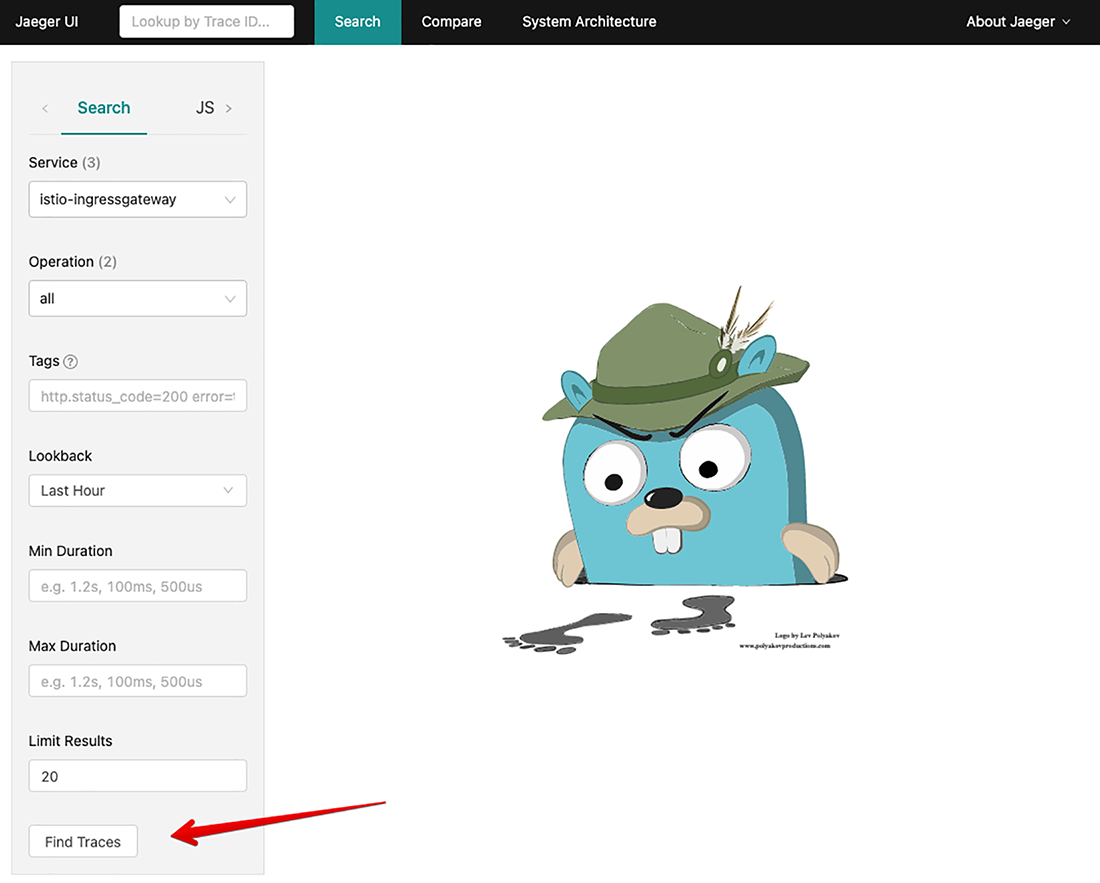
Figure 2.13 Jaeger distributed-tracing engine web console home page
You should see the most recent calls that came into the cluster and the distributed tracing spans they generated (see figure 2.14). Clicking one of the span entries displays the details of a particular call. Figure 2.15 shows that from istio-ingressgateway, the call went to the webapp service and then the catalog service.
In subsequent chapters, we’ll explore how all this works. For now, you should understand that the Istio service proxy propagated the tracing IDs and metadata between services and also sent tracing span information to a tracing engine (like Zipkin or Jaeger). However, we don’t want to gloss over the fact that the application plays a small part in this overall capability.

Figure 2.14 A collection of distributed traces gathered using Istio
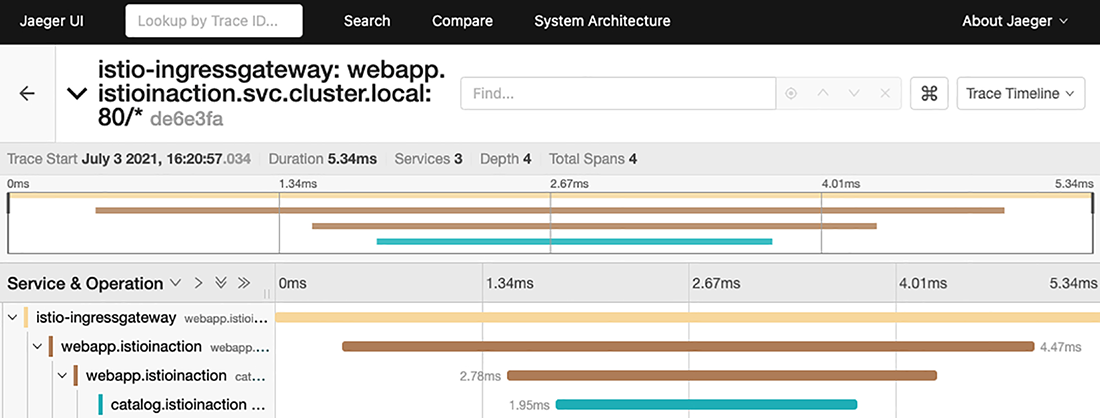
Figure 2.15 Detailed spans for a specific call
Although Istio can propagate the traces between services and to the tracing engine, the applications are responsible for propagating the tracing metadata inside themselves. The tracing metadata usually consists of a set of HTTP headers (for HTTP and HTTPS traffic), and it’s up to the application to correlate the incoming headers with any outgoing requests. Said another way, Istio cannot know what happens inside a particular service or application, so it cannot know that a specific request that comes in should be associated with a specific outgoing request (causation). It relies on the application to know that and to properly inject the headers into any outgoing request. From there, Istio can capture those spans and send them to the tracing engine.
2.4.2 Istio for resiliency
As we’ve discussed, applications that communicate over the network to help complete their business logic must be aware of and account for the fallacies of distributed computing: they need to deal with network unpredictability. In the past, we tried to include a lot of this networking workaround code in our applications by doing things like retries, timeouts, circuit-breaking, and so on. Istio can save us from having to write this networking code directly into our applications and provide a consistent, default expectation of resilience for all the applications in the service mesh.
One such resiliency aspect is retrying requests amid intermittent/transient network errors. For example, if the network experiences failures, our application may see these errors and continue by just retrying the request. In our example architectures, we’ll simulate this by driving the behavior from our catalog service.
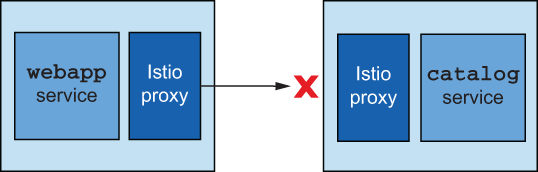
Figure 2.16 The catalog service can be provoked to fail by injecting bad behavior.
If we make a call to our webapp service endpoint, as we did in the previous section, the call returns successfully. However, if we want all calls to fail, we can use a script that injects bad behavior into the application (see figure 2.16). Running the following command from the root of our source code causes all calls to fail with an HTTP 500 error response 100% of the time:
If you query the catalog items now, HTTP 500 is returned:
$  curl -v http://localhost/api/catalog

*   Trying 192.168.64.67...
* TCP_NODELAY set
* Connected to 192.168.64.67 (192.168.64.67) port 31380 (#0)
> GET /api/catalog HTTP/1.1
> Host: 192.168.64.67:31380
> User-Agent: curl/7.54.0
> Accept: */*
>
< HTTP/1.1 500 Internal Server Error
< content-type: text/plain; charset=utf-8
< x-content-type-options: nosniff
< date: Wed, 17 Apr 2019 00:13:16 GMT
< content-length: 30
< x-envoy-upstream-service-time: 4
< server: istio-envoy
<
error calling Catalog service
* Connection #0 to host 192.168.64.67 left intact
To demonstrate Istio’s ability to automatically perform a retry for an application, let’s configure the catalog service to generate errors 50% of the time when we call our webapp service endpoint:
Now we can test the service responses:
$  while true; do curl http://localhost/api/catalog ;
sleep .5; done
Press Ctrl-C to exit this while loop.
The output from this command should be intermittent successes and failures from the webapp service. Actually, the failures are caused when webapp talks with catalog service (the catalog service is misbehaving). Let’s see how we can use Istio to make the network more resilient between webapp and catalog.
Using an Istio VirtualService, we can specify rules about interacting with services in the mesh. The following is an example of the catalogVirtualService definition:
apiVersion: networking.istio.io/v1alpha3
kind: VirtualService
metadata:
  name: catalog
spec:
  hosts:
  - catalog
  http:
  - route:
    - destination:
        host: catalog
    retries:
      attempts: 3
      perTryTimeout: 2s
With this definition, we specify that requests to the catalog service are eligible for retry up to three times, with each try having a timeout of two seconds. If we put this rule into place, we can use Istio to automatically retry when we experience failures (as we did in the previous step). Let’s create this rule and re-run our test client script:
$  kubectl apply -f ch2/catalog-virtualservice.yaml

virtualservice.networking.istio.io/catalog created
Now try running the client script again:
$  while true; do curl http://localhost/api/catalog ;
sleep .5; done
Press Ctrl-C to exit this while loop.
You should see fewer exceptions bubbling up to the client. Using Istio, and without touching any application code, we can add a level of resilience when communicating over the network.
Let’s disable the failures in the catalog service:
This should stop any misbehaving responses from catalog.
2.4.3 Istio for traffic routing
The last Istio capability we’ll look at in this chapter is the ability to have very fine-grained control over requests in the service mesh no matter how deep they are in a call graph. So far, we’ve looked at a simple architecture consisting of the webapp service providing a facade over any of the services it communicates with in the backend. The one service it talks to at the moment is catalog. Let’s say we want to add some new functionality to the catalog service. For this example, we’ll add a flag to the payload to indicate whether an image is available for a particular item in the catalog. We want to expose this information to end callers (like a user interface capable of understanding this flag, or a service that can then use the flag to decide whether to enrich an item with more image information, and so on) that can handle this change.
V1 of the catalog service has the following properties in its response:
  {
    "id": 1,
    "color": "amber",
    "department": "Eyewear",
    "name": "Elinor Glasses",
    "price": "282.00"
  }
For v2 of catalog, we have added a new property named imageUrl:
  {
    "id": 1,
    "color": "amber",
    "department": "Eyewear",
    "name": "Elinor Glasses",
    "price": "282.00"
    "imageUrl": "http://lorempixel.com/640/480"
   }
When we make requests to the catalog service, for version v2, we’ll expect this new imageUrl field in the response.
In principle, we want to deploy the new version of catalog, but we also want to finely control to whom it is exposed (released). It’s important to be able to separate deployment from release in such a way as to reduce the chances of breaking things in production and having paying customers be at the forefront of our risky behavior. Specifically, a deployment is when we bring new code to production. When it’s in production, we can run tests against it and evaluate whether it’s fit for production usage. When we release code, we bring live traffic to it. We can exercise a phased approach to a release wherein we route only certain classes of users to the new deployment. One such strategy could be to only route internal employees to new deployments and watch how the deployment and overall system behave. We could then graduate the traffic up to non-paying customers, silver-level customers, and so on. We’ll cover more of this principle in chapter 5 when we look deeper at Istio’s request-routing functionality.
Using Istio, we can finely control which traffic goes to v1 of our service and which requests go to v2. We use a concept from Istio called a DestinationRule to split up our services by version, as follows:
apiVersion: networking.istio.io/v1alpha3
kind: DestinationRule
metadata:
  name: catalog
spec:
  host: catalog
  subsets:
  - name: version-v1
    labels:
      version: v1
  - name: version-v2
    labels:
      version: v2
With this DestinationRule, we denote two different versions of the catalog service. We specify the group based on the labels of the deployments in Kubernetes. Any Kubernetes Pods labeled with version:v2 belong to the v2 group of the catalog service that Istio knows about. Before we create the DestinationRule, let’s deploy a second version of catalog:
$  kubectl apply
     -f services/catalog/kubernetes/catalog-deployment-v2.yaml
deployment.extensions/catalog-v2 created
When the new deployment is ready, we see a second catalog Pod:
$  kubectl get pod

NAME                          READY     STATUS    RESTARTS   AGE
webapp-bd97b9bb9-q9g46        2/2       Running   0          17m
catalog-5dc749fd84-fwcl8      2/2       Running   0          10m
catalog-v2-64d758d964-rldc7   2/2       Running   0          38s
If we call our service a handful of times, some of the responses have our new imageUrl field in the response, and some do not. By default, Kubernetes can do a limited form of load balancing between the two versions:
Press Ctrl-C to exit this while loop.
However, we want to safely deploy software to production without impacting end users, and we also have the option to test it in production before releasing it. So we will restrict traffic to the v1 version of catalog for now.
The first thing we do is let Istio know how to identify different versions of our catalog service. We use the DestinationRule to do that:
$  kubectl apply -f ch2/catalog-destinationrule.yaml
destinationrule.networking.istio.io/catalog created
Next, we create a rule in the catalog VirtualService that says to route all traffic to v1 of catalog:
apiVersion: networking.istio.io/v1alpha3
kind: VirtualService
metadata:
  name: catalog
spec:
  hosts:
  - catalog
  http:
  - route:
    - destination:
        host: catalog
        subset: version-v1
Let’s update the catalogVirtualService with our new traffic routing rule:
$   kubectl apply -f ch2/catalog-virtualservice-all-v1.yaml

virtualservice.networking.istio.io/catalog created
Now, if we send traffic to our webapp endpoint, we see only v1 responses:
Press Ctrl-C to exit this while loop.
Let’s say that for certain users, we want to expose the functionality of v2 of the catalog service. Istio gives us the power to control the routing for individual requests and match on things like request path, headers, cookies, and so on. If users pass in a specific header, we will allow them to hit the new catalog v2 service. Using a revised VirtualService definition for catalog, let’s match on a header called x-dark-launch. We’ll send any requests with that header to catalog v2:
apiVersion: networking.istio.io/v1alpha3
kind: VirtualService
metadata:
  name: catalog
spec:
  hosts:
  - catalog
  http:
  - match:                  ❶
    - headers:
        x-dark-launch:
          exact: "v2"
    route:                  ❷
    - destination:
        host: catalog
        subset: version-v2
  - route:
    - destination:          ❸
        host: catalog
        subset: version-v1
❷ A route to v2 that is activated when matched
Let’s create this new routing rule in our VirtualService:
$  kubectl apply -f ch2/catalog-virtualservice-dark-v2.yaml
virtualservice.networking.istio.io/catalog configured
Try calling the webapp endpoint again. You should see only v1 responses from the catalog service in the response:
Now, let’s call the endpoint with our special header x-dark-launch:
$  curl http://localhost/api/catalog -H "x-dark-launch: v2"
[
  {
    "id": 0,
    "color": "teal",
    "department": "Clothing",
    "name": "Small Metal Shoes",
    "price": "232.00",
    "imageUrl": "http://lorempixel.com/640/480"
  }
]
When we include the x-dark-launch:v2 header in our call, we see the response from the catalog-v2 service; all other traffic goes to catalog-v1. Here we’ve used Istio to finely control the traffic to our services based on individual requests.
Before we move on, delete the example applications. We’ll reinstall the individual components as we go:
$  kubectl delete deployment,svc,gateway,
virtualservice,destinationrule --all -n istioinaction
In the next chapter, we take a deeper look at the Envoy proxy, Istio’s default data-plane proxy, to understand it as a standalone component. Then we show how Istio uses Envoy to achieve the functionality desired by a service mesh.
Summary
-
We can use
istioctlto install Istio andistioctlxprecheckto verify that Istio can be installed in a cluster. -
Istio’s configuration is implemented as Kubernetes custom resources.
-
To configure proxies, we describe the intent in YAML (according to the Istio custom resources) and apply it to the cluster.
-
The control plane watches for Istio resources, converts them to Envoy configuration, and uses the xDS API to dynamically update Envoy proxies.
-
Inbound and outbound traffic to and from the mesh is managed by ingress and egress gateways.
-
The sidecar proxy can be injected manually into YAML using
istioctlkube-inject. -
In namespaces labeled with
istio-injection=enabled, the proxies are automatically injected into newly created Pods. -
We can use the
VirtualServiceAPI to manipulate application network traffic, such as implementing retries on failed requests.