
![]()
In the world of interactivity, a simple animation can be both a great introduction to learning as well as effective for conveying messages to the user. Many people believe that all interactive features on websites are games, but this just is not true! I hope that from this chapter you will gain an insight of how you can do something a little bit differently—how to stand out from the standard websites with professional animations.
There are many ways we can add animation these days, with the ever-more impressive HTML and CSS technologies, including: transforms, canvas, and SVG. I focus on canvas as it is used heavily throughout the book, though you should feel comfortable using all three and understand the pros and cons of each. In brief, you can think of canvas as raster and SVG as vector, with transforms used to manipulate DOM elements.
What Is Canvas?
Canvas is well named, as it can be likened to a painter’s canvas because it is empty until you start painting. On its own, canvas is no different than a div—it is a blank non-semantic block element. The difference however is that canvas has a context that can be used for drawing on with JavaScript, this context can be extracted using var ctx = canvas.getContext('2d'); where canvas is a variable containing reference to a canvas element. You may have noticed that I have specified a 2d context, getContext allows you to choose between multiple contexts, currently the 2d context is the most common and most well developed; however WebGL and other technologies can be used for a 3d context.
Because canvas is not supported in legacy browsers, it is possible to declare a fallback so that other content can be shown instead—such as a static image or a flash animation. To add a fallback you simply just write html between the canvas tags. I would recommend you avoid writing “Canvas is not supported in your browser” because the experience of a website should be tailored to the capabilities of the device/browser rather than to criticize the user for their browsing habits; however for simplicity’s sake I will be breaking that rule for many exercises in this book.
<canvas id="animation">
    <img src="images/canvas-fallback.png">
</canvas>
Once you have a context, you can start drawing. All drawing features of the context use the Cartesian grid system in which you have both the x and y axes, it should be noted that—as with most computer-based graphics—the context uses the bottom-right quadrant, so the top-left corner is its origin (0,0).
var ctx = canvas.getContext('2d'),
//fillRect(x, y, width, height);
ctx.fillRect(10, 10, 50, 50);
The preceding code paints a 50px × 50px square at 10px away from the top-left corner on each axis. Do note that any four-sided shapes are called rectangles in canvas. By default this rectangle is black. Because the drawing onto context is procedural, it is required that we change color before we draw the object. After we have changed the color, all objects will use the same color until it is changed again.
// This sets the fill color to red
ctx.fillStyle = "#ff0000";

// fillRectangle(x, y, width, height);
ctx.fillRect(10, 10, 50, 50);
As you can see in Figure 2-1, the preceding code simply draws the same rectangle in red.
Figure 2-1. A simple red rectangle
So now, since we are concerned with animation, let’s get this square moving!
RequestAnimationFrame
If you have ever needed repetitive tasks in JavaScript, such as polling, then you will probably have experience with setInterval and setTimeout. Both of these functions are unreliable because they can trigger at anytime after the timeout rather than on it, which can cause trouble if you need them to be triggered immediately (something that is quite important for smooth animations). Also, many browsers have a minimum timer resolution of about 16ms that can cause delays especially when not expected. Another problem with using timeouts is that you need to set the timeout manually; so any testing will be specific to that computer. On the other hand, requestAnimationFrame (rAF) can be used to trigger at the best time for the computer it is running on. Rather than a set time, it runs up to 60 frames per second but fires less frequently (such as when the browser tab is in the background). A further optimization that can be used is the second parameter, which can be a DOM element to constrain the rAF.
Due to a lack of browser support of requestAnimationFrame in some browsers at the time of writing, it is recommended to use a shim so that it works across browsers that implement a version of it. I will not be including this in the code examples, but you should take it as required until all browsers support the standards correctly.
// Shim for RequestAnimationFrame
(function() {
  var requestAnimationFrame = window.requestAnimationFrame || window.mozRequestAnimationFrame ||
                              window.webkitRequestAnimationFrame || window.msRequestAnimationFrame;
  window.requestAnimationFrame = requestAnimationFrame;
})();
I find that it is important to separate code, so while I will not be using any particular design patterns yet (being small amounts of code), I encourage you to organize your code appropriately. For this section I think logic() and draw() are appropriate names for functions.
// This is a way of selecting
var ele = document.querySelector("#animation");
var ctx = ele.getContext('2d'),
var x = y = 10;
var width = height = 50;

function logic () {
    x += 10;
    if (x < ele.width - width) requestAnimationFrame(draw);
}

function draw()  {
    ctx.clearRect(0, 0, ele.width, ele.height);

    // This sets the fill colour to red
    ctx.fillStyle = "#ff0000";

    // fillRectangle(x, y, width, height);
    ctx.fillRect(x, y, 50, 50);
}

requestAnimationFrame(draw);
setInterval(logic, 1000/60);
You will notice that I have used both requestAnimationFrame and setInterval, this is due to the fact that you rarely want the animation to be running at full speed (dependent on the computer) so this allows the speed to be set while still using requestAnimationFrame to improve the performance of the rendering. Now, I mentioned animation does not have to run at full speed, but I have not yet showed you how to easily change that speed—for that we are going to use Linear Interpolation.
Linear Interpolation
Linear Interpolation (lerp) is used to define subcoordinates of the particular path. This can be likened to taking a long journey and stopping off for food along the way. In animation, it is used to smooth out the path, so instead of jumping from one point to another it appears to slide between them (of course, it actually just makes much smaller jumps).
n = start + (end - start) * speed
The preceding code equation is used to work out the next point of the interpolation. This should be iterated so that every frame the start variable is the n of the previous frame, because it is gradually moving toward the end point (now dependent on the speed set rather than the fps).
var ele = document.querySelector("#animation");
var ctx = ele.getContext('2d'),
var startX = 10;
var startY = 10;
var endX = ele.width - 50;
var x = startX;
var y = startY;
var duration = 0;
var width = height = 50;

function lerp(start, end, speed) {
    return start + (end - start) * speed;
}

function logic () {
    duration += 0.02;
    x = lerp(startX, endX, duration);
    if (x < ele.width - width)
        requestAnimationFrame(draw);
}

function draw()  {
    ctx.clearRect(0, 0, ele.width, ele.height);

    // This sets the fill colour to red
    ctx.fillStyle = "#ff0000";

    // fillRectangle(x, y, width, height);
    ctx.fillRect(x, y, 50, 50);
}
requestAnimationFrame(draw);
setInterval(logic, 1000/60);
This is not too different from the previous version, except we now have a lerp() function almost identical to the earlier equation. I have also defined duration, startX, and startY variables to be plugged into the function. The biggest change is logic(). Rather than adjusting x (which causes it to jump), I increased duration by a tiny amount, which I then simply plugged into the lerp() function to get the new value for x (which is somewhere on the path to the final x destination).
Follow the Mouse
Quite often, you will need interactive animation rather than just a video. A common way to add interactivity within canvas is by using the mouse. To start with, I will show you how you can get your little red square to follow your movements.
The mouse is handled by the operating system and so triggers an event for all programs to access, which means of course that the term “mouse” actually means any device capable of triggering the event. For this case, we need to look for the event 'mousemove'. To do so, we use addEventListener to add the listener to a specific element.
element.addEventListener(type, listener, useCapture boolean optional);
Type is the name of the event (see the list that follows of mouse-specific events). Listener can be implemented in two ways, either as an object that implements EventListener or as a simple callback function. The useCapture is a Boolean that is true if the event should be triggered on the capture stage; otherwise it will be triggered on target and bubbling phases. useCapture will default to false on modern browsers though some older browsers will require it.
click
dblclick
mousedown
mouseenter
mouseleave
mousemove
mouseover
mouseout
mouseup
To make the mouse move, you need a callback that sets the new start and end points based on the mouse, like so:
ele.addEventListener('mousemove', function(evt) {
    startX = x;
    endX = evt.clientX;
});
This sets the new path for the square, so now we just need to modify it slightly so that it is smooth. I have decided to add constraints to make sure the square doesn’t try to go off the canvas or glitch if the mouse sets x to where the square is already heading. If it doesn’t match this constraint, then duration gets set to 0.
function logic (evt) {
    var max = ele.width - width;
    duration += 0.02;
    var l = lerp(startX, endX, duration);
    if (l < max && l > 0 && endX != x)
    {
        x = l;
        requestAnimationFrame(draw);
    }
    else {
        duration = 0;
    }
}
This should show you just how easily a few tiny changes can completely change the whole animation and how the user interacts with it. See Listing 2-1 to see how it all fits together.
<!DOCTYPE html>
<html>
    <head>
        <title>Chapter 2 - Basics of Canvas</title>
    </head>

    <body>
        <canvas id="animation">
            <p>Fallback not supported.</p>
        </canvas>
        <script src="script.js"></script>
    </body>
</html>

// Polyfill for RequestAnimationFrame
(function() {
  var requestAnimationFrame = window.requestAnimationFrame || window.mozRequestAnimationFrame ||
                              window.webkitRequestAnimationFrame || window.msRequestAnimationFrame;
  window.requestAnimationFrame = requestAnimationFrame;
})();

var ele = document.querySelector("#animation");
var ctx = ele.getContext('2d'),
var width = height = 50;
var startX = 10;
var startY = 10;
var endX;
var x = startX;
var y = startY;
var duration = 0;

function logic (evt) {
    var max = ele.width - width;
    duration += 0.02;
    var l = lerp(startX, endX, duration);
    if (l < max && l > 0 && endX != x)
    {
        x = l;
        requestAnimationFrame(draw);
    }
    else {
        duration = 0;
    }
}

function draw()  {
    ctx.clearRect(0, 0, ele.width, ele.height);

    // This sets the fill colour to red
    ctx.fillStyle = "#ff0000";

    // fillRectangle(x, y, width, height);
    ctx.fillRect(x, y, 50, 50);
}

function lerp(start, end, speed) {
    return start + (end - start) * speed;
}

ele.addEventListener('mousemove', function(evt) {
    startX = x;
    endX = evt.clientX;
});

requestAnimationFrame(draw);
setInterval(logic, 1000/60);
Now that we have looked at how to animate in a static way (moving from left to right) as well as using an input, I would like to do one more example using the box by adding a dynamic element to it. There are so many options for how an animation works. The most common is bouncing an object off the boundaries of the canvas. It is not much of a step up in difficulty from the previous example but will tie in nicely with the next example (which will be a naïve implementation of flocking boids).
Instead of “lerping” between current and desired positions, to bounce a box we need to make it go in a specific direction until it hits an edge. This means that we need to use basic trigonometry to take an angle (it will begin as a random angle under 360 degrees) and to find the position. As you know from lerping, it is best to move in lots of small steps rather than a big one, so we can define the distance for the trigonometry function to find. To find the x direction, we find the cos of the angle (in radians) multiplied by the distance and for the y direction we do the same but using the sin of the angle.
function degreesToRadians(degrees) {
    return degrees * (Math.PI / 180);
}

function dir_x(length, angle) {
    return length * Math.cos(degreesToRadians(angle));
}

function dir_y(length, angle) {
    return length * Math.sin(degreesToRadians(angle));
}
Once we implement these functions, it is similar to the previous examples. We need to initialize variables for both x and y axes for distance and heading (direction). Distance should start as 0, and heading needs to be a random angle up to 360 degrees. Within logic, it is best to start with a simple check to make sure both heading variables are between −360 and 360. Then we need to check whether the object is within the boundaries, if it isn’t, then bounce it back. After that, we simply lerp between current position and the position that is found by using the degrees and direction functions above.
var ele = document.querySelector("#animation");
ele.height = window.innerHeight;
ele.width = window.innerWidth;
var ctx = ele.getContext('2d'),
var x = 10;
var y = 10;
var duration = 0;
var width = height = 50;
var heading_x = heading_y = Math.random() * 360;
var distance_x = distance_y = 0;

function logic () {
    if (heading_x > 360 || heading_x < -360) heading_x = 0;
    if (heading_y > 360 || heading_y < -360) heading_y = 0;

    if (x <= 0 || x >=ele.width - width) {
        heading_x = heading_x + 180;
    }

    if (y <= 0 || y >=ele.height - height) {
        heading_y = -heading_y;
    }

    distance_x = dir_x(2, heading_x);
    distance_y = dir_y(2, heading_y);
    if (duration < 10) duration += 0.05;
    x = lerp(x, x + distance_x, duration);
    y = lerp(y, y + distance_y, duration);
    requestAnimationFrame(draw);
}
And that’s that. You can find the full code listing for all the examples in the download that complements this book on the Apress website at www.apress.com/9781430259442 or my own website at www.shanehudson.net/javascript-creativity.
“Clever” Animation
Next we are going to create a “clever” animation—that is to say, extending on the previous concept of dynamic animation found in the bouncing box example by making objects aware of their surroundings. In 1986, Craig Reynolds created an incredible simulation of birds flocking that he called Boids. It was built on just three rules that allowed each boid to be responsible for its own movement, but also allowed it to see local neighbors and move toward them. The best explanation for each rule I have found was this:
- Separation: Steer to avoid crowding local flockmates
- Alignment: Steer toward the average heading of local flockmates
- Cohesion: Steer to move toward the average position (center of mass) of local flockmates
Our animation is based on Boids, though some of it will be simplified for brevity (I encourage you to modify my code to improve it—to do so you will probably want to use vectors). We will start with our usual set up code, getContext. etc., as well as creating an object for Boid that holds the data about location, direction, and size of the boid. Once that is done we create a function called setup(), which adds each boid (depending how many we set) onto the canvas at a random position with a random direction. I have made a simple function to wrap the JavaScript Math.random, just to make the code a bit neater.
(function()  {
 var canvas = document.querySelector("#flocking");
 var ctx = canvas.getContext('2d'),

 canvas.height = window.innerHeight;
 canvas.width = window.innerWidth;
 var flock = [];

 var flockRadius = 250;
 var neighborRadius = 10;

 var Boid = function(x, y, heading, size) {

   this.x = x;
   this.y = y;
   this.heading = heading
   this.size = size;

 };

 function setup()  {
   for (var i = 0; i < 50; i++)
   {
      flock.push(new Boid(rand(canvas.width), rand(canvas.height), rand(360), 15));
   }
   setInterval(logic, 1000/60);
 }

 function logic () {
   for (var i = 0; i < flock.length; i++)  {
     // Do something with each boid
   }
   requestAnimationFrame(draw);
 }

 function draw()  {
   // Drawing goes here
 }

 function rand(max)  {
   return Math.random() * max;
 }
 setup();
})();
You may notice that for direction instead of “up” or “right” we use degrees, 0 to 360. This makes the animation much more fluid and also allows us to use radian math later. We use a variable flockRadius to control the distance at which boids can see each other (used for heading the same way, etc.). Now let’s add some code to the drawing method. For this we are going to need to start by clearing the canvas each frame (if you don’t do this, you will just draw over the previous frame). Once the canvas is cleared, it is time to draw the boids! So we need to iterate over the flock array, while storing the current boid in a variable called b, drawing each one to the canvas (that is, the context of the canvas) at the correct position. To find the position, we take b.x and b.y but we need to add half of its size onto it, because the position is the center of the boid rather than the top left of it.
function draw()  {
  ctx.clearRect(0,0,canvas.width, canvas.height);
  for (var i = 0; i < flock.length; i++)
  {
    var b = flock[i];
      ctx.fillStyle = "blue";
      ctx.fillRect(b.x,b.y, b.size, b.size);
      ctx.beginPath();
      ctx.moveTo(b.x + (b.size / 2),b.y + (b.size / 2));
      ctx.lineTo((b.x + (b.size / 2)) + dir_x(20,flock[i].heading),(b.y + (b.size / 2)) + dir_y(20,flock[i].heading));
      ctx.strokeStyle = "red"
      ctx.stroke();
  }
}
In lineTo I have used a couple of functions used to get the position when given a distance and direction. In this case I have used the functions to draw a line pointing 20px in the direction each boid is heading. Here you can see the helper functions. They use basic trigonometry and Pythagoras, so they should be fairly easy to follow.
function distanceBetween(a, b)  {
  var dx = a.x - b.x;
  var dy = a.y - b.y;
  return Math.sqrt(dx * dx + dy * dy);
}

function angleBetween(x1, y1, x2, y2)
{
  return Math.atan2(y1 - y2, x1 - x2) * (180.0 / Math.PI);
}

function angleDifference(a1, a2)
{
  return ((((a1 - a2) % 360) + 540) % 360) - 180;
}

function degreesToRadians(degrees){
   return degrees * (Math.PI / 180);
}

function dir_x(length, angle){
  return length * Math.cos(degreesToRadians(angle));
}

function dir_y(length, angle){
  return length * Math.sin(degreesToRadians(angle));
}
Don’t be put off by all the math—it just makes it much easier to write our logic function, which we are going to do now! We need to start by setting up some variables within the for loop for the position of where the boid is headed. This is called centerx and centery, but it is not the center of the canvas (I think of it as the “center of attention”). I also provide a variable b to make it easier to access flock[i]. With the variables set up, we can now loop through the boids again to find the neighbors, which is any boid within a distance of less than flockRadius. With these we can find the average position (adding the x and y of each boid to centerx and centery, then dividing by the amount of boids in the radius). Of course, if there is only one boid in the flock we might as well give it a random position to head toward.
for (var i = 0; i < flock.length; i++)  {
  var centerx = 0;
  var centery = 0;
  var count = 0;

  var b = flock[i];

  for (var j = 0; j < flock.length; j++)
  {
    var distance = distanceBetween(b, flock[j]);
      if (distance < flockRadius)
      {
        centerx += flock[j].x;
        centery += flock[j].y;
        count++;
      }
  }

  if (count > 1) {
    centerx = centerx / count;
    centery = centery / count;
  }
  else  {
    centerx = Math.random() * canvas.width;
    centery = Math.random() * canvas.height;
  }
  // Set heading and x/y positions
}
Now that we have our center of attention/gravity (I suppose gravity is a better word for it) we can work out the angle the boid needs to turn to head in the correct direction. We do this by using the angleBetween and angleDifferencehelper functions to get the angle needed, then linear interpolating it so that every iteration it gets closer to the point it is heading. Of course, due to the way we have set up the code, the point it is heading to may change depending on its proximity to its neighbors (remember we change the center point in the nested loop). Lastly, so that the boids don’t just fly off the page, we need to define a “wrap around” so that if the boid goes off the canvas it appears on the opposite side (just like Asteroids or Snake).
if (count > 1) {
  centerx = centerx / count;
  centery = centery / count;
}
else  {
  centerx = Math.random() * canvas.width;
  centery = Math.random() * canvas.height;
}

var angleToCenter = angleBetween(b.x,b.y,centerx,centery);
var lerpangle = angleDifference(b.heading, angleToCenter);

b.heading += lerpangle * 0.01;

headingx = dir_x(2,b.heading);
headingy = dir_y(2,b.heading);

b.x += headingx;
b.y += headingy;

if (b.x < 0) b.x = canvas.width;
if (b.y < 0) b.y = canvas.height;

if (b.x > canvas.width) b.x = 0;
if (b.y > canvas.height) b.y = 0;
If you put the above code where the comment was on the previous code, you should find that you now have blue boids with red lines, indicating direction, which fly around the canvas and join groups. Figure 2-2 shows how this should look. The animation can be improved in a number of ways, such as adding separation so they fly next to each other rather than through one another.
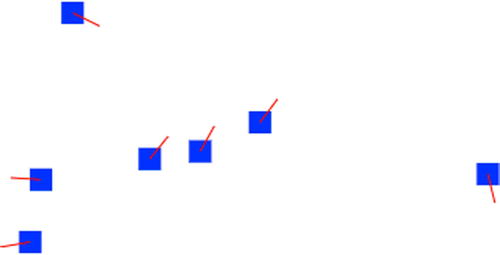
Figure 2-2. This shows each boid heading a specific direction. Also note the three boids in the middle heading the same way as a flock
In Listing 2-2 you can see the full code for this example, which is available for download online as with the previous examples.
(function()  {
  var canvas = document.querySelector("#flocking");
  var ctx = canvas.getContext('2d'),

  canvas.height = window.innerHeight;
  canvas.width = window.innerWidth;
  var flock = [];

  var flockRadius = 250;

  var Boid = function(x, y, heading, size) {

    this.x = x;
    this.y = y;
    this.heading = heading
    this.size = size;

  };

  function setup()  {
    for (var i = 0; i < 50; i++)
    {
      flock.push(new Boid(Math.random() * canvas.width, Math.random() * canvas.height, Math.random() * 360, 15));
    }
    setInterval(logic, 1000/60);
  }

  function logic () {

    for (var i = 0; i < flock.length; i++)  {
      var centerx = 0;
      var centery = 0;
      var count = 0;

      var b = flock[i];

      for (var j = 0; j < flock.length; j++)
      {
        var distance = distanceBetween(b, flock[j]);
        if (distance < flockRadius)
        {
          centerx += flock[j].x;
          centery += flock[j].y;
          count++;
        }
      }

      if (count > 1) {
        centerx = centerx / count;
        centery = centery / count;
      }
      else  {
        centerx = Math.random() * canvas.width;
        centery = Math.random() * canvas.height;
      }

      var angleToCenter = angleBetween(b.x,b.y,centerx,centery);
      var lerpangle = angleDifference(b.heading, angleToCenter);

      b.heading += lerpangle * 0.01;

      headingx = dir_x(2,b.heading);
      headingy = dir_y(2,b.heading);

      b.x += headingx;
      b.y += headingy;

      if (b.x < 0) b.x = canvas.width;
      if (b.y < 0) b.y = canvas.height;

      if (b.x > canvas.width) b.x = 0;
      if (b.y > canvas.height) b.y = 0;
    }

    requestAnimationFrame(draw);
  }

  function draw()  {
    ctx.clearRect(0,0,canvas.width, canvas.height);
    for (var i = 0; i < flock.length; i++)
    {
      var b = flock[i];
      ctx.fillStyle = "blue";
      ctx.fillRect(b.x,b.y, b.size, b.size);
      ctx.beginPath();
      ctx.moveTo(b.x + (b.size / 2),b.y + (b.size / 2));
      ctx.lineTo((b.x + (b.size / 2)) + dir_x(20,flock[i].heading),(b.y + (b.size / 2)) + dir_y(20,flock[i].heading));
      ctx.strokeStyle = "red"
      ctx.stroke();
    }
  }

  function distanceBetween(a, b)  {
    var dx = a.x - b.x;
    var dy = a.y - b.y;
    return Math.sqrt(dx * dx + dy * dy);
  }

  function angleBetween(x1, y1, x2, y2)
  {
    return Math.atan2(y1 - y2, x1 - x2) * (180.0 / Math.PI);
  }

  function angleDifference(a1, a2)
  {
    return ((((a1 - a2) % 360) + 540) % 360) - 180;
  }

  function degreesToRadians(degrees){
    return degrees * (Math.PI / 180);
  }

  function dir_x(length, angle){
    return length * Math.cos(degreesToRadians(angle));
  }

  function dir_y(length, angle){
    return length * Math.sin(degreesToRadians(angle));
  }

  setup();

})();
Introducing Drag-and-Drop
Quite often you will want to use drag-and-drop as part of an animation or as an integral part of your application. This might be for dragging elements around the page to trigger an event, or it might be to drag files from your system into the browser. I am going to introduce using a rather advanced app that works similar to a coloring book where you drag an image onto the canvas and it generates line art that the user can color in. Both of these are good examples of how we can create impressive interfaces using modern HTML, as well as prove that these technologies are not just for game creation!
As mentioned, I am going to demonstrate the technique of dragging local files into the browser by creating a small coloring book web app where dragging an image onto the canvas turns it into line art that can then be colored in using a brush. My reason for making an app like this is to both get you thinking about slightly more advanced techniques, such as edge detection, but more importantly I want you to have something you can fiddle with, and extend functionality to your heart’s desire—the only way to learn is to do. So throughout both this mini-project and, indeed, the entire book, I will be providing ideas and mentioning algorithms for you to think about and implement.
For our coloring book we need to start with a full-size canvas. This is done through JavaScript, because setting 100% width and height via CSS would scale rather than increase the size of the canvas. We also need to set up event listeners for 'dragover', 'dragenter', and 'drop' events. For the first two events we need to stop the default browser behavior, so I have created a simple function called preventDefault, .which calls a method with the same name on the event. In Listing 2-3, you can see the boilerplate code for setting up the canvas to enable drag and drop functionality.
<!DOCTYPE html>
<html>
    <head>
        <title>Coloring Book</title>
    </head>

    <body style="margin:0">
        <canvas id="drop"></canvas>
    </body>
    <script>

(function() {
    var drop = document.querySelector("#drop");
    var ctx = drop.getContext('2d'),

    /* These are to set the canvas to full width */
    drop.height = window.innerHeight;
    drop.width = window.innerWidth;

    drop.addEventListener('dragover', preventDefault);
    drop.addEventListener('dragenter', preventDefault);
    drop.addEventListener('drop', handleDrop);

    function preventDefault(e) {
      if (e.preventDefault) {
        e.preventDefault();
      }
      return false;
    }

    function handleDrop(e) {
      e.stopPropagation();
      e.preventDefault();
      e.dataTransfer.dropEffect = "copy";
      // Code for drop will go here
    }

})();
</script>
</html>
As you can see in Listing 2-3, this provides a good starting point, but now we need to actually put the image onto the canvas. All the data that we need to use is stored in e, the event variable of handleDrop, so we can move the file itself into its own variable—which I have aptly named ‘file’—using e.dataTransfer.files[0];which gives us the first of the dropped files (as in this example we will only be using one). Of course, you could extend this by making each dropped file open in a separate canvas such as Photoshop does.
Due to the way it is implemented, to draw an image to the canvas you must first put it into an HTML element; this is slightly odd but easy to work with once you know about it as luckily the element does not need to be added to the DOM. We also require a FileReader to do two things: first to turn the file into a base 64 data URL and second to add the data URL to the src of the image element once the file has loaded.
var file = e.dataTransfer.files[0];
var image = new Image();

var reader = new FileReader();
reader.readAsDataURL(file);

reader.onload = (function() {
  return function(e)  {
    image.src = e.target.result;
  };
})();
So now the image exists and is sitting in image.src, but we cannot yet see it because it hasn’t been added to the DOM or drawn to the canvas. Time to fix that! In the same way that reader had an onload event handler attribute, so does image. So we just need to write a function that draws the image to the context of the canvas at the top-left corner of the canvas (aka (0,0)). This is done like this:
function handleDrop(e) {
  e.stopPropagation();
  e.preventDefault();
  e.dataTransfer.dropEffect = "copy";

  var file = e.dataTransfer.files[0];
  var image = new Image();

  var reader = new FileReader();
  reader.readAsDataURL(file);

  reader.onload = (function() {
    return function(e)  {
      image.src = e.target.result;
    };
  })();

  image.onload = function() {
   ctx.drawImage(image, 0, 0);
  };
}
Now if you copy that into the module, you should be able to drop images onto the page and have them appear on the canvas!
We are now going to write a “naïve” edge detection filter loosely based on the Sobel operator, this implementation of the filter is based on an example within the html spec for pixel manipulation (our version reduces the colors to black and white lines). There is a more advanced version that uses Sobel called Canny Edge Detection (developed in 1986 by John F. Canny). This is one feature that you might want to add yourself because it includes noise reduction and so can produce much higher quality line art.
Let’s start by creating a new function called findEdges that takes a parameter called originalData, which should hold the image data of the context; that is, a copy of the current context state that is being shown on the canvas (in this case, our image). Within the function we should create a variable, let’s call it output, to hold the temporary image data that we will be writing each pixel to so that it can then be put back onto the context. Now, another odd thing you need to remember, to write pixels to the image data you have to have two variables, one for the 'ImageData' (our output variable) and one for the 'ImageData.data' (let’s call this outputData), which sounds silly, but both are tightly coupled so you write to outputData then put the output (automatically containing the correct data) onto the canvas context. Before we get into the edge detection algorithm I am going to show you the code for all this set-up code.
function findEdges(originalData) {
    var output = ctx.createImageData(drop.width, drop.height);

    var w = originalData.width, h = originalData.height;
    var inputData = originalData.data;
    var outputData = output.data;
    var threshold = 100;

    // edge detection goes here

    // put the image data back after manipulation
    ctx.putImageData(output, 0, 0);
}
To write the algorithm you first need to understand the data structure, which is a Uint8ClampedArray. Although the name sounds quite scary, it is an array of 8-bit unsigned (positive only) integers (or as I prefer—byte-sized elements!) that is quite simply organized as a pattern of ‘red, green, blue, alpha’ which then repeats itself, so that each pixel is made up of four array elements.
To work out the position (i) of the pixel, we need two loops, one for the height (y) of the image and another for the width (x). We can then get the first color (red) of each pixel by working out y times width of the canvas, since the array stores by row, then add x to find the position in that row. Of course, this is then multiplied by 4 due to the amount of colors (including alpha) that make up the pixel.
for (var y = 0; y < h; y += 1) {
  for (var x = 0; x < w; x += 1) {
    var i = (y * w + x) * 4;
  }
}
Now that we have worked out the position of each pixel we need to work out the weighted average, which we can do by adding all the neighboring (both directional and diagonal) colors then subtracting 8 times the current color since there are 8 neighbors. Once that is done, we set all colors in the pixel (including alpha) to 255 or 0 depending on which side of the threshold they are. The threshold I set earlier to 100 but you are welcome to fiddle around with the numbers to find the best result. After this we just put the output (the ImageData) onto the context of the canvas.
image.onload = function() {
   ctx.drawImage(image, 0, 0);
    var originalData = ctx.getImageData(0, 0, drop.width, drop.height);
    findEdges(originalData);
  };
function findEdges(originalData) {
  var output = ctx.createImageData(drop.width, drop.height);

  var w = originalData.width, h = originalData.height;
  var inputData = originalData.data;
  var outputData = output.data;
  var threshold = 100;

  // edge detection
  for (var y = 0; y < h; y += 1) {
    for (var x = 0; x < w; x += 1) {
      var i = (y * w + x) * 4;
      outputData[i] = inputData[i - w*4 - 4]  +   inputData[i - w*4]  + inputData[i - w*4 + 4] +
                  inputData[i - 4]           - 8 * inputData[i]           + inputData[i + 4] +
        inputData[i + w*4 - 4] + inputData[i + w*4] + inputData[i + w*4 + 4];
      if (outputData[i] < threshold)
      {
         outputData[i] = 255;
         outputData[i+1] = 255;
         outputData[i+2] = 255;
      }
      else
      {
         outputData[i] = 0;
         outputData[i+1] = 0;
         outputData[i+2] = 0;
      }
     outputData[i + 3] = 255; // alpha
   }
 }
 // put the image data back after manipulation
 ctx.putImageData(output, 0, 0);
}
Now when you drag an image onto the canvas you should get a rough outline. One of your challenges, if you are willing to take it, is to improve the quality of the outline. As I mentioned earlier, your best bet is probably by implementing Canny but there are also some easier changes that can be made to improve it. Please do tweet or email me any attempts at improving the algorithm!
Making the Paintbrush
Our next task is to make a paintbrush—a round circular brush, not a modern Photoshop-style brush that includes all the bristles.
As with before, we need to decide which events need to be triggered. I think we should use mousedown to trigger drawing, mouseup to stop drawing, and mousemove to draw while the mouse is down, We can check this using a Boolean called 'drawing'. In mousedown we need to call a function, I have called it startPath, to begin the path; this needs to be done separately to the rest of the path so that it does not keep trying to start a new path every time the mouse moves. In startPath we need to begin the path, using ctx.beginPath(), then move the brush to the current position of the mouse. In canvas, and indeed most other computer graphics libraries, moveTo is used to move the brush without drawing and lineTo is used to draw from the current position to the new position. I have also used startPath to set the size and the color of the brush.
drop.addEventListener('mousedown', startPath);
drop.addEventListener('mouseup', function() {
  drawing = false;
});
drop.addEventListener('mousemove', handleDrawing);

function startPath(e)  {
  ctx.strokeStyle = "#0000ff";
  ctx.lineWidth   = lineWidth;
  ctx.beginPath();
  ctx.moveTo(e.clientX + lineWidth, e.clientY + lineWidth);
  drawing = true;
}
As you can see from the code, mousemove triggers a function called handleDrawing. This uses lineTo that I mentioned earlier to draw the path, as well calls stroke to make it the size and color specified in startPath.
function handleDrawing(e)  {
  if (drawing == true)
  {
    ctx.lineTo(e.clientX + lineWidth, e.clientY + lineWidth);
    ctx.stroke();
  }
}
Our last task is to make this image downloadable. To do this we go back to using toDataURL in the href of a link. To make the link downloadable we can use the download attribute, a new feature that is available in some modern browsers. On other browsers, the user would have to right-click and manually save the image. You can add that to the alt text to make it easy to use if you want to.
var save = document.querySelector("#save");
save.addEventListener('click', saveCanvas);

function saveCanvas()  {
  var img = drop.toDataURL("image/png");
  save.href = img;
  save.download = "colouringBook.png";
}

<a id="save" class="button">Save</a>
You can see this example in its entirety below in Listing 2-4.
<!DOCTYPE html>
<html>
  <head>
    <title>Coloring Book</title>
    <style>
      body  {
        margin: 0;
        padding: 0;
      }
      #drop  {
        display: block;
        position: absolute;
        right: 0;
        top: 0;
        z-index: 0;
      }
      .button  {
        background-color: rgba(0,0,0,0.6);
        color: #fff;
        display: inline-block;
        font-family: sans-serif;
        font-size: 24px;
        font-weight: bold;
        margin: 10px 0 0 10px;
        padding: 5px;
        position: relative;
        text-transform: uppercase;
        z-index: 1;
      }
    </style>
  </head>

  <body>
    <a id="save" class="button">Save</a>
    <canvas id="drop"></canvas>
    <script src="script.js"></script>
  </body>
</html>

var colouringBook = (function() {
  var drop = document.querySelector("#drop");
  var save = document.querySelector("#save");
  var ctx = drop.getContext('2d'),
  var drawing;
  var lineWidth = 5;

  /* These are to set the canvas to full width */
  drop.height = window.innerHeight;
  drop.width = window.innerWidth;

  drop.addEventListener('dragover', preventDefault);
  drop.addEventListener('dragenter', preventDefault);
  drop.addEventListener('drop', handleDrop);

  drop.addEventListener('mousedown', startPath);
  drop.addEventListener('mouseup', function() {
    drawing = false;
  });
  drop.addEventListener('mousemove', handleDrawing);

  save.addEventListener('click', saveCanvas);

  function preventDefault(e) {
    if (e.preventDefault) {
      e.preventDefault();
    }
    return false;
  }

  function handleDrop(e) {
    e.stopPropagation();
    e.preventDefault();
    e.dataTransfer.dropEffect = "copy";

    var file = e.dataTransfer.files[0];
    var image = new Image();

    var reader = new FileReader();
    reader.readAsDataURL(file);

    reader.onload = (function() {
      return function(e)  {
        image.src = e.target.result;
      };
    })();

    image.onload = function() {
      ctx.drawImage(image, 0, 0);
      var originalData = ctx.getImageData(0, 0, drop.width, drop.height);
      findEdges(originalData);
    };
  }

  function findEdges(originalData) {
    var output = ctx.createImageData(drop.width, drop.height);

    var w = originalData.width, h = originalData.height;
    var inputData = originalData.data;
    var outputData = output.data;
    var threshold = 100;

    // edge detection
    for (var y = 0; y < h; y += 1) {
      for (var x = 0; x < w; x += 1) {
        var i = (y * w + x) * 4;

        outputData[i] = inputData[i - w*4 - 4] +   inputData[i - w*4] + inputData[i - w*4 + 4] +
                inputData[i - 4]       -   8*inputData[i]     + inputData[i + 4] +
                inputData[i + w*4 - 4] +   inputData[i + w*4] + inputData[i + w*4 + 4];

        if (outputData[i] < threshold)
        {
          outputData[i] = 255;
          outputData[i+1] = 255;
          outputData[i+2] = 255;
        }
        else
        {
          outputData[i] = 0;
          outputData[i+1] = 0;
          outputData[i+2] = 0;
        }
        outputData[i + 3] = 255; // alpha
      }
    }

    // put the image data back after manipulation
    ctx.putImageData(output, 0, 0);
  }

  function startPath(e)  {
    ctx.strokeStyle = "#0000ff";
    ctx.lineWidth   = lineWidth;
    ctx.beginPath();
    ctx.moveTo(e.clientX + lineWidth, e.clientY + lineWidth);
    drawing = true;
  }

  function handleDrawing(e)  {
    if (drawing == true)
    {
      ctx.lineTo(e.clientX + lineWidth, e.clientY + lineWidth);
      ctx.stroke();
    }
  }

  function saveCanvas()  {
    var img = drop.toDataURL("image/png");
    save.href = img;
    save.download = "colouringBook.png";
  }

})();
![]() Note You can find the full source code for this project in the download that complements the book on the Apress website at www.apress.com/9781430259442 or my own website at www.shanehudson.net/javascript-creativity/.
Note You can find the full source code for this project in the download that complements the book on the Apress website at www.apress.com/9781430259442 or my own website at www.shanehudson.net/javascript-creativity/.
You now have your coloring book as shown in Figure 2-3.
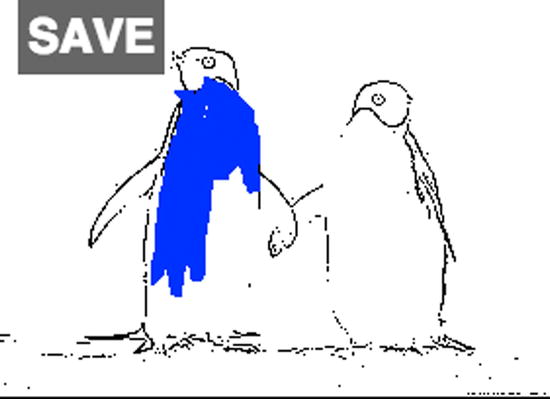
Figure 2-3. This figure shows a photo of penguins that has been turned into line art and painted on using canvas
Summary
You should now feel confident about some of the math behind animation, such as linear interpolation. You should also feel that you understand requestAnimationFrame and generally how to set up the framework of an animation. I included some drag-and-drop because I find pure “let’s paint some lines” kind of drawing examples boring. I hope this has mixed it up a bit and been useful. Both the coloring book example and boids have a massive scope of improvements (and indeed optimizations), which I encourage you to explore.
As we end this chapter, I would like to get you thinking about animation and things you can do with canvas and animation in general. We live in a world full of data. Noise. Be it statistics or tweets, it is hard to see what is important and what isn’t. The web does not need to be linear. Take, for example, a Twitter timeline. . . now imagine those tweets in the form of boids, where they group each other based on perhaps author or topic, or maybe how much the hashtag is trending. Animations are not needed for everything, but they can be both decoration as well as extremely useful. I would love to see what you come up with!