
![]()
Before we start creating the media player, I would like to spend a chapter going through 3D from basic shapes to visualizations. In the upcoming chapters we will be creating music visualizations as part of the media player but you should feel comfortable with all kinds of usages of 3D, especially data visualizations. To begin with let’s take a look at 3D graphics in general, before moving on to using a library called Three.js. Much of the basics will be familiar to you, but I would like to start from the beginning to make sure I cover it fully.
Basics of 3D
As you know, a 3D world (much like our own) consists of three dimensions: x, y, and z. These dimensions can be visualized simply by thinking of a standard Cartesian graph, where you have an axis pointing right for x, another pointing up representing y, and a third that shows depth, which is the z-axis. I say that z represents depth, because that is how it feels, but actually positive z comes toward you while negative goes away. You can see an example of this in Figure 4-1.
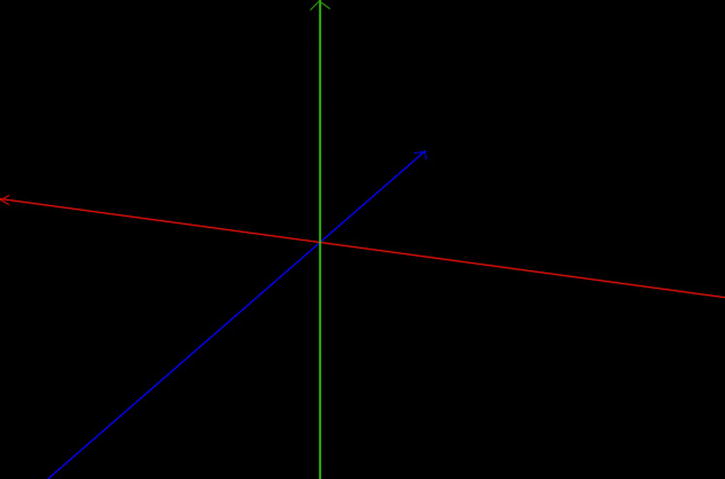
Figure 4-1. 3D axes
In the 3D world, objects and shapes are created using meshes. A mesh could be as complicated as you like, from a simple cube to an object that you have designed using 3D modeling software (we will not be going that far, but I will explain how to import the models). To give an appearance to a mesh you can use materials, which is similar to the real world in that each material has its own set of properties, such as color and opacity. We will take a look at defining our own materials later in the chapter.
As well as meshes and materials, we also have camera and lights. Whereas in a 2D animation we often move the shapes around, in a 3D animation we have the option of moving the camera (that is, what the user can see) around the scene. I mentioned lights and it is obvious what these are for, but you may well be surprised at how many different types of lighting there are. Lighting and cameras each have their own sections later in this chapter. It can be rather impressive seeing how a scene can be changed just by changing the type or position of the lights.
Three.js
Three.js is a library that makes it much easier to render 3D within the browser. It allows you to use a number of renderers, including canvas and WebGL. I would usually recommend avoiding libraries but to use WebGL without a library you need to write shaders (which are required to use WebGL due to the reliance on a GPU) in a language called GLSL, which has syntax similar to C. Learning GLSL is overkill for the aims of this book and would take longer than one chapter! I will be using version 56 of Three.js, which is also included in the downloadable source code, but you can find the latest version at http://www.mrdoob.github.com/three.js/.
Make a Scene
You can think of a scene in the same way as you would in a film—it is where you put the meshes (objects), lighting, and cameras. The scene is your stage. You can set up a scene quite simply, as all you require is the scene itself, a camera, and the renderer. Of course, that would be an empty scene! A simple scene object can be created using THREE.Scene() so let’s go ahead and create a basic (empty) scene. Afterward we can start adding basic geometry such as cubes or spheres.
We can start by creating variables for width and height to store the size of the renderer (that is, our viewport) so for this example I am going to set each to use the dimensions of the inner window. We also need a container to put the renderer in, unlike previous chapters where we made a canvas ourselves; we can let Three.js create the DOM, depending on the renderer we choose. Now we need to choose the renderer, Three.js is built in such a way that you can create your own renderer or use a third-party’s renderer but the only ones you really need to know about are the CanvasRenderer and WebGLRenderer. The difference between these is that canvas is more widely supported but WebGL is more efficient. This is because WebGL has native 3D support (OpenGL ES 2) in which the 3D math runs on the GPU, whereas Canvas has no 3D support (you have to write it yourself) meaning its 3D math runs in JavaScript (much slower). So let’s just stick to using WebGLRenderer for now, you might want to try both though just to get a feel for the differences (they are usually only subtle). With the renderer chosen, I have stored it in a variable called renderer, we can set the dimensions and add it to the DOM.
var width  = window.innerWidth,
height = window.innerHeight;

var container = document.querySelector('#container'),

var renderer = new THREE.WebGLRenderer();
renderer.setSize(width, height);
container.appendChild(renderer.domElement);
From here we need to create a camera. Later in the chapter I will go through how to use multiple cameras, but to start with let’s just have one. As with renderers, there are a couple of default camera classes and it is very easy to code your own type of camera by inheriting from the abstract Camera class. The built-in cameras are OrthographicCamera and PerspectiveCamera, which we can use to provide different views of the scene; you can usually consider perspective as showing a 3D view, while orthographic shows a 2D view. For this example let’s choose the perspective because we just want to see what is on the scene (which to start with will be nothing) rather than a particular view (such as top down). For our PerspectiveCamera there are four parameters, which according to the documentation are
- fov: Camera frustum vertical field of view
- aspect: Camera frustum aspect ratio
- near: Camera frustum near plane
- far: Camera frustum far plane
This makes sense providing you know the meaning of frustum; in this case it is simply the portion of the view. Often these parameters are stored as variables but since we have no use for them elsewhere at the moment, I have decided to write the values directly as parameters to reduce the amount of lines of code. With a camera created we can position it, for now let’s just set the camera’s z dimension to 300 so that the scene is nicely in view once we add some meshes.
var camera =  new THREE.PerspectiveCamera(45, width / height, 1, 1000);
camera.position.z = 300;
Once we have objects in the scene, you will probably benefit from fiddling with these numbers to get a feel for how they affect the view of the scene. As I mentioned earlier, to create the scene itself all you need to do is create an instance of the Scene class. With the scene created, we can add the camera to it. To render the scene we use renderer.render(scene, camera); which is self-explanatory have decided to put this within a similar set up to the one we used in Chapter 2.This works very nicely as a boilerplate for developing more advanced animations and renders.
var scene = new THREE.Scene();
scene.add(camera);

function logic()  {
    requestAnimationFrame(render);
}

function render() {
    renderer.render(scene, camera);
}

setInterval(logic, 1000/60);
A basic scene is rather boring and, quite frankly, useless. So let’s spice things up a bit by taking a look at the kinds of meshes we can use. Firstly though, we need some lighting so that we can actually see the objects (it really is like being in a room in the dark—the objects are on the scene but you cannot see them). I will explain the types of lights shortly, but for now we can just use a simple DirectionalLight, which is used just like a desk lamp in that it points in a specific direction rather than covering the entire scene. I chose to use this type of lighting because it allows us to easily see shadows straight away. A default directional light is white and has an intensity of 1; by default the light points toward the center to the scene (0,0,0). It should be noted that although the directional light has a property called position, that is the direction that the light is pointed and the light source itself does not have an actual position (it is infinite). I have decided to place light further toward the camera, so that we can see a nice simple shadow around the object.
var directionalLight = new THREE.DirectionalLight();
directionalLight.position.z = 10;
scene.add(directionalLight);
Let’s start with a sphere (similar to that of the official documentation for Three.js). To create any primitive object, we need to create a mesh that includes the type of geometry and the material. For a sphere we can use THREE.SphereGeometry with any type of material, in this example I will be using a material called THREE.MeshLambertMaterial (more information about that soon).
var radius = 100,
    segments = 50,
    rings = 50;

var sphereMaterial = new THREE.MeshLambertMaterial(
{
  color: 0xFF0000
});

var sphere = new THREE.Mesh(
    new THREE.SphereGeometry(
        radius,
        segments,
        rings),
    sphereMaterial);
scene.add(sphere);
As you can see, I have started by setting up three variables to control the properties of the sphere. You will know that radius is half of the size/diameter of the sphere. Segments and rings are used to specify the quality of the sphere—the lower the numbers the lower quality. Try changing them from 50 to 10, you will see jagged edges and will probably be able to see where the lines are that make up the rings and segments. You can think of them similar to latitude and longitude; rings go horizontally around the sphere and segments are vertical.
![]() Note If you are familiar with bitmap images or mathematical geometry, you will understand that there is no perfect curve, so there is no correct answer for how many rings and segments you should have. Just choose the number that feels right as a tradeoff between quality and optimization.
Note If you are familiar with bitmap images or mathematical geometry, you will understand that there is no perfect curve, so there is no correct answer for how many rings and segments you should have. Just choose the number that feels right as a tradeoff between quality and optimization.
If you run the following code you should see a red sphere.
<!DOCTYPE html>
<html>
  <head>
    <title>Shapes In Scene</title>
    <style>
      * { margin: 0; }
      canvas { background: #000;}
    </style>
  </head>
  <body>
    <div id="container"></div>
    <script src="../three.min.js"></script>
    <script src="script.js"></script>
  </body>
</html>
var width  = window.innerWidth,
height = window.innerHeight;

var container = document.querySelector('#container'),

var renderer = new THREE.WebGLRenderer();
renderer.setSize(width, height);
container.appendChild(renderer.domElement);

var VIEW_ANGLE = 45,
    NEAR = 0.1,
    FAR = 10000;
var camera =  new THREE.PerspectiveCamera(45, width / height, 1, 1000);
camera.position.z = 300;

var scene = new THREE.Scene();
scene.add(camera);

var directionalLight = new THREE.DirectionalLight();
directionalLight.position.z = 10;
scene.add(directionalLight);

var radius = 100,
    segments = 50,
    rings = 50;

var sphereMaterial = new THREE.MeshLambertMaterial(
{
  color: 0xFF0000
});

var sphere = new THREE.Mesh(
    new THREE.SphereGeometry(
        radius,
        segments,
        rings),
    sphereMaterial);
scene.add(sphere);

function logic()  {
  requestAnimationFrame(render);
}

function render() {
  renderer.render(scene, camera);
}

setInterval(logic, 1000/60);
Creating each primitive shape is similar so instead of guiding you through each shape, here is a Table 4-1 shows the types of shapes. Do note that unless I specify otherwise, every parameter of the constructor is optional. Many of the geometries are based on PolyhedronGeometry, so the parameter detail is used to determine the amount of triangles are used to create the shape. Also remember that all constructors should be prepended with THREE.
Table 4-1. Showing geometries avaiable in Three.js
Name |
Constructor |
Notes |
|---|---|---|
CircleGeometry |
CircleGeometry (radius, segments, thetaStart, thetaLength) |
The theta parameters are used to create segments; by changing them you can specify a particular arc. |
ConvexGeometry |
ConvexGeometry (vertices) |
|
CubeGeometry |
CubeGeometry (width, height, depth, widthSegments, heightSegments, depthSegment) |
|
CylinderGeometry |
CylinderGeometry (radiusTop, radiusBottom, height, radiusSegments, heightSegments, openEnded) |
|
ExtrudeGeometry |
ExtrudeGeometry (shapes, options) |
There are many options for this one so I will go through them after this table. |
IcosahedronGeometry |
IcosahedronGeometry (radius, detail) |
|
LatheGeometry |
LatheGeometry (points, segments, phiStart, phiLength) |
|
OctahedronGeometry |
OctahedronGeometry (radius, detail) |
|
ParametricGeometry |
ParametricGeometry (parametricFunction, uSegments, ySegments, useTris) |
|
PlaneGeometry |
PlaneGeometry (width, height, widthSegments, heightSegments) |
|
PolyhedronGeometry |
PolyhedronGeometry (vertices, faces, radius, detail) |
|
RingGeometry |
RingGeometry (innerRadius, outerRadius, thetaSegments, phiSegments, thetaStart, thetaLength) |
|
ShapeGeometry |
ShapeGeometry (shapes, options) |
|
SphereGeometry |
SphereGeometry (radius, widthSegments, heightSegments, phiStart, phiLength, thetaStart, thetaLength) |
We have already been through spheres, but as with circles there are some extra options that may be useful occasionally. |
TetrahedronGeometry |
TetrahedronGeometry (radius, detail) |
|
TextGeometry |
TextGeometry (text, parameters) |
This is used to create 3D text, which I will go over later in the chapter. |
TorusGeometry |
TorusGeometry (radius, tube, radialSegments, tubularSegments, arc) |
|
TorusKnotGeometry |
TorusKnotGeometry (radius, tube, radialSegments, tubularSegments, p, q, heightScale) |
|
TubeGeometry |
TubeGeometry (path, segments, radius, radiusSegments, closed, debug) |
Extrusion
Most of these shapes will make sense to you; however ExtrudeGeometry is used differently and has many options. The purpose is to extend a shape, such as turning a 2D shape into 3D or building on one of the faces of a 3D shape. For this example we are going to start with some points as a path, which represent a basic 2D right-angled triangle, from which we will produce a 2D shape (that is, a plane created from the points in the path). With the shape created, we then need to extrude it to make into a prism.
![]() Note I have used a triangle for simplicity. Paths are usually used to create complex shapes.
Note I have used a triangle for simplicity. Paths are usually used to create complex shapes.
The path is an array of points that are created using 2D vectors (which represent the coordinates of a graph). Three.js provides a useful library for dealing with vectors, which makes it very simple to work out the distance between two points and similar functions. To turn the path into a shape, you can just pass the path to the THREE.Shape constructor as a parameter.
var path = [];
path.push( new THREE.Vector2 (   0,  50 ) );
path.push( new THREE.Vector2 (  50,  50 ) );
path.push( new THREE.Vector2 (  50,  0 ) );
var shape = new THREE.Shape( path );
As I mentioned earlier, ExtrudeGeometry has a lot of options for defining the type of extrusion that is needed as seen in Table 4-2.
Table 4-2. Showing the options avaiable for ExtrudeGeometry
curveSegments |
The number of points on the path, 12 by default. |
steps |
The amount of subdivisions within every extrusion. This defaults to 32. |
amount |
This is the amount of extrusions to make, basically the size of the shape, defaults to 100. |
bevelEnabled |
Enables bevel, which rounds the vertices that connect the edges of the extrusion to the faces of the shape. This is (true) by default. |
bevelThickness |
The thickness of the bevel, defaults to 6. |
bevelSize |
This is the distance from the edge that the bevel starts. It defaults to bevelThickness minus 2. |
bevelSegments |
The amount of segments of the bevel, similar to that of spheres in that it controls the quality of the bevel. Defaults to 3. |
extrudePath |
A particular path within the shape that should be extruded. |
frames |
This is an array of Frenet frames that expose the tangents, normal, and binormals of the spline. This is out of the scope of the book, but it defaults to generating the frames itself. |
material |
This is the material index for the front and back faces, it has no default. |
extrudeMaterial |
This is the material index for the extruded faces, it has no default. |
uvGenerator |
This allows you to specify the UV generator. By default it uses THREE.ExtrudeGeometry.WorldUVGenerator. |
![]() Note These options are subject to change, especially the defaults, between versions of the library.
Note These options are subject to change, especially the defaults, between versions of the library.
The code that follows creates an extruded geometry to show how the various settings can be used to produce a fairly complicated shape.
var extrusionSettings = {
  size: 30, height: 4, curveSegments: 3,
  bevelThickness: 1, bevelSize: 2, bevelEnabled: false,
  material: 0, extrudeMaterial: 1
};

var extrude = new THREE.ExtrudeGeometry( shape, extrusionSettings );
var extrudedShape = new THREE.Mesh( extrude, material );
scene.add(extrudedShape);
Now, you may look at this code, see what appears on your screen, and be a bit confused. It is meant to look like a triangle, don’t worry! It looks like that due to the viewpoint of the camera, so let’s make the shape rotate so that you can see it in all its 3D goodness. I quite like the effect of rotating on the x and y axes. It kind of gives a figure-eight motion, which is useful for seeing all sides of the shape. This code adds rotation to the shape:
function logic()  {
    extrudedShape.rotation.y += 0.05;
    extrudedShape.rotation.x += 0.05;
    requestAnimationFrame(render);
}
Figure 4-2 shows the extruded shape with the added rotation.
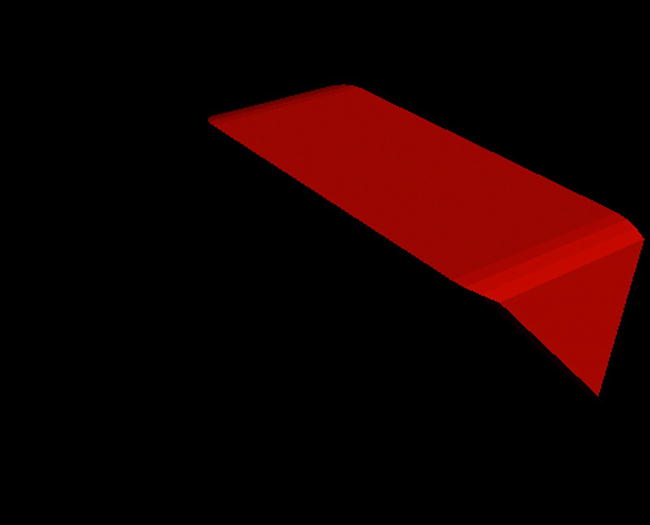
Figure 4-2. Extrusion
Text
There may be times when you need 3D text. It is not a common use case, but perhaps you are making something that feels like the titles of a movie or an advertisement. It is also something that many people do not realize is easily possible, so I would like to briefly take a look at it. The TextGeometry builds on the ExtrusionGeometry so it will be mostly familiar. Let’s create 3D text that says “Hello World!”—because everyone loves Hello World—that rotates in the same shape as our prism did to show how similar they are (and because I find the rotation very mesmerizing to look at).
![]() Caution By default, Three.js uses a font called Helvetiker (it is not a spelling mistake) that must be included or you should use a different font, otherwise there will be errors. This font can be downloaded from http://www.typeface.neocracy.org/ and is also included in the source code for this book.
Caution By default, Three.js uses a font called Helvetiker (it is not a spelling mistake) that must be included or you should use a different font, otherwise there will be errors. This font can be downloaded from http://www.typeface.neocracy.org/ and is also included in the source code for this book.
I am modifying the code we used for extrusion, so will be reusing the lighting and materials as well as the rest of the set up code. TextGeometry is no different than any other geometry, so it needs to be passed to a Mesh before it can be added to the scene; this probably seems obvious but I keep forgetting! Let’s start with the default text:
var text = new THREE.Mesh(new THREE.TextGeometry("Hello World!", {}), material);
scene.add(text);
There are a number of other options that we can use to customize the text as shown in Table 4-3.
Table 4-3. Showing the options avaiable for TextGeometry
size |
The size of the text, defaults to 150. |
height |
The thickness of the extruded text. The default is 50. |
curveSegments |
The number of points on the curve, defaults to 12. |
font |
The name of the font. The default is Helvetiker. |
weight |
This is the font weight. It can be any valid CSS font-weight, such as normal and bold. The default is normal. |
style |
As with weight, style allows any valid CSS font-style, such as normal and italic. The default is normal. |
bevelEnabled |
Enables bevel, which rounds the vertices that connect the edges of the extrusion to the faces of the shape. This is false by default. |
bevelThickness |
The thickness of the bevel, defaults to 6. |
bevelSize |
This is the distance from the edge that the bevel starts; it defaults to bevelThickness minus 2. |
These options should be easy to understand because they are mostly from the CSS font options or from ExtrudedGeometry that we have already discussed. I will however show you a quick example of how these options can be used:
var options = {
  size: 20,
  height: 20,
  bevelEnabled: true,
  bevelThickness: 25
};

var text = new THREE.Mesh(new THREE.TextGeometry("Hello World!", options), material);
scene.add(text);
As you can see, it is quite easy to add text if you think of it as just another shape.
Lighting
Lighting is the one thing that I find really “sets the scene” (if you will pardon my pun) because the entire scene depends on the lighting for what will show (and what will be shadows, which is equally important) as well as the general ambience. Just like in a film, lighting can be used to completely change how the user feels. I will not get into user experience design, but it is worth remembering and thinking about!
![]() Note Because the lighting is dependent on the material of the object, you need to make sure the material is set up correctly. This will be explained in the next section, but for now make sure to use either MeshLambertMaterial or MeshPongMaterial because they are set up to work with lights.
Note Because the lighting is dependent on the material of the object, you need to make sure the material is set up correctly. This will be explained in the next section, but for now make sure to use either MeshLambertMaterial or MeshPongMaterial because they are set up to work with lights.
I am going to go through some of the more commonly used types of lighting; of course there are others and you can create your own, some of which we may touch on briefly later. Each type of light has a number of properties and parameters, though some have more than others, here are a few that you should be familiar with:
- Intensity: The intensity of a light is how bright it is, the number can range from 0 to 1, where 1 is the actual color of the light and 0 is invisible (as if it is turned off). The default is usually 1. Some lights do not have intensity (at least at the time of writing) but you can always mimic it by multiplying each RGB color by an intensity variable.
- Hex: This is a color that must be in the form of hex (such as white being 0xffffff). Usually this defaults to white.
- Shadows: There are quite a few properties about shadows, such as whether the light casts shadows. I discuss these once I have explained each type of light.
Throughout the chapter we have been using a DirectionalLight as the only light source in the scene. As I explained earlier, a DirectionalLight is a light source that is cast in a particular direction and affects every object in that direction regardless of distance from the source. I should also remind you what I said earlier about DirectionalLight not having an actual position as such, instead the position that you set is the location from which it directs the light to the origin of the scene. The syntax for DirectionalLight is
THREE.DirectionalLight (hex, intensity)
A PointLight on the other hand emits light in all directions but the effect on the objects can differ depending on the distance from the source if a distance is set. When the distance is set to 0 (which it is by default), then the light will affect all objects like DirectionalLights do. The syntax for PointLight is
THREE.PointLight (hex, intensity, distance)
There is another light, called a SpotLight, which can be used like a DirectionalLight but can be controlled much more precisely. One difference between SpotLight and DirectionalLight is angles. With a DirectionalLight the light emits in the general direction, whereas a SpotLight emits the light directionally within a specified angle (that defaults to pi/2). It also can cover a specified distance like the PointLight. You can usually use the other two lights if you want to just light a scene, but if you want to carefully direct the lighting, then this is the ideal light source. The syntax for SpotLight is
THREE.SpotLight (hex, intensity, distance, angle, exponent)
I mentioned about lighting causing an ambience. There is a light just for that called, as you might expect, AmbientLight. This light affects every object in the scene that can be affected by a light source. Because it is used to enhance the lighting, it should only be used with other lighting. The syntax for AmbientLight is
THREE.AmbientLight (hex)
You will probably find that the AmbientLight takes priority over all other lighting, and to fix that just change the intensity so that it is only a weak light (ambient). An example of changing intensity is
var light = new THREE.AmbientLight();
var intensity = 0.025;
scene.add(light);
light.color.setRGB( 20 * intensity, 0 * intensity, 255 * intensity );
Quite often you will want to know exactly what the lights are doing, where they are positioned, and the direction that the light is being cast. There are many ways to do this—you could use the console to look at the properties of each light but I would suggest something more graphical. For many of the lights, Three.js provides helper objects that show the direction using lines. If you have a DirectionalLight, then you can use a DirectionalLightHelper, which shows a dotted line in the direction it is pointing. You can change the type of line, such as color or dashes, by changing the material. Most of the lights also have helpers, such as the SpotLightHelper that can be used to show the angle of light.
Another way to see the light source is to create an object (such as a sphere) in the position of the light, which you can see here:
var lightDebug = new THREE.Mesh(new THREE.SphereGeometry(5), new THREE.MeshBasicMaterial());
lightDebug.position = light.position;
scene.add(lightDebug);
One way of using this version, which is what I prefer and I know many other people use the technique quite often, is to make the sphere quite small so that you can see it but it looks more like part of the animation rather than a debug mode.
Materials
You have seen a few materials used and mentioned, such as Phong, Lambert, and Basic—but what are they? Each type of material specifies the type of shading that is used. This is based on real-life materials and the differences between them, such as a plastic bottle appears different than a shiny can under the same lighting due to reflection, transparency, and so on. It is not possible to model the exact conditions we find in real life, but we can get quite close by modifying some properties and by using different shaders. At the time of writing, Three.js provides us with the built-in materials shown in Table 4-4.
Table 4-4. Showing the built-in materials avaiable in Three.js.
LineBasicMaterial |
The LineBasicMaterial is used to create straight lines that by default are white and 1px wide. |
LineDashedMaterial |
This is similar to the LineBasicMaterial but is used to create dashed lines that are useful for debugging (though not limited to it), as you know it is not meant to be part of the scene. |
MeshBasicMaterial |
Depending on the wireframe property (defaults to false), this material is used to either draw flat or wireframe faces and is not affected by lighting. It is commonplace to use this for wireframes over the other materials since it has the least overhead. It is also commonly used for applying textures (images). |
MeshDepthMaterial |
This material is used to show depth and it is usually used in post processing. |
MeshFaceMaterial |
Quite often a shape will require different materials on each side, MeshFaceMaterial is effectively an array of materials. |
MeshNormalMaterial |
This is a useful material, especially for prototyping, since it makes sure each face is has a distinctive color and does not require lighting. |
ParticleBasicMaterial |
This is the material used by particle systems. The color defaults to white. |
ShaderMaterial |
If you would like to write your own shader (which will not be covered in this book), then this is the material you can use. It provides properties for GLSL such as fragmentShader, vertexShader, and uniforms. |
There are two materials missing from Table 4-4, MeshLambertMaterial and MeshPhongMaterial. I will tackle these two separately from the list because they are somewhat similar and involve a lot of rendering techniques (too much for a list). We have already used Lambert as a generic 3D material but I didn’t explain what it is. The simple explanation of the difference between the two materials, according to the current Three.js documentation is
- Lambert: A material for non-shiny (Lambertian) surfaces, evaluated per vertex.
- Phong: A material for shiny surfaces, evaluated per pixel.
This is generally enough for you to decide which to use for each situation, but I feel a more complete understanding is important and so I will briefly explain the technical differences and encourage you to look into them in more detail.
In computer graphics there are two models—which can both be combined —that determine the shading of the object; these are illumination and shading. Illumination uses ambient, diffuse, and specular to display light reflected (or refracted) off (or through) a surface. The math for shading is complicated, because it cannot be reduced to components, basically it shades (that is, works out the brightness) the faces using either flat shading or interpolated. The MeshLambertMaterial uses Gourand shading and Lambert illumination and by default the illumination is performed at each vertex and then interpolated across the face. MeshPhongMaterial uses both Phong shading and Phong illumination models and by default the vertex normals are interpolated across the surface and illumination is performed at each pixel (or more correctly, texel).
![]() Note Three.js does not use perfect implementation of the algorithms, so if you are particularly interested in the mathematical models, then take that into consideration.
Note Three.js does not use perfect implementation of the algorithms, so if you are particularly interested in the mathematical models, then take that into consideration.
Data Visualizations
That’s enough documentation for now, let’s move on and make something useful. There are many types of data visualizations, from basic bar and pie charts to detailed globes and even models of solar systems. There are uses for all these, usually as a way to present the data to the public but also for data analysis. It is a vast subject area and so we will only be touching the surface of what you could visualize and how you could do it.
We could start anywhere, such as basic 3D graphics showing the government’s financial data but that will quickly get boring so let’s make a 3D node graph showing actors and actresses that have worked with each other (inspired by Six Degrees of Kevin Bacon). In this case, our nodes are the actors/actresses and the edges are films. I have provided some sample data as JSON to avoid the need to make you sign up to an API. This also means I can be more selective about the data because most of it is not needed.
3D Node Graph
Rather than jumping straight into using the data, it is best to instead just start with the graph. In this section all the nodes and edges will be random and it is entirely possible for two nodes to have multiple edges of the same edges. At this moment we needn’t worry about that (it becomes much easier to handle once we have the real data).
We start with the basic setup that all scenes have, this time using both directional and ambient lights so that each node (which we will represent using random-colored spheres) has a nice effect.
var width  = window.innerWidth,
height = window.innerHeight;

var container = document.querySelector('#container'),

var renderer = new THREE.WebGLRenderer();
renderer.setSize(width, height);
container.appendChild(renderer.domElement);

var VIEW_ANGLE = 45,
    NEAR = 0.1,
    FAR = 10000;
var camera =  new THREE.PerspectiveCamera(45, width / height, 1, 1000);
camera.position.z = 600;

var ambient = new THREE.AmbientLight( 0x050505, 2 );
directionalLight = new THREE.DirectionalLight( 0xffffff, 1 );
directionalLight.position.set( 2, 1.2, 10 ).normalize();

var scene = new THREE.Scene();
scene.add(ambient);
scene.add(directionalLight);
scene.add(camera);

// The rest of the code for this section will go here.

function logic()  {
  requestAnimationFrame(render);
}

function render() {
  renderer.render(scene, camera);
}

setInterval(logic, 1000/60);
You know how to make spheres and I am sure it would take you all of two seconds to work out how to position them randomly. However, what we need to do is randomly position spheres and we also need to randomly link them together with lines for edges. To do this, we have a Node object that stores the name and position and then generates the random edges. Because we are not currently using the data, the name defaults to “Random Node” and there is a getEdges() function that is accessed by the property edges that returns two random nodes to which to connect edges. To generate the random edges in getEdges we just need to multiply Math.random() by the amount of nodes, then round down (floor) because the indexes start from 0 not 1.
var amount_nodes = 20;

var Node = function() {
    name = "Random Node",
    position = new THREE.Vector3();

    function getEdges() {
        return [Math.floor(Math.random()*amount_nodes), Math.floor(Math.random()*amount_nodes) ];
    }

    return {
        name: name,
        edges: getEdges()
    }
}
To draw the graph we need three functions, one that draws a node and one that draws all of the edges of a node, we also need a function to draw the graph using the previous two functions. Let’s start with drawNode(n), we take the node as a parameter so we have easy access to the node object we just made. Within the function we create a sphere using the same technique taught earlier, with a Lambert material of a random color. The random color is surprisingly easy to do, since hex (such as 0xffffff) is treated the same as any other number (it is after all just a representation of a number to a different base), we can do math on it, in this cause multiplying it by a random number. To find the position we choose a random number that is within the boundaries of an area that we specify, the area is then subtracted from this number to keep the graph in the center.
function drawNode(n)  {
    var radius = 10,
        segments = 50,
        rings = 50;

    var node = new THREE.Mesh(
        var material = new THREE.MeshLambertMaterial( {  color: Math.random() * 0xffffff } );
        var draw_object = new THREE.Mesh(
        new THREE.SphereGeometry(
            radius,
            segments,
            rings),
        material);
    );

    var area = 300;
    node.position.x = Math.floor(Math.random() * (area * 2 + 1) - area);
    node.position.y = Math.floor(Math.random() * (area * 2 + 1) - area);
    node.position.z = Math.floor(Math.random() * (area * 2 + 1) - area);

    n.position = node.position;
    scene.add(node);
}
Now we have the nodes drawn to the scene and it is time to connect them with the edges. Because these edges are random, as I said earlier, it is likely that some will double up causing thicker lines. This will not happen once we have added the data because we can use it to check whether a line has already been made. As you know from ambient lights, to have opacity you need to set transparent to true, so I have done this in LineBasicMaterial because the edges would be overwhelming if they were 100% white and opaque. To work out where the lines should go, we need to loop through the node.edges (which we randomly generate when a new node is created) and create a geometry that has a vertex at the current node’s position and at the other node’s (nodes[node.edges[i]]) position. Once that is created, we simply make a new line using the geometry and then add it to the scene.
function drawEdges(node)  {
    var line_material = new THREE.LineBasicMaterial( { color: 0xffffff, transparent: true, opacity: 0.1, linewidth:0.5 } );
    for (var i = 0; i < node.edges.length; i++)  {
        var tmp_geo = new THREE.Geometry();
        tmp_geo.vertices.push(node.position);
        tmp_geo.vertices.push(nodes[node.edges[i]].position);
        var line = new THREE.Line( tmp_geo, line_material );
        scene.add(line);
    }
}
Lastly, to finish this part of the project we just need to draw the graph using the two functions we just wrote. You may have noticed we were using an array called nodes, the nodes are created within drawGraph(). The first part of the function loops through the amount of nodes (amount_nodes) and creates a new Node object within the array, which it then draws using drawNode(). The edges have to be drawn afterward in a separate loop since drawEdges()uses the array of nodes to see which edges connect.
var nodes = [];
drawGraph();
function drawGraph()  {
    // Draw nodes
    for (var i = 0; i < amount_nodes; i++)  {
        nodes[i] = new Node();
        drawNode(nodes[i]);
    }

    // Draw edges, has to be done once we have the nodes in place
    for (var i = 0; i < amount_nodes; i++)  {
        drawEdges(nodes[i]);
    }
}
If you now put it all together, it should show a nice 3D node graph of random colors that does not represent anything (see Figure 4-3). This is a good starting point for a variety of visualizations and it should make you feel comfortable using the tools (namely Three.js) to produce more than just a simple shape.
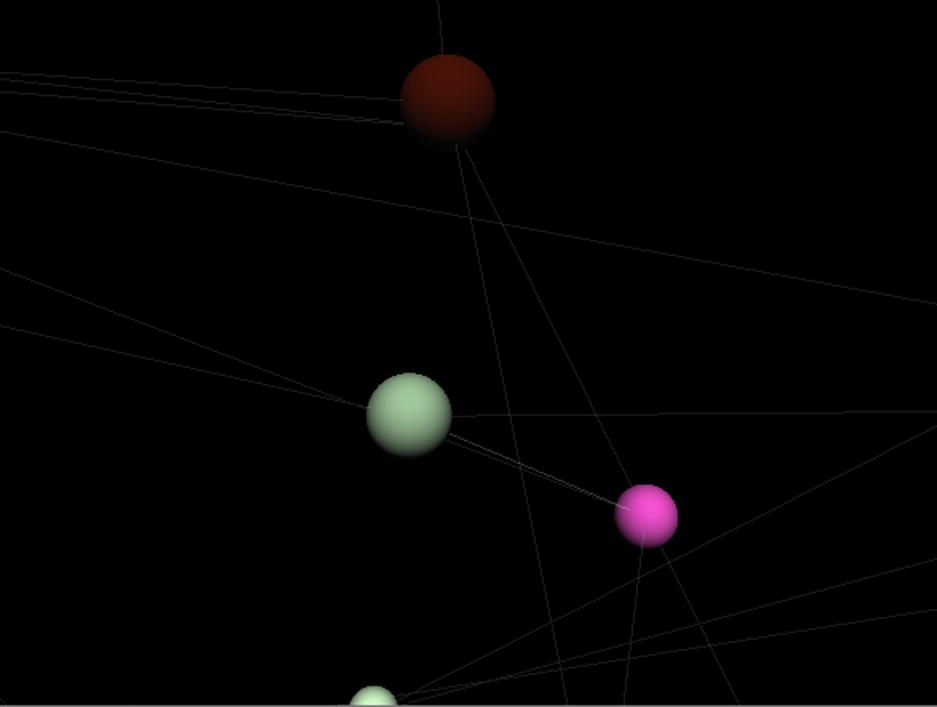
Figure 4-3. Node graph
I encourage you to fiddle with the code to make it your own. Here are a few ideas for how you can extend the graph:
- Use an API to visualize live data (Twitter, Government open data, etc.).
- Change size and/or color of the nodes based on the data.
- Add text overlays for hovering or clicking on the nodes and/or edges.
- Work on the navigation. It is hard to navigate a graph that has thousands of nodes. What works best—arrow keys? Mouse? Click to move? This is a good way to explore scale.
There are a lot of ways you could use the camera (some of which were explained earlier in the chapter) to navigate the graph. For now I have just been using the simple camera rotation technique, which is included in the code.
Adding Data
We have a node graph showing random nodes, it looks nice but there really isn’t any meaning behind it. I have created a JavaScript file called data.js (with JSON in a variable called data to make it easy to access) that includes four actors/actresses and three movies. We will be using this to create a tiny node graph that shows the movies as edges between the nodes of the actors/actresses. Although there is not much data, this should give you a good idea of how the graph can be used for data visualization. Here is the data we will be using:
var data = {
    "People": [
        {
            "Id" : 0,
            "Name": "Tom Cruise",
            "Films": [1, 2]
        },
        {
            "Id" : 1,
            "Name": "Morgan Freeman",
            "Films": [1,3,5]
        },
        {
            "Id" : 2,
            "Name": "Bruce Willis",
            "Films": [3, 4]
        },
        {
            "Id" : 3,
            "Name": "Mary-Louise Parker",
            "Films": [3]
        }
    ],

    "Films": [
        {
            "Id": 0,
            "Name": "Oblivion",
            "Cast": [0, 1]
        },
        {
            "Id": 1,
            "Name": "Mission: Impossible",
            "Cast": [0]
        },
        {
            "Id": 2,
            "Name": "RED",
            "Cast": [1, 2, 3]
        },
        {
            "Id": 3,
            "Name": "Die Hard",
            "Cast": [2]
        },
        {
            "Id": 4,
            "Name": "The Shawshank Redemption",
            "Cast": [1]
        }
    ]
}
To create the graph we use the code we previously created but need to modify it to read the data object so that it links between the actors/actresses based on films they have been in. Although it is probably more useful to show every connection, I decided that for this example it would be best to only show when they are connected rather than having a separate line for each movie. I did this by checking whether the node was already in the array of edges of the other node.
The main change between this code and the previous is thedrawGraph() function in which we now assign the people data to each node. Once the nodes are drawn, we need to go through each film and create edges in each node for every film by connecting each person to the person before them in the cast array, providing they have not already been connected.
drawGraph();
function drawGraph()  {
    var people = data["People"];
    var films = data["Films"];
    for (var i = 0; i < people.length; i++)  {
        nodes[i] = new Node();
        nodes[i].name = people[i].Name;
        nodes[i].films = people[i].Films;
        drawNode(nodes[i]);
    }

    for (var i = 0; i < films.length; i++)  {
        var cast = films[i]["Cast"];
        console.log(cast);
        if (cast.length > 1)  {
            for (var j = 1; j < cast.length; j++)  {
                if (nodes[cast[j-1]].edges.indexOf(cast[j]) == -1)  {
                    console.log(j)
                    console.log(nodes[cast[j-1]]);
                    nodes[cast[j-1]].edges.push(cast[j]);
                }
            }
        }
    }

    for (var i = 0; i < nodes.length; i++)  {
        drawEdges(nodes[i]);
    }
}
Finally, the name of the person that each node corresponds to should be shown. As we have already created a material for each node that gives a node its own color, we can use that to match the text color with the node. I’ve given the text a size and height (extrusion) of 10, but that is an arbitrary number that looked good—feel free to change it. Also, as I mentioned earlier, perhaps look into showing the text when a node has been clicked because as more nodes are added, the text will become harder to read. This should be added at the end of the drawNode function:
    var text_object = new THREE.Mesh(new THREE.TextGeometry(node.name, { size : 10, height: 10}), material);
    text_object.position.x = draw_object.position.x;
    text_object.position.y = draw_object.position.y;
    text_object.position.z = draw_object.position.z;
    scene.add(text_object);
Figure 4-4 shows the final outcome of this chapter, the node graph representing the data and showing the names alongside the nodes.
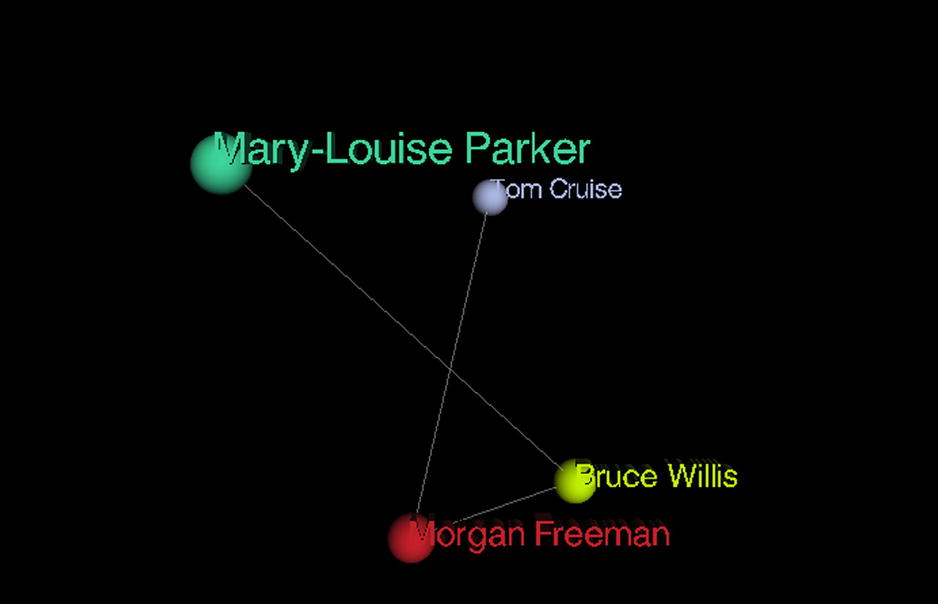
Figure 4-4. The final node graph representing the data
The entire code for this is available, as always, on either the Apress website at www.apress.com/9781430259442 or my own website at www.shanehudson.net/javascript-creativity.
Summary
In this chapter you have developed 3D skills from the basics of making an object appear to using it for data visualization. There is a wide variety of things you can do in just data visualization alone, let alone everything else you can do in a 3D world. Hopefully you now feel comfortable with Three.js. I encourage you to extend the examples in this chapter and to fiddle around with them, especially the node graph. In Chapter 5 we create music (or at least sound!) in the browser using the Web Audio API and SVG.