
The day before the planned sales process mapping session, Sam caught up with Bill in the company lunch room. “So Bill, are you ready for tomorrow’s sales process value stream mapping work session?” asked Sam.
“As ready as I’m going to be,” replied Bill.
“They say Toyota used to be able to sketch out their value stream maps on a napkin while at lunch. So what’s your basic sales process? Have you thought about that yet?” asked Sam.
“That’s the problem Sam, every customer is different, every buyer is different, and as a result, every sale is a bit different. I’m not sure we’ll be able to define our sales work as a process. Our process is so unique, it’s like magic how we close deals!” Bill said with a grin.
“It’s not magic. Every organization I’ve worked with claims to be unique or ‘special’ in some way, yet when we really look into it the core processes are very definable. I’ve helped a lot of sales teams with simplifying their sales process; what’s your basic sales process or steps?” Sam asked.
“Well first we have to find potential customers. To do this we do advertising, marketing, we have a website, we do cold calls; there are so many things we do to identify potential new clients,” stated Bill.
“For the sake of simplicity, let’s call all of that ‘Identifying potential new customers or clients,’ ” said Sam, as he grabbed a napkin and drew a box and labeled it accordingly. “What do you do next?” continued Sam.
“Well, after we identify a potential customer, we have to make contact with them,” said Bill.
“We’ll call that ‘Engaging potential new customer,’ ” said Sam, as he sketched another box and labeled it accordingly. “Then what?” continued Sam.
“Then we get to know the buyer, that’s where the magic starts. We have to know exactly what buttons to push, when to push, and when to stay away, this is what I call ‘Sales Savvy,’ ” indicated Bill.
“Give me a break Bill, this is simply developing a trusting relationship. Let’s call it that. What’s next?” said Sam.
“I’m serious, that’s a huge step, and not everyone does it the same. How can you standardize that?” asked Bill.
“Do some sales people do it better than others?” asked Sam.
“Yes, some of us have the ‘magic,’ and some don’t,” replied Bill.
“Stop calling it magic. If some people do it better than others, we can study their technique and develop basic standard work. In fact, I know this has been done already by many leading sales authors. Our customer relationship management (CRM) software is set up to help us do this better. I’m certain we can improve our process for relationship building, and train our sales people in a standardized approach to improve their techniques, and get better, more consistent results. Now let’s keep moving; what comes after developing a trusting relationship?” asked Sam.
“Well, once we’ve made contact and used our ‘magic’ to start building our relationship, we work to understand what the client’s needs are for our products,” replied Bill with a smirk.
“Okay, let’s call that ‘Discovering or Creating need,’ ” replied Sam, as he jotted more notes on his napkin. “Then what?” added Sam.
“That’s where some magic happens again; we then show and tell them how great our products and services are, and we work the magic to close a deal. In this phase we may do multiple quotes or proposals, negotiate, all in effort to close the deal. Closing the deal takes a special skill,” shared Bill.
“Again, I’ll bet some people do it better than others, and we can learn from them, but all that aside, the process step is really discovering the needs of the potential customer, and showing them how our products can help fill their need, solve a problem, or provide an improvement, rights? Let’s call this entire mess ‘Discovering Need and Advocating Solutions,’ ” said Sam, as he made and labeled another box on his napkin. “Is there anything else you do after closing the sale?” asked Sam.
“Yea, there’s tons of stuff we do after we close the deal. We complete the new sales order forms, we stay in the loop and keep the customer informed of how we are doing, and we communicate regularly with the client; we do tons of stuff. That’s why we need the big expense accounts,” said Bill with a grin.
“I’ll call it ‘Support.’ ” Sam said curtly, as he added a box and label to his napkin. As Sam finished he spun the napkin around so Bill could see it and said, “There you go, this value stream map sketch is a shell of the macro sales process. I call it a shell because it has no data or details. Usually, value stream maps differ from flow charts or diagrams because of the data and details they contain. The data and details are where teams ‘see the wastes.’ ”
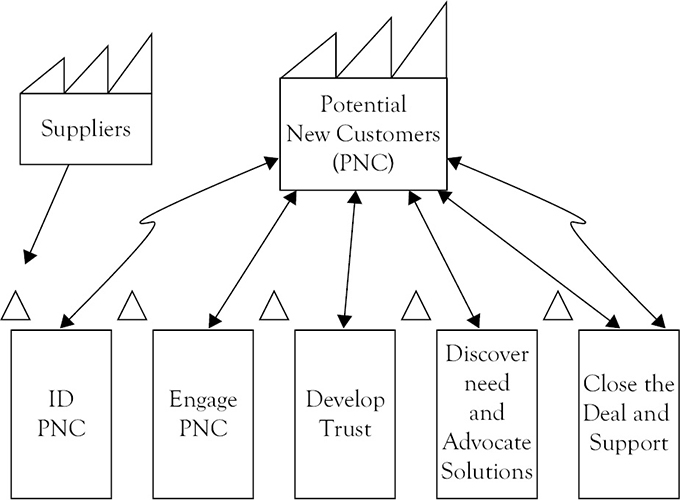
The basic outline of the macro sales process is as follows:
1. Identify potential new clients or customers
a. Tradeshows
b. Advertising
c. Website
2. Engage potential new customers
a. Arrange meeting with potential new customers
3. Developing a trusting relationship
a. CRM
b. Swimming with the sharks McKay
4. Discovering need and advocating solutions
a. Dialog
b. Questions
c. Helping customer solve problems
d. Counselor selling
e. Conflict management
5. Supporting direction or decisions
a. Customer service
b. Order entry and processing
Sam continued, “Now, there are several subprocesses within each of these macro sales process boxes. You and your team can use this sketch to discover where the most waste is or the poorest flow, or the greatest need for improvement, the map data and details should point you in the right direction. Once the major opportunities are identified, the team can ‘drill down’ and develop sub process maps as needed to discover wastes in the sub processes. This is where the team will learn what Lean tools may apply to the help improve the process. For starters, I think there is quite a bit of standard work development in the macro sale process. Maybe you could start there, and have your team address improvements at the subprocess level. When you get to your session tomorrow, let’s start with this map and use it to facilitate discussion, and action planning. Now I’d say you’re ready for the value stream mapping work session tomorrow. You can thank me later. I have to run. See you tomorrow.” Sam said as he passed the marked up napkin to Bill, stood up, pushed his chair in and left the lunch room.
Bill sat there a bit staring at the napkin. He thought to himself, “Wow, this really makes sense.” Bill finished his lunch, grabbed the napkin, and left for his office.
At his office, Bill began his preparation for the value stream mapping work session. He studied some of his Lean Sigma material and discovered where some basic Lean Sigma tools would apply to each of the macro sales processes. The greatest need was for standardized work in the macro value stream. Bill made note of this and finished his preparation for the work session.
In addition to Sam, a cross-section of people from Bill’s on-site sales team were invited to attend the sales value stream mapping work session. The on-site team consisted of direct sales, inside sales, and customer service. Those attending the meeting are as follows:
• Bill, the sales manager and session leader.
• Tammy, Jason, and Mary representing direct sales.
• Pat and Deb representing inside sales.
• Jack and Amy representing customer service leaders.
• Julie, Sandy, and Tom representing customer service reps.
• Sam, the supply chain manager.
Bill started the two-hour work session right on time, and shared the following agenda with the team.
Sales Process Improvement Work Session 1 Agenda
1. Overview
2. Macro sales process value map
3. Opportunity identification and prioritization
4. Action planning and next steps
5. Close
Bill welcomed everyone to the meeting, and explained why Sam was also attending. He indicated that Sam would serve as their “internal consultant.” Bill got the group right to work, and made a large sketch of the shell of the macro sales value stream on the white board in a way that took up most of the board. Bill explained to the team that he wanted to use the Lean Sigma approach to improving their sales processes, and the first step was to further develop the macro sales process value stream map. To do this, the team had to populate the map shell with the data and details needed to “see the waste.” Once the team clearly sees the wastes, and opportunities, they can begin to implement improvements.
Since all value stream maps begin and end with the customer, Bill began the group discussion by asking about the customer demands in term of new customers and orders processed per day, week, month, and year. As the group discussed the volume of new orders, and customers they discovered that there is quite a bit of variation in the volume of sales process transactions per day. Sam indicated that this is not all that unusual for a sales process, and encouraged the team to document the variation in the value map issues and opportunity log, and move on. Bill made the appropriate notes on the customer icon, and issues and opportunity log, and moved on to the identify potential new clients or customers process box.
Bill asked the team to think about typical value stream map process box metrics, such as Cycle Time (C/T), Change Over Time (C/O), Up Time (U/T), Quality Yield (Q), and the like, but to consider what these mean in the sales world. Also, while considering each process box, Bill wanted to capture all the subprocesses they used to complete the work for the macro process box, as well as issues, problems, and opportunities that they already know about because they actually do the work. With that Bill prompted discussion; “Tammy, you’re the best I know at finding new customers, what exactly do you do to find a new customer?” asked Bill.
“Well, it’s pretty straight-forward, since much of our products go directly to large retail stores, and distributors, and most of those are very well known, those accounts are basically maintenance or support accounts. To find new customers I focus on niche or boutique markets; you know, the small guys out there selling our blenders. To find them I sometimes will look search the web for specialty shops in a specific market,” remarked Tammy.
Pat chimed in, “Yeah, that works, but the accounts are so small they hardly leave a dent in the overall sales numbers. I swing for the fences, and only look for accounts over $250,000 potential.”
“That may explain why Tammy always wins in new customers landed, and you usually do well in sales dollars. That’s why we developed the bonus around new sales dollars, and new customers,” added Bill.
“Yeah, I’ve been meaning to talk to you about that,” added Pat with a pause, and the group laughed.
Tammy interrupted the laughter, and said, “But did you know that the small accounts make up over 20 percent of our revenue?”
“Right!” added Jack from customer service, “and they take up to 80 percent of our time!”
Bill said, “Those are all good points. Let me make note of them in the process box and issues and opportunity log,” and he did so.
“Okay, let’s keep it moving.” Bill said as he continued to facilitate the meeting.
Bill progresses process box by process box asking for the key data and details regarding the process steps, subprocesses, and known issues and opportunities.
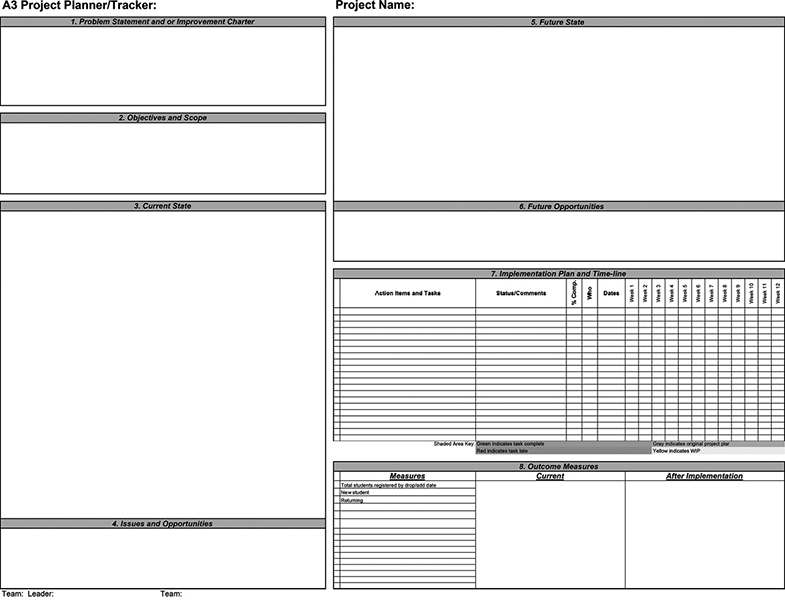
With about five minutes left in the work session, Bill summarized the discussion, and moved on to discuss the next steps. Sam spoke up at this point and indicated that Bill should use the company A3 format to document the teams overall progress. Bill agreed that he would take responsibility for the macro map A3. The team agreed that they may need some additional training in A3’s, but Sam assured them that they are very straightforward.
What Is the A3?
The A3 Report is designed to help you “tell the story” in a logical and visual way as well as be the road map for improvement and problem solving initiatives. The A3 (Report) is the size for 11 inch × 17 inch paper that is common in just about every copier made. It can be used for displaying and structuring a problem solving or continuous improvement project from beginning to end, displaying a storyboard, or be used for a report-out or briefing. It was originally developed by Toyota to simply represent a problem or improvement initiative on a one-page simple and common format.
There are typically multiple steps (i.e., categories or sections) for an A3; however, there may be more or less of them depending on how the project is structured. Keep in the mind the overall purpose for this tool is to efficiently display all the relevant information on one page (Desktop and Tablet screen) in a logical sequence as well as be a road map for your project. Relevant data or information should be represented on the A3, however, if the information does not fit, additional sheets may be used and referenced on the A3. Many times it is used to help employees “think” Lean.
The power in the A3 Report for problem solving and continuous improvement is that it provides a consistent approach (methodology) for learning and applying the Lean Six Sigma tools. It is very simple and is typically organized as a series of boxes in a template which will assist to structure your problem solving or continuous improvement process.
Or
Source: MCS Media.
At this point the macro sales value stream map (shown below) was populated with a significant amount of data. The team also had some additional data to track down, and these needs were documented on the issues and opportunities log. However, even with the map only populated with 70–80 percent of the details, the team could see the wastes and flow inhibitors coming to the surface. Together the team prioritized the next steps and made an action plan with assignments.
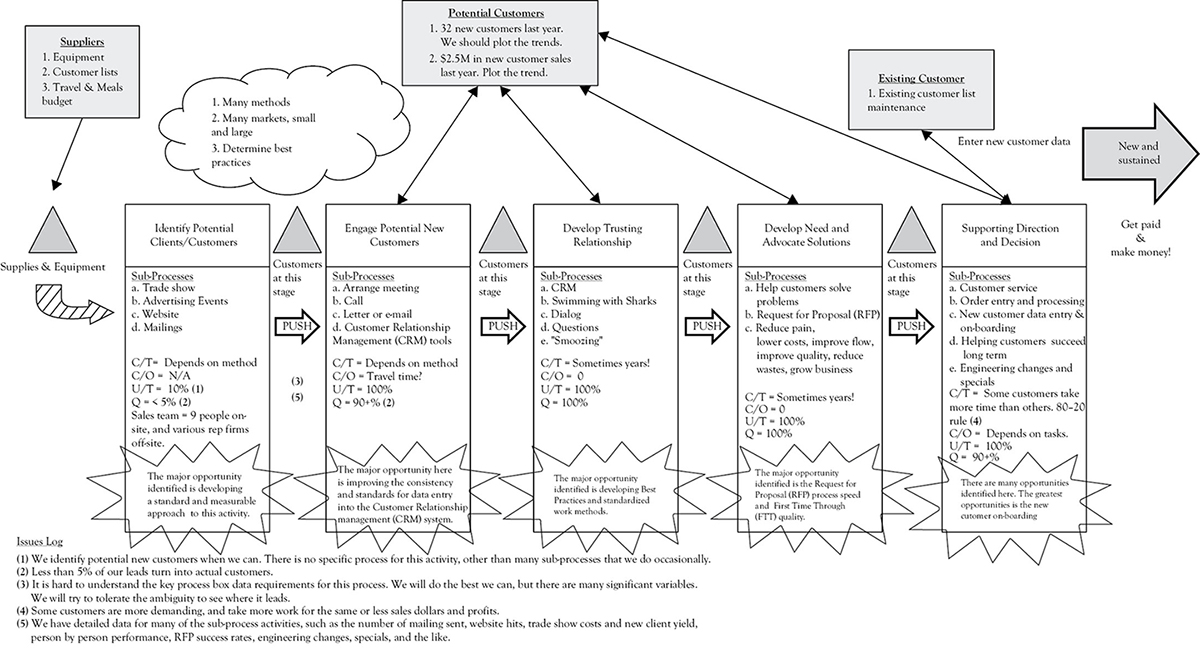
Macro Sales Pipeline CSM
Bill documented the priorities by area as the team agreed on them. The completed priority list is shown as follows:
Macro Map Opportunities Priorities:
1. The major opportunity identified in the identifying potential clients and customers process is developing a standard and measurable approach to this activity.
2. The major opportunity in the engaging potential new customers area is improving the consistency and standards for data entry into the CRM system.
3. The major opportunity identified in the developing a trusting relationship are developing best practices and standardized work methods.
4. The major opportunity identified in the develop need and advocate solutions are the request for proposal (RFP) process speed and first time through (FTT) quality.
5. There are many opportunities identified in the supporting direction and decision area. The greatest opportunity is the new customer on-boarding process.
Sam suggested the team break into smaller focus groups to work on improvements in each of the five major sales process areas. The team agreed, and Bill split up the work between the team members, identified area leaders, and made assignments. Each of the five teams would initiate their own A3 to document and track their progress. Bill asked each area leader to recruit their own team to address improvements. Bill also asked Sam for additional support in kicking off the five project teams, and Sam agreed. The team assignments are as follows.
|
Identifying potential clients and customers |
Co-leaders |
Tammy and Deb |
|
Engaging potential new customers |
Co-leaders |
Jason and Pat |
|
Developing a trusting relationship |
Co-leaders |
Mary and Sandy |
|
Develop need and advocate solutions |
Co-leaders |
Jack and Julie |
|
Supporting direction and decision |
Co-leaders |
Amy and Tom |
Bill asked if there were any questions, and there were not. Then Bill kicked the proverbial “sleeping dog” and said that he’d like the preliminary work sessions and A3’s completed in two weeks.
“Two weeks!” Jack said as he tossed his pen on the table. “I’ve got proposals to deliver, a customer visit next week, and then Simon in accounting wants to review the Blue water account. I can’t commit to two weeks. I’m not even sure we need this in our area. This is a manufacturing tool, not a sales tool. I think we are just wasting time,” Jack added.
“I hear what you’re saying Jack with regard to the workload, and maybe we can get you some help there, but our company and I are committed to applying Lean Sigma tools in all areas. As I understand it, Lean Sigma methods and tools are simply ways to improve processes, and we have processes in sales, or at least we should!” replied Bill, as Jack sat visibly frustrated.
Turing to Sam, Bill asked, “Sam, any comments or words of encouragement here?”
Sam spoke up saying, “We see this quite often, where people feel the pressure of getting their regular work done and initiating a Lean Sigma effort. Once the Lean Sigma effort is in full swing, it actually becomes the way you work, and will get easier. The key is to start. Is there a timeline you could commit to Jack?”
“I don’t know, at least three weeks for me to get to this,” replied Jack.
“Okay, can everyone else get to this in two weeks?” asked Sam, and everyone indicated they could. Sam continued; “So two weeks for the kick-off session and A3 drafts, and three weeks for Jack’s team,” Jack still was not happy, and sat quietly.
Bill adjourned the session and the team filed out. After everyone left, Bill looked at Sam, and said, “What was that all about? First Mary on the metrics, now Jack on the projects, Mary’s probably upset as well.”
Sam grinned and said, “Stay the course Bill, they will thank you for it later. Leadership takes clear vision—stay the course friend.” The two men stood, Bill shook his head, as Sam patted him on the shoulder, and they walked out of the conference room.
Discussion Questions
1. Evaluate the conversation between Sam and Bill prior to the two-hour work session. Was this conversation beneficial for Bill in identifying the basic sales process?
2. What do you think of the macro sales process developed by Sam? Do you think it is applicable to your organization? Why or why not?
3. Evaluate the sales process work session conducted by Bill. Was it productive and why? What can you learn from it?
4. Discuss the A3 report for problem solving and continuous improvement? Have you used this report? If yes, what has your experience been? If not, do you see a value in your organization using it?
5. What do you think of the process used by Bill in identifying and implementing the priority list? Explain.