
Lean Sigma Methods and Tools: Basic Concepts
The joint supplier and Rapid Products Lean Sigma or Rapid Improvement Event (RIE) event began with introductions and expectations. During the introductions, Bill noticed that the SM from their supplier was attending the Lean Sigma RIE sessions, and made a note to catch up with him to pick his brain about Lean Sigma methods and tools for sales processes.
The planned agenda for the three-day event is shown as follows.
Day 1
1. Welcome and introductions.
2. Review logistics of the RIE.
3. Review objectives of the RIE.
4. Conduct Lean Sigma overview training.
5. Review any baseline measurements and key performance indicators.
6. Data collection and subsequent analysis as required.
7. Complete next day planning.
Day 2
1. Complete process and data analysis.
2. Develop proposed improvements.
3. Identify potential roadblocks to improvements.
4. Implement improvement trials.
5. Communicate with others who are affected.
6. Address potential roadblocks.
7. Complete next day planning.
Day 3
1. Run final trials.
2. Implement final improvements.
3. Develop standard work documents.
4. Conduct training as required.
5. Create open items list.
6. Identify plan for the future.
7. Prepare a management report and lessons learned wrap up.
8. Conclude the RIE.
RIEs are sometimes called Kaizen events. RIEs are characterized by the following.
Rapid Improvement Events
RIEs, sometimes called “Kaizen” events or “Kaizen Blitzes,” are targeted events conducted by improvement teams to implement improvements quickly, in a specific area. Teams use RIEs to implement significant improvements in a relatively short time-frame. Depending on the scope of the improvement targeted, RIEs can last anywhere from one to two hours to three to five days.
RIEs are used instead of slower, incremental changes in the following circumstances.
Circumstances for RIEs
• Improvement needs are urgent or at crisis levels.
• The area being addressed is continually in use by the organization, and taking the area out of service can only be tolerated for a short duration.
• Only a short duration of training and facilitation can be afforded due to time or financial constraints.
• There is a very narrow area of focus.
As with any improvement event, RIEs take preplanning, execution, and post-event follow-up to be successful. A typical RIE planning and execution flow is as follows. Use these to assist with leading a successful RIE.
RIE Planning and Execution Flow
A. Management actions (at least two weeks before RIE)
1. Select an area, process, or product related to the Project Charter for rapid improvement.
2. Map the current state value stream.
3. Assess opportunities and needs with current state measurement and analytical Lean Sigma tools.
4. Establish short-term RIE improvement measures and goals.
5. Select a facilitator or leader.
6. Set the RIE date(s).
B. Facilitator actions (two weeks before the RIE)
1. Inform the area or group leader.
2. Coordinate the RIE with the planner and/or scheduler.
3. Invite outside participants if required.
C. Facilitator and team actions (one week before the RIE)
1. Create or obtain current flow chart of the process to improve.
2. Obtain current state or base-line measurements.
3. Communicate and obtain alignment on RIE objectives.
4. Start a log of NVA activities in the area to address.
D. Facilitator actions (pre-RIE)
1. Create RIE work session agendas and timelines.
2. Arrange RIE facilities and amenities.
E. RIE Day(s)
1. Provide Lean Sigma overview training and RIE orientation.
2. Implement improvements using plan, do, check, act (PDCA) process.
3. Document open item action plans and follow up plan.
4. Report out as required.
F. Facilitator (one week after the RIE)
1. Follow-up on open item action plans.
G. Management (one month after RIE)
1. Audit process improvements to goals.
Source: Ptacek and Motwani.
Rapid Products’s senior buyer Jim Coval facilitated the RIE, and provided Lean Sigma overview and refresher training for the group. This information was still fresh in Bill’s mind from the Supplier Day session the previous week. Jim also provided a detailed explanation of the 12 wastes as noted in the following.
Twelve Forms of Waste: The Dirty Dozen
Lean Sigma tools and concepts assist employees (and customers in service processes) in identifying and eliminating all types of waste. It is critical that employees have a fundamental knowledge and understanding of waste in order to identify and eliminate it. The purpose of Lean Sigma practices is to identify, analyze, and eliminate all sources of process inefficiency.
The following table was a handout Bill received in the Supplier Day Lean Sigma training session. The table summarizes the 12 wastes with examples.
The Dirty Dozen: Twelve Forms of Waste
|
Form |
Description |
Examples |
Ways to eliminate |
|
Overproduction |
More than is required is made or served |
• E-mailing, faxing the same document multiple times • Ineffective meetings |
• Take time • Proof of need survey • Make to order |
|
Expertise |
Underutilization due to placement of people into positions where their knowledge, skills, and abilities aren’t used to the fullest |
• Workloads not being completed due to lack of cross-training • Assigning employees two jobs due to understaffing |
• Standard work • Lean Sigma file system • Business case for Lean Sigma • Office quick-starts |
|
Transport |
Any transport of files, information, or materials |
• Delivering unneeded documents • Updating customer records in different systems |
• 5S • Value stream mapping • Standard work • Lean Sigma file system • Visual controls • Co-location of workers |
|
Inventory |
Excessive piles of paperwork, computer files, supplies, and time spent searching for documents |
• Files awaiting signatures or approvals • Keeping multiple copies of reports |
• 5S • Value stream mapping • Standard work • Lean Sigma file system • Kanbans for office supplies • Level loading-heijunka |
|
Motion |
Any movement of people, paper, and/or electronic exchanges that does not add value |
• Hand carrying paper to another process • Using an excessive number of transaction screens to support decision making |
• Standard work • New office layout • Kanbans for office supplies • Pull systems and supermarkets |
|
Corrections |
All processing required in creating a defect and the additional work required to correct it |
• Data entry errors • Not having integrated IT systems |
• Standard work • Lean Sigma file system • Visual controls • Mistake proofing |
|
Overprocessing |
Putting more work or effort than required into the work requested by internal or external customers |
• Duplicative reports or information • Constantly revising documents • Excessive approvals |
• Standard work • Lean Sigma file system • Data collection techniques • Document tagging |
|
Waiting |
Waiting for anything (people, signatures, information, etc.) |
• Excessive signatures or approvals • Delay in feedback from high-level management • Waiting for a meeting to make a decision |
• Value stream mapping • 5S • Lean Sigma file system • Runners • Pitch • Standard work • Scoreboards |
|
Overload |
Overburdening or overloading a work system, machine, or process |
• An 18 person bus carrying 25 people • A new contract requiring 80 additional hours of work and not enough staff to complete the work |
• Standard work • One piece flow • Statistical analysis • Work load balancing |
|
Unevenness |
Lack of consistent flow of inputs/information/scheduled work from upstream processes causing many of the other types of waste previously mentioned |
• Scheduling all work to be completed at the end of the month and not during the month at even intervals • Poor office processes for locating documents when a staff member is on leave |
• 5S • Value stream mapping • Standard work • Work load balancing |
|
Environmental |
Any waste that is generated by a service organization that impacts the environment, whether it is heat, solid, liquid, or gas |
• Paper or plastic used in a cafeteria that isn’t recycled • Unnecessary use of power when machines and equipment aren’t in use |
• Reduce, reuse, recycle • Sustainability or green metrics |
|
Social |
Waste from the other areas of society, such as poverty, discrimination, malpractice, health and injuries, nutrition, literacy and education, and also waste on account of social media networking |
• Time spent by employees at work socializing • Advertising products on social networking sites that are not read by target audience |
• PDCA • Sustainability metrics • Performance/gap analysis |
Bill thought about where these wastes could be present in the sales department, and made the following notes.
1 of 12. The Waste of Overproduction
Producing some type of work prior to it being required is waste of overproduction. Providing a service above and beyond what is needed is also considered overproduction. Overproduction is when too much of something is made or served. This is the greatest of all the wastes. Overproduction of work or services can cause other wastes. For example, by preparing extra copies of a report, you are using extra paper, extra time to handle the reports, and extra motion and transportation to dispose of the reports, and so on. Activities without direct immediate purpose should be eliminated or reconfigured, unless they are already understood as essential to a perfect process.
2 of 12. The Waste of Expertise
The underutilization of people’s expertise is a result of not placing people where they can (and will) use their knowledge, skills, and abilities to the fullest providing value-added work and services. An effective performance management system will reduce this waste significantly. Use company policies and procedures to effectively place people where they will most benefit the organization.
3 of 12. The Waste of Transport
Excess transport affects the time of delivery of any work within an office. Even with Internet and e-mail readily available, too often, or not often enough, documents (i.e., files) that provide little or no value are moved downstream regardless of need. Reducing or eliminating excess transport waste is important. Locating all work in sequential process operations and as physically close together as possible will help eliminate or reduce this waste. Transport between processes that cannot be eliminated should be automated as much as possible. Ask questions such as: “Is the office layout optimal?,” “Is the release and request for work automated?,” and “Is IT aware of the problem and can they help?”
4 of 12. The Waste of Inventory
Excessive piles of paperwork, computer files, supplies, and time spent searching for a document is waste. They all take up space or require someone’s time. If a document is waiting for additional information (i.e., signature, review, approval, etc.) and there is a change, then the time the document has been waiting is waste. There are basically two types of inventory waste related to administrative areas: (1) office supplies and (2) information.
5 of 12. The Waste of Motion
Any movement of people that does not add value is waste. This waste is created by poor office layout or design, faulty or outdated office equipment, supply inaccessibility, and movement of information or data that does not add value. The waste of motion is insidious and is hidden in service procedures that have not been reviewed for continuous improvement initiatives. Regardless of the industry, motion waste may appear as someone who is looking “busy” but not adding value to the work or service. Lean Sigma tools will assist to identify, reduce, or eliminate this waste.
6 of 12. The Waste of Corrections
Correction waste refers to all processing required in creating a defect or mistake and the additional work required to correct a defect. Defects (either internal or external) result in additional administrative processing that will add no value to the product or service. It takes less time to do work correctly the first time than the time it would take to do it over. Rework and corrections are wastes and add more costs to any product or service for which the customer will not pay. This waste can reduce profits significantly.
7 of 12. The Waste of Overprocessing
Putting more work or effort into the work required by internal or external customers is waste. Excessive processing does not add value for the customer and the customer will not pay for it. This is one of the most difficult administrative wastes to uncover. Some questions to ask to assist in the identification of this waste are: “What are the most basic processes required to meet the customer needs?” or “Is there a clear understanding of the customer’s needs?”
8 of 12. The Waste of Waiting
Waiting for anything (people, signatures, information, etc.) is waste. This waste of waiting is “low hanging fruit,” which is easy to reach and ripe for the taking. We often do not think of paper sitting in an in-basket or an unread e-mail as waste. However, when looking for the item (document or e-mail), how many times do we mull through that in-basket or the Inbox and try to find it? How many times do you actually touch something before it is completed? It is the finish it, file it, or throw it away system that can help eliminate this waste. This waste is closely related to “wasting time.”
9 of 12. The Waste of Overload
The overburdening or overloading of a work system or process typically causes other wastes to occur. Overload must be handled as a separate waste as it can be identified easily during the value mapping process, and is often expressed in terms of capacities of equipment or people. Usually this waste causes a great sense of frustration and aggravation for customers and employees, and often leads to other wastes and loss sales.
10 of 12. The Waste of Unevenness
Lack of a consistent flow of inputs, information, or scheduled work from upstream processes causes many of the other types of waste previously mentioned. Unevenness such as traffic jams, loading and unloading rental car busses, lunch-hour rushes, and the like create special needs for organizations wanting to provide the highest level of service.
11 of 12. Environmental Waste
As organizations become more sustainable or “Green,” they have to make extra efforts to protect the environmental resources as they are becoming very scarce. Any waste that is generated by an organization that impacts the environment, whether it is, heat, solid, liquid, or gas is classified as environmental waste. These items can be observed in an organization’s trash containers and dumpsters.
12 of 12. Social Waste
Social waste is another category of waste that sales organizations need to focus on if they wish to become more sustainable. The term social waste is broad and includes areas such as poverty, discrimination, malpractices, health and injuries, nutrition, literacy and education, and also waste on account of social media networking. When people who are supposed to be working are using their social media when not allowed, or when an organization is not capitalizing on the use of social media applications where appropriate. Bill felt this was a key opportunity for his sales teams.
Bill knew that each of the 12 wastes existed for his sales organization, and recalled the leading waste questions identified in Supplier Day session noted in the following:
1. Where is waste causing us to spend excess time, resources, and money?
2. How can I communicate these wastes throughout the organization?
3. What are some of the obvious wastes (low-hanging fruit)?
4. What can be done to immediately improve customer satisfaction?
Bill thought he’d use these questions to stimulate people and promote more open communications regarding waste and continuous improvements in the sales areas.
As a learning exercise, the RIE team completed a virtual waste walk on the following Lean Sigma Service Excellence “Waste Walk” form. The form can be used by teams or individuals to identify waste in their work environments. Simply take the form into the work environment, and look for a waste or two in each of the “Dirty Dozen” waste categories. This exercise develops a deeper understanding for waste, and may provide a starting point for an initial project. At a minimum, the results will stimulate discussion, learning, and waste observation. Bill thought about how he could use this form to help teach his sales team about wastes and continuous improvement opportunities.
Lean Sigma Service Excellence Waste Walk Checklist
|
Types of waste |
Waste observations |
|
Overproduction |
|
|
Producing more material or information than is needed or used |
|
|
Expertise |
|
|
Not using people’s minds and getting them involved |
|
|
Transport |
|
|
Moving tools and materials to the point of use |
|
|
Inventory |
|
|
Materials or information. This includes all work in process and finished goods |
|
|
Motion |
|
|
Movement of people. This includes walking or riding, as well as smaller movements |
|
|
Corrections |
|
|
This includes rework or fixing of products or information that is wrong the first time |
|
|
Overprocessing |
|
|
This includes work above and beyond the minimum requirements or needs |
|
|
Waiting |
|
|
This includes any time delayed or waiting for materials, information, or people |
|
|
Overload |
|
|
This is when workload is too much and machines break, and people burnout |
|
|
Unevenness |
|
|
This is when workload varies from slow to fast uncontrollably |
|
|
Environmental |
|
|
This includes pollution and other wastes of the environment |
|
|
Social |
|
|
This is waste that impacts social issues |
|
Jim provided the following outline about Lean Sigma methods and tools. Bill thought that this outline would also help his sales team understand how to apply Lean Sigma in the sales area.
Lean Sigma Methods
The Lean Sigma methods used for Lean Sigma transformations include a systematic approach or steps to initiate improvement in an organization. The systematic approach is defined at three levels of engagement. Each level must use the PDCA improvement process.
Leadership Level:
• Develop Lean Sigma understanding and commitment for organization leaders.
• Develop and communicate Lean Sigma Strategy to the organization.
• Develop and deploy a tactical plan to transform the organization into a Lean Sigma enterprise.
• Set, align, and communicate measureable goals and rewards to sustain and support the Lean Sigma enterprise and thinking.
• Conduct regular organizational performance reviews.
Project, Systems, or Team Level:
Use the define-measure-analyze-improve-control (DMAIC) improvement process. The DMAIC improvement process phases are defined as follows:
• Define the project scope, resources, and objectives.
• Measure the current state process key performance measures drivers, capabilities, flows, and outcomes.
• Analyze the current state process data to identify and prioritize improvement opportunities.
• Improve the process by applying Lean Sigma improvement tools and techniques.
• Control the process so that the improvements are sustainable.
Worker Level:
1. Implement a housekeeping and visual control effort at all worksite(s).
2. Conduct hourly or daily mini-experiments to improve processes.
By engaging at these three levels, an organization can truly begin to transform their culture to a continuous improvement-driven environment.
Lean Sigma Tools
Bill reviewed the following Lean Sigma Tool Application Chart distributed during the session.
The following Lean Sigma Tool Application Grid is not all inclusive. It covers the Lean Sigma tools identified in the applications chart. These tools are found to be the most applicable for organizations. Not all Lean Sigma tools will work the same in every environment. Lean Sigma tools that apply directly in a mass production manufacturing environment apply to a service environment, but might not be a direct fit. Just as one would not use a screwdriver to loosen a hex-head bolt, not every Lean Sigma tool will apply to every environment and culture. The savvy Lean Sigma practitioner will identify the key applicable Lean Sigma tools, and apply them as needed.
Bill thought the Lean Sigma overview training would never end and he was glad to get on to the working portion of the RIE. The first step was to review the data gathered on the customer phone order process, which is the target process to improve for this RIE. The following data represent data collected during the previous three-week period. This data collection was part of the pre-event preparation.
The value added (VA) versus nonvalue added (NVA) analysis is used to illuminate the waste in a process. Once the process steps are documented, VA and NVA times can be measured and placed into a simple data table to compare the VA content to NVA time content. When conducting time studies, do not be overly concerned with whether the time is from the fastest or slowest person. Take as accurate measurements as can be obtained, and document them. If there is concern regarding the relative speed of an individual, simply document the concern in the Opportunity Log as a concern. The fact that there is variation may be an opportunity for making improvements to the standards.
The following table is an example of a VA versus NVA analysis for a customer phone order process.
DMAIC Alphabetical Tool Application Chart
|
Lean Sigma tools |
Lean Sigma improvement phases |
|||||
|
Define |
Measure |
Analyze |
Improve |
Control |
||
|
1 |
5Ss |
|
|
|
X |
X |
|
2 |
5-Whys |
|
X |
X |
|
|
|
4 |
Cause and effect diagrams |
X |
X |
X |
|
|
|
5 |
Check sheets |
|
X |
|
|
X |
|
6 |
Constraint or Bottleneck analysis |
|
X |
X |
|
|
|
7 |
Cross-training to develop worker flexibility |
|
|
|
X |
X |
|
8 |
Flow, process, Swim lane, or value stream maps |
X |
X |
X |
X |
|
|
10 |
Frequency charts |
|
X |
|
|
X |
|
11 |
Future state flow maps |
|
|
|
X |
|
|
12 |
Histograms |
|
X |
X |
X |
X |
|
15 |
Key metric data profiles |
|
X |
X |
|
X |
|
16 |
Leveling service flow, pull signals (kanbans), and paced work flow (Heijunka) |
|
|
|
X |
X |
|
17 |
Mass customization |
|
|
|
X |
|
|
18 |
Mistake proofing (Poka yoke) |
|
|
|
X |
X |
|
20 |
Pareto and pie charts |
|
X |
X |
|
X |
|
21 |
Performance management and improvement |
|
|
|
X |
X |
|
22 |
Plan–Do–Check–Act process |
|
X |
X |
X |
X |
|
23 |
Problem solving—Corrective and preventative actions |
|
X |
X |
X |
X |
|
26 |
Quality function deployment (QFD) |
X |
X |
|
|
|
|
27 |
Queue time |
|
X |
X |
X |
X |
|
28 |
Radar chart |
|
X |
X |
|
X |
|
29 |
Rapid improvement events |
|
|
|
X |
|
|
30 |
Run and control charts |
|
X |
X |
|
X |
|
31 |
Scatter plots |
|
|
X |
|
|
|
32 |
Spreadsheets and pivot tables |
|
X |
X |
|
X |
|
33 |
Standard work for leaders |
|
|
X |
X |
X |
|
34 |
Standardized work |
|
|
X |
X |
X |
|
35 |
Statistical process controls |
|
X |
X |
|
X |
|
37 |
Supplier/Input > Process > Output/Customer (SIPOC) |
X |
X |
X |
|
|
|
38 |
Talk time, predictive selling or service rate analysis |
|
X |
X |
X |
|
|
39 |
Value-added versus non-value-added analysis |
|
X |
X |
X |
|
|
40 |
Visual controls |
|
|
|
X |
X |
|
41 |
Visual management and performance scoreboards |
|
X |
X |
X |
X |
|
42 |
Voice of the customer (VOC) |
X |
X |
|
|
X |
Source: Ptacek and Motwani.
Customer Phone Order Process Data
|
Process step |
Process name |
Type |
Begin time |
Operation time |
End time |
Value add? |
Value add total |
|
1 |
Answer phone |
Process |
0:00 |
0:00:25 |
0:00:25 |
Yes |
0:00:25 |
|
2 |
Ask for customer information |
Process |
0:00 |
0:00:40 |
0:01:05 |
Yes |
0:01:05 |
|
3 |
Does customer have account |
Process |
0:01 |
0:00:05 |
0:01:10 |
Yes |
0:01:10 |
|
4 |
Place on hold and forward |
Transport |
0:01 |
0:01:15 |
0:02:25 |
No |
0:01:10 |
|
5 |
Ask for customer information |
Process |
0:02 |
0:00:20 |
0:02:45 |
No |
0:01:10 |
|
6 |
Take information for credit app |
Process |
0:02 |
0:03:45 |
0:06:30 |
Yes |
0:04:55 |
|
7 |
Wait for credit approval |
Delay |
0:06 |
0:06:05 |
0:12:35 |
No |
0:04:55 |
|
8 |
Approved? |
Decision |
0:12 |
0:00:00 |
0:12:35 |
Yes |
0:04:55 |
|
9 |
Ask for customer information |
Process |
0:12 |
0:00:40 |
0:13:15 |
No |
0:04:55 |
|
10 |
Does customer have account |
Process |
0:13 |
0:00:05 |
0:13:20 |
No |
0:04:55 |
|
11 |
Determine product needs |
Process |
0:13 |
0:01:30 |
0:14:50 |
Yes |
0:06:25 |
|
12 |
Is product on hand? |
Process |
0:14 |
0:00:15 |
0:15:05 |
No |
0:06:25 |
|
13 |
Check system for lead time |
Process |
0:15 |
0:00:10 |
0:15:15 |
No |
0:06:25 |
|
14 |
Quote lead time to customer |
Process |
0:15 |
0:00:05 |
0:15:20 |
No |
0:06:25 |
|
15 |
Is lead time acceptable? |
Process |
0:15 |
0:00:00 |
0:15:20 |
No |
0:06:25 |
|
16 |
Contact operations for LT information |
Process |
0:15 |
0:07:35 |
0:22:55 |
No |
0:06:25 |
|
17 |
Is lead time acceptable? |
Process |
0:22 |
0:00:00 |
0:22:55 |
No |
0:06:25 |
|
18 |
Place order |
Process |
0:22 |
0:01:45 |
0:24:40 |
Yes |
0:08:10 |
|
19 |
Validate customer ship info |
Inspect |
0:24 |
0:00:30 |
0:25:10 |
No |
0:08:10 |
|
20 |
Thank customer |
Process |
0:25 |
0:00:10 |
0:25:20 |
Yes |
0:08:20 |
With the VA and NVA time table completed, various charts can be constructed to illuminate the waste, and identify opportunities for improvement. The VA to NVA comparison charts subsequently are for the previous VA versus NVA table.
|
Summary |
|
|
Value-added time |
0:08:20 |
|
Total time |
0:25:20 |
|
% Non-value added |
67% |
|
% Value added |
33% |
|
|
|
|
Process type breakdown |
|
|
Process time |
0:17:30 |
|
Delay time |
0:06:05 |
|
Transport time |
0:01:15 |
|
Inspection time |
0:00:30 |
These data can be plotted in a simple chart for more visual impact. The visual impact helps the improvement team “see” the opportunities.
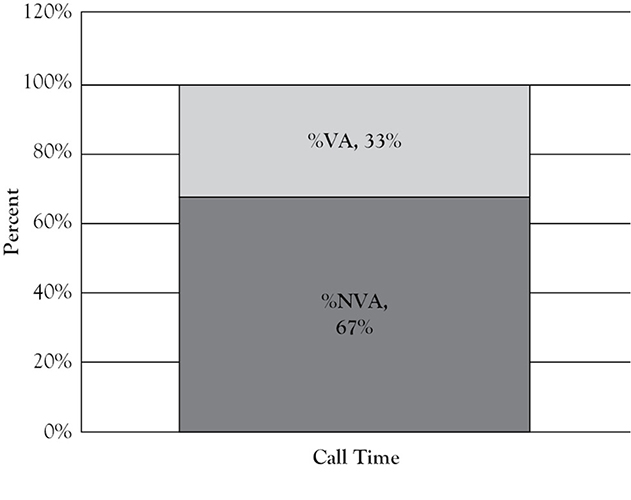
VA and NVA stacked bar chart
With this data documented, Jim conducted a brief training session on VSMs, and developed the following current state map (CSM) and flow diagram for Rapid Products’s phone ordering process which was the target improvement area for this RIE.
Bill noted similarities and differences between the value stream map and the flow diagram. The value stream map groups process steps in value-added groups, while the flow diagram more closely follows the tabular data as indicated by the previous VA versus NVA Analysis table.
It is common to construct both a value stream map and a flow diagram to thoroughly analyze the processes being improved upon. However, this is not always the case. The value stream map and process flow diagram assist to visually illustrate the constraints relative to the entire process flow.
By reviewing the flow diagram or the value stream map, it can be seen that there are three basic loops in the customer phone order process flow. The three process loops are as follows:
1. The standard product loop is for a customer who has an account and the product is on hand.
2. The credit approval loop is for the customer who needs to apply for credit and the product is on hand.
3. The lead time info loop is for the customer who does not require credit approval and the product is not on hand.
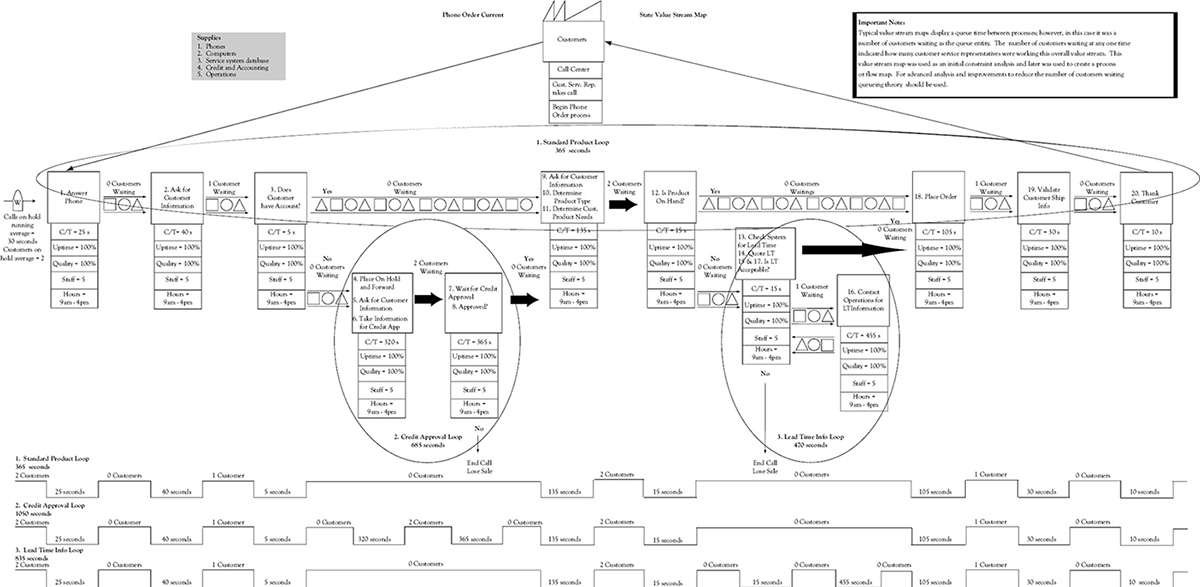
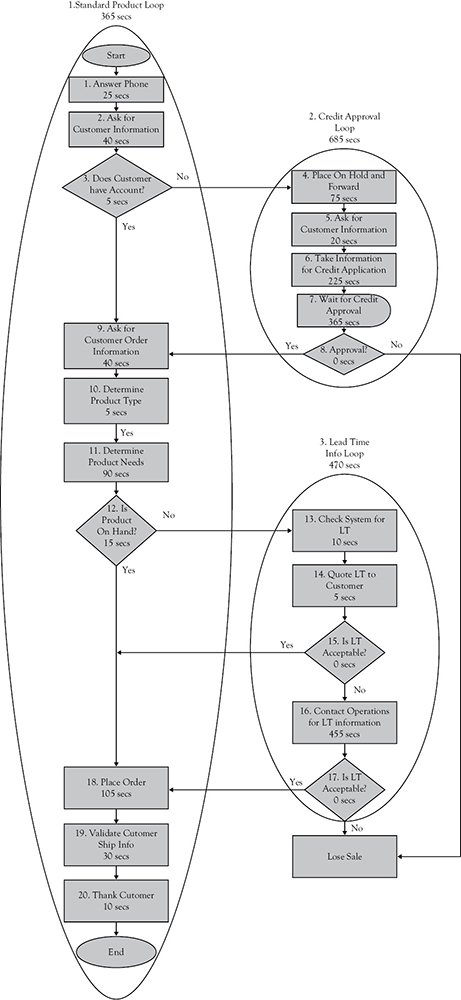
Phone Order Current
Each loop has a constraint operation. For the standard product loop (1) the constraint is “Place Order” (Step 18) at 105 seconds. For the credit approval loop (2) the constraints are “Wait for Credit Approval” (Step 7) at 365 seconds and “Take Information for Credit App” (Step 6) at 225 seconds. For the lead time info loop (3) the constraint is “Contacting Operations for LT Information” (Step 16) at 455 seconds.
By following the flow of any given order, the time for the longest operation becomes the constraint. The improvement team agreed to focus their improvement initiatives on the constraints in each process loop.
This process was refreshing for Bill, as he could begin to understand how the Lean Sigma tool of mapping and flow charting could help him define the sales process, and better understand the constraints and improvement targets for the process. He was excited to think about applying this tool to the sales process.
The phone order value stream map and flow diagram were very useful for the joint RIE team. As a result of using these tools, the improvement team came up with the following improvement opportunities:
1. Standardize the credit approval process so that up to 90 percent of credit requests can be computed by the customer service representative rather than having to call the credit department. Target time reduction is 15 percent of current state. For this improvement idea, standards for credit approval were established and posted on the organization’s intranet. As customers request credit approval, customer service representatives will collect the critical credit approval information and review the data versus the credit approval standards on the intranet. It was found that many credit approval requests met the standard criteria and could be handled in this manner. If further the request fell outside the standard requirements, the customer was then transferred to the Credit Department for further analysis. This standardization improvement project still enabled the Credit Department to maintain control of the credit approval parameters, yet have most of the actual credit approval review completed by Customer Service.
2. Standardize the special lead time request process so that customer service representative can resolve up to 80 percent of the special lead time requests of customers. Target time reduction is 10 percent of current state. For this improvement idea, standard lead time tables were established for most of the organization’s product lines. Lead time standards were determined by analyzing specific Bill of Material typical lead times and processing time. The proposed standard lead times were posted on the organization’s intranet system where customer service representative could access them. For items that fell outside the standard guidelines, or where a customer could not accept the improved lead-time, the customer service representative would call operations. This lead time improvement standardization project required operations to establish weekly lead time guidelines.
3. Implement pull signals on more standard items and standard materials, to ensure product availability. The target here is to have up to 80 percent of standard items in a supermarket inventory system. By holding supermarkets of key raw materials, operations could produce to order faster and reduce lead times. Simple pull signals were implemented in the raw material area. In the finished goods area, an analysis of annual usage and seasonality by model was completed. The organization developed a schedule for putting pull cards in place that would better match the seasonality of product demand. By following the standard schedule for supermarket pull cards, the organization was able to minimize their inventories.
The rest of the RIE days would be spend implementing the improvement ideas, and documenting a path forward for improvements. Near the end of the first day, Bill finally had a chance to catch up with the supplier’s sales manager. Bill introduced himself to Ray, and they hit it off very well. It seems sales people are cut from the same cloth.
Discussion Questions
1. Do your organizations host Rapid Improvement Events (RIE)? Do you find them beneficial? What are your thoughts about the RIE flow presented?
2. By means of examples, please explain the Twelve Forms of Waste. Which of these wastes do you encounter most often? Why do you think it is critical for the management of every organization to identify the different waste using the Waste Walk Checklist?
3. Why is it important that a Lean transformation be conducted at three levels?
4. Identify the similarities and differences between the value stream map and the flow diagram. What has been your experience with these diagrams? What do you think of Bill’s approach toward them?
5. Evaluate the process and opportunities followed and identified by the improvement team? Do you think they have made good progress?