
Observability is something that we need in order to troubleshoot, debug, monitor, benchmark, and optimize our serverless applications. With the many distributed components that make up a serverless application, we need a way to track the performance of a single transaction throughout the system. This gets really hard when the compute we get from Lambda is so ephemeral, and when functions can be chained with asynchronous or parallel invocations. Observability can encompass event logging, metrics, and tracing. We've already covered a lot of logging and metrics so far, so let's dig into options for traceability.
Most third-party Application Performance Management (APM) tools rely on an agent or daemon being present on the host that is running the application. With Lambda, you can't easily install such a thing and there's also no compute that can happen in the background.
Each execution of a Lambda function sends logs to CloudWatch Logs, which is good, because we can find a request ID and some execution timings. We can also code into our function to log a correlation or transaction ID so that we can line up the logs from all the other components to get a picture of a single transaction. Hopefully, our APM can get all the necessary source data from these logs.
To get even more information about our function executions, we could use AWS X-Ray. X-Ray is a service that is really good for digging deeper into the execution of a function to help diagnose where valuable execution time is being spent. It works by listening to trace statements that you send to the X-Ray API from within your function. From there, the service puts a nice service graph visualization together so that you can see all of the services and downstream resources that your function is calling, as well as their timings.
The following is a screenshot of the X-Ray console and shows a trace of a transaction moving through a distributed serverless solution:

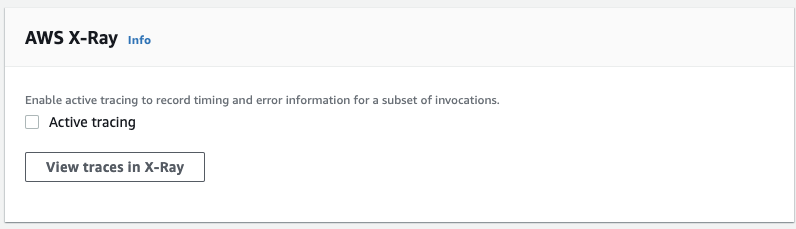
You can enable X-Ray tracing in your Lambda function by simply ticking a box. You'll find this in the function configuration section. This will only create traces for the function's execution and won't follow any external calls that are made by the function code during execution:
It's likely that you'll also need to add permissions for accessing X-Ray to the execution role attached to your Lambda. The actions that you will need to allow are as follows:
"xray:PutTraceSegments",
"xray:PutTelemetryRecords"
It's also possible to enable X-Ray tracing if you are deploying functions via CloudFormation. Here is a snippet for a Lambda function that has X-Ray tracing enabled. Add this to the properties block of your function declaration:
Properties:
  TracingConfig:
    Mode: Active
Finally, if you are using the Serverless Framework, you can enable X-Ray tracing in serverless.yml. Here's an example function configuration:
functions:
  helloWorld:
    handler: handler.helloWorld
    tracing: Active
I mentioned earlier that these methods would enable tracing of the function execution statistics, but wouldn't continue to trace any requests that are made to external HTTP endpoints or other AWS services. For this, we need to use the AWS X-Ray SDK within our function execution and specifically configure the components we want to trace. There are two SDK method calls that we are interested in for this:
- XRay.captureHTTPs(): Wraps our HTTP requests to capture request and response information
- XRay.captureAWS(): Wraps calls to AWS services that are made by the AWS SDK
We use these methods to wrap around our normal downstream requests so that they can capture the communication information and ship the metrics off to X-Ray. Let's have a look at how to implement these in a Node.js function:
- First, we need to install the AWS X-Ray SDK in our development environment:
npm install aws-xray-sdk --save
- Then, in our function code, we include the SDK:
const XRay = require('aws-xray-sdk');
- Then, we set the configuration. This wraps our standard HTTP and AWS SDK calls with the capture methods. You can substitute other libraries for your HTTP calls if you wish:
const AWS = XRay.captureAWS(require('aws-sdk'));
const http = XRay.captureHTTPs(require('http'));
- Alternatively, we can get more specific trace information from individual AWS services by wrapping the call in a captureAWSClient() method. For example, we can use the following code to wrap a DynamoDB call. This would automatically include richer information about the tables that are accessed:
const ddb = XRay.captureAWSClient(new AWS.DynamoDB());
- Then, we can simply use the SDK calls that we are used to using to, for example, put an item in a DynamoDB table:
ddb.putItem({
  'TableName': tableName,
  'Item': item
}, (err, data) => {
  if (err) { console.log("Error", err); }
  else { console.log("Success", data); }
});
These are the most basic steps for enabling tracing in our Lambda function code. There are many more options for tracing using other sources and services. Check the developer guide for a wealth of information; a link to this can be found in the Further reading section.
This leads us back to our own development principles and practices. We now know how to run Lambda functions in production, and in the next section, we will look to improve the way we write functions.