25 Debugging techniques
In the previous chapter, we talked about how to handle bad situations (errors and exceptions) but specifically the bad situations that you were expecting. There’s another type of bad situation that can happen as your scripts become more and more complex. These situations, that we’ve alluded to already, are called bugs. These are the side effects of a long night scripting, or lack of coffee in the morning. In other words, they’re the side effects of us being human. We all make mistakes, and this chapter will be focused on some techniques on how to find and squash the bugs in your scripts.
NOTE We’ll be diving into some of the features that the PowerShell extension for Visual Studio Code has to offer, so if you need a refresher on how to get set up, be sure to go back to chapter 2 and follow the steps there.
25.1 Output everything
Without diving too deep into Azure Pipelines concepts, the script in listing 25.1 will get details about published artifacts we care about and download them to the Temp drive. If you’ve never heard the term artifact before, it’s basically a file that has been published somewhere other tools can download it. Additionally, you’ll notice some environment variables in the script (prefixed with $env:). This is because the script was written to be run inside of Azure Pipelines where these artifacts exist.
Let’s start with something familiar from chapter 17 where we talked about the different output streams. The different streams are tools in your toolbox for understanding what your code is doing and when it’s doing it. Thoughtful placing of Write-* statements can make it easy to find the bug in your scripts and get you back on track. We won’t cover this topic too much since we already dedicated chapter 17 to input and output, but the following listing provides an example of when something like Write-Debug would come in handy.
Listing 25.1 A piece of VS Code’s publishing script modified for learning purposes
$BUILDS_API_URL =
➥ "$env:SYSTEM_COLLECTIONURI$env:SYSTEM_TEAMPROJECT/_apis/build/builds/
➥ $env:BUILD_BUILDID"

function Get-PipelineArtifact {
    param($Name)
    try {
        Write-Debug "Getting pipeline artifact for: $Name"
        $res = Invoke-RestMethod "$BUILDS_API_URL)artifacts?api-version=6.0"
      ➥ -Headers @{
            Authorization = "Bearer $env:SYSTEM_ACCESSTOKEN"
        } -MaximumRetryCount 5 -RetryIntervalSec 1

        if (!$res) {
            Write-Debug 'We did not receive a response from the Azure
          ➥ Pipelines builds API.'
            return
        }

        $res.value | Where-Object { $_.name -Like $Name }
    } catch {
        Write-Warning $_
    }
}

# Determine which stages we care about
$stages = @(
    if ($env:VSCODE_BUILD_STAGE_WINDOWS -eq 'True') { 'Windows' }
    if ($env:VSCODE_BUILD_STAGE_LINUX -eq 'True') { 'Linux' }
    if ($env:VSCODE_BUILD_STAGE_OSX -eq 'True') { 'macOS' }
)
Write-Debug "Running on the following stages: $stages"

Write-Host 'Starting...' -ForegroundColor Green
$stages | ForEach-Object {
    $artifacts = Get-PipelineArtifact -Name "vscode-$_"

    foreach ($artifact in $artifacts) {
        $artifactName = $artifact.name
        $artifactUrl = $artifact.resource.downloadUrl
        Write-Debug "Downloading artifact from $artifactUrl to Temp:/$artifactName.zip"
        Invoke-RestMethod $artifactUrl -OutFile "Temp:/$artifactName.zip"
      ➥ -Headers @{
            Authorization = "Bearer $env:SYSTEM_ACCESSTOKEN"
        } -MaximumRetryCount 5 -RetryIntervalSec 1  | Out-Null

        Expand-Archive -Path "Temp:/$artifactName.zip" -DestinationPath
      ➥ 'Temp:/' | Out-Null
    }
}
Write-Host 'Done!' -ForegroundColor Green
Now, let’s say you run this script and it doesn’t work the way you are expecting it to work. One of the simplest ways to debug a script is to run the script, asking it to show the debug stream. Let’s do a comparison.
Running the script normally produces
This is not very informative. However, all we have to do is set our debug preference to Continue, and we can see the contents of the debug stream:
PS > $DebugPreference = 'Continue'
PS > ./publishing.ps1
Starting...
DEBUG: Running on the following stages: Windows Linux
DEBUG: Getting pipeline artifact for: vscode-Windows
DEBUG: Downloading artifact from <redacted> to Temp:/vscode-windows-
➥ release.zip
DEBUG: Getting pipeline artifact for: vscode-Linux
DEBUG: Downloading artifact from <redacted> to Temp:/vscode-linux-release.zip
Done!
This is more useful information. It ran for Windows and Linux . . . but wait, wasn’t it supposed to also run for macOS?
$stages = @(
    if ($env:VSCODE_BUILD_STAGE_WINDOWS -eq 'True') { 'Windows' }
    if ($env:VSCODE_BUILD_STAGE_LINUX -eq 'True') { 'Linux' }
    if ($env:VSCODE_BUILD_STAGE_OSX -eq 'True') { 'macOS' }
)
Do you see the bug? I’ll wait a second. Got it? A few years ago, Apple changed the name of their operating system from OSX to macOS, and it looks like the script wasn’t completely updated properly because it’s still referencing VSCODE_BUILD_STAGE_OSX instead of VSCODE_BUILD_STAGE_MACOS. That first debug statement says that it’s running only Windows and Linux, so that’s our hint that something is wrong around there.
Debugging like this is often used in an environment that can’t be made interactive. Azure Pipelines and GitHub Actions are great examples of environments like this where you don’t have the ability to remote into the container or VM that your script is running in, so your only debugging option is to leverage PowerShell’s streams to give you as much information as possible. This type of debugging is also useful if you have the ability to run scripts on your local machine or in a container/VM that you have access to, but there are complementary solutions as well that we’ll get into now.
25.2 One line at a time
Debugging using PowerShell’s streams is “debugging the past,” as you are looking at what has already happened. Debugging this way is useful but can be tedious because you have to wait to see what shows up in these streams before you take action. If you don’t have enough information in the debug stream, you have to make a change to add more information to the debug stream, which requires you to run your script over and over again. If you’re trying to debug an issue that happens only 30 minutes into your script running, that means any change you make (even if it’s just to get more information) will take 30 minutes to verify. Thankfully, the PowerShell team has several ways to cut down on the time spent debugging. The first of these tactics is what we like to call F8 debugging or line-by-line debugging.
The premise is simple. Let’s take a large script and run it line by line in our console. It sounds like it could be tedious to copy and paste each line, but the PowerShell extension for VS Code streamlines this experience. Let’s start with a basic script to demonstrate:
Go ahead and create a test.ps1 file with the code above, and open it in VS Code. Next, click on the first line (the Write-Host) so that the cursor is on line 1 (figure 25.1).

Figure 25.1 Visual Studio Code with our script. The Run and Run Selection buttons in the top-right corner are highlighted.
We highlight two buttons in the screen’s top-right corner. If you hover over these, they say Run and Run Selection (F8), respectively. The Run button will run your entire script, but we’ll come back to why that button is special. For now, let’s focus on the other one. In fact, with the cursor on line 1, let’s click the Run Selection (F8) button and see what happens. The PowerShell extension will take the current line your cursor is on and run that snippet in the PowerShell Integrated Console in figure 25.2.

The Run Selection button will run any snippet that you have selected, as shown in figure 25.2, or it will run the current line if you have nothing selected. Select some of the lines and click the Run Selection button. You’ll notice that it will run exactly what you’ve selected.
Try it now If you haven’t done so yet, run the last two lines (either by selecting both of them or one at a time), and you’ll see something similar to the following output:
PS > $processName = 'pwsh'
Get-Process $processName

 NPM(K)    PM(M)      WS(M)     CPU(s)      Id  SI ProcessName
 ------    -----      -----     ------      --  -- -----------
      0     0.00      40.48      17.77    5286 ...85 pwsh
      0     0.00      11.27      11.49   29257 ...57 pwsh
      0     0.00      13.94       3.32   32501 ...01 pwsh
      0     0.00     131.63     461.71   35051 ...51 pwsh
      0     0.00     121.53      19.31   35996 ...96 pwsh
Here is where it gets interesting. Click inside of the PowerShell Integrated Console, and then run $processName in it. You’ll see that the value we set in our script has persisted inside of the PowerShell Integrated Console. This means that we can run a script line by line and see the entire state of the script as it’s happening, giving us more visibility into exactly what our script is doing. This means that we can debug our script faster because we are able to get an overview of what’s happening and when it’s happening as it’s happening.
Note We call this F8 debugging because Run Selection is bound to the F8 key in VS Code, so you can just press F8 instead of having to click the button in the top right.
You were able to see the value of the variable $processName in your console, but you can take this a step further and set the value to something else whenever you’d like. For example, set $processName to code* in your console (figure 25.3), and then use Run Selection to run line 3 (the Get-Process).

Notice that the output is no longer the result of pwsh but instead is the result of code*. This blurs the line between the script in your editor and your console, which can be very useful when you want to see if your script handles different inputs correctly. With that said, keep track of any changes you make because you don’t want a manually set variable to cause other issues in your script. If your PowerShell Integrated Console is ever in a bad state and you want to restart it, open the Command Palette using Ctrl+Shift+P on Windows or Linux or Cmd+Shift+P on macOS and type PowerShell: Restart Current Session and run that. This will give you a clean slate (a fresh PowerShell instance) that you can use.
The preceding example is simple, and the strategy itself is simple. Here’s the usual workflow that we use:
-
If your script has parameters, set the values to those in the PowerShell Integrated Console ahead of time to simulate running the script with those parameter values.
-
Select the first line or part of your script that you are fairly certain doesn’t have the issue in it; then press F8.
-
Dig around. Run the important variables in the console to see what their values are. You can also run functions in the console that you use to see what they return.
-
Found what looks off? Make the change to the script you think needs to be made and go back to number 1.
By adopting this strategy, you will gain confidence in debugging your PowerShell scripts and those of others as well (as we talked about in chapter 23). This is a necessary skill in any workplace because when push comes to shove, you will have scripts break and you will have to roll up your sleeves and fix them.
25.3 Hey, script, stop right there . . . with breakpoints
F8 debugging is sufficient for debugging scripts interactively, and you could stop here in this chapter and do well for yourself. But we want to really prepare you for what you might see in the real world. To do that, we want to talk about a third type of debugging, which we call breakpoint debugging. Breakpoint debugging is popularized by our friends, the software developers/engineers. They have been using this type of debugging for many years, and the PowerShell team made it possible to use breakpoint debugging in PowerShell—which is a unique feature for a shell to have (Bash, cmd, Zsh, etc., don’t have breakpoint debugging capabilities).
So what’s it all about? Well, at a high level, the way breakpoint debugging works is you’ll run your script “with debugging” (VS Code jargon); this tells VS Code which lines in your script you want to stop at for further inspection (these stopping points are called breakpoints). We want to be clear: you were already doing this in the previous section with F8 debugging, where you ran a selection up to the part you want to investigate, only this time it’s even more integrated into VS Code. Okay, let’s look at how to set breakpoints and how it works in VS Code.
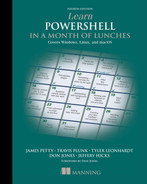
As shown in figure 25.4, when you put your cursor over a line number (let’s do line number 3), a faded red dot appears in the “gutter” of VS Code (it’s always between the line numbers and the activity bar on the left). If you click on that red dot, it becomes solid and no longer disappears when you hover away from it. Congratulations, you’ve just set your very first breakpoint! Let’s put that breakpoint to the test. Remember the Run button that is next to the Run Selection button? Well, that button runs your script “with debugging,” which means breakpoints will be stopped at if they are set. Let’s try it. Click the Run button in the top right, or press the F5 key, which is bound to Run.
Figure 25.5 gives an overview of what you see when you start debugging a script. At the top of the screen, you see a set of buttons that control how you would like to proceed in the debugging process.

Figure 25.5 When your script stops at a breakpoint, VS Code displays useful information for debugging your script. This includes indicating where you’ve stopped in your script, a list of all your breakpoints, a list of variables that are currently set, and more.
Here’s what each of those buttons does:
Don’t worry about the buttons ![]() for now. They are part of the concept of the call stack, which is a bit more advanced than where we want to take this book. This also means that we will not cover the Call Stack view. We also will not be covering the Watch view, because it’s not necessary to learn (and frankly we rarely use the feature), so we’ll leave it as an exercise for you to research if you like.
for now. They are part of the concept of the call stack, which is a bit more advanced than where we want to take this book. This also means that we will not cover the Call Stack view. We also will not be covering the Watch view, because it’s not necessary to learn (and frankly we rarely use the feature), so we’ll leave it as an exercise for you to research if you like.
Try it NOW This is a perfect opportunity for you to play around with all the different UI elements we’ve called out so far. Run (with debugging) a simple script that sets some variables and runs a few simple cmdlets like Get-Process or Get-ChildItem.
Going forward in this book, continue to leverage F8 and breakpoint debugging so you can improve your skills. We promise you it’s like riding a bike. Once you get the hang of it, you’ll keep that knowledge with you forever. Your ability to find problems in your scripts and ability to iterate on a script will be a lot better than someone without this foundational knowledge.
25.4 Lab
Practice makes perfect when it comes to debugging. There are two parts of the lab for this chapter. Go back to the script you looked at in chapter 22’s lab. Modify it and add better logging so that you can more easily understand what the script is doing.
Make sure that you add logging that shows on the screen only when you want to see debug logging but otherwise does not pollute the screen if don’t want to see debug logging. Revisit every script you’ve written in this book so far. Try debugging using