
To be flexible and powerful, the UML allows you to
put one or more state diagrams inside a single state to indicate that
when an element is in that state, other elements inside of it have
their own states. For example, within the Active
state of the project management system, each object and subsystem has
its own state, and the state diagram for each element may be shown
inside the Active state of the project management
system or by using the element’s own state diagram.
This recursive nature of state diagrams is very powerful, because it
allows you to learn the basic notation of state diagrams and reapply
it to nested state diagrams without having to learn more notation.
In the UML, a state may be shown as a rectangle with rounded corners
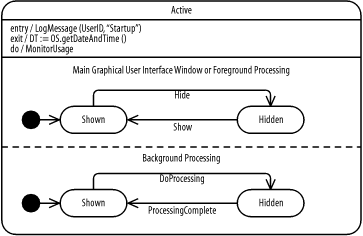
and three compartments separated by horizontal solid lines. Figure 7-5 shows the Active state of
the project management system with three compartments. The top
compartment of a state contains the name of the state or a
description of the situation of the element.
The middle compartment of a state may contain transitions for the following special events:
-
entry Indicates the action to be performed when the element enters the state
-
exit Indicates the action to be performed when the element exits the state
-
do Indicates the action to be performed continuously while the element is in the state
Figure 7-5 shows that when the project management
system enters the Active state, a message is
logged using the LogMessage action. When the
project management system exits the Active state,
the user’s date and time is retrieved using the
getDateAndTime action of the OS
object. Finally, when the project management system is in the
Active state, it continuously monitors its usage
using the MonitorUsage action.
The bottom compartment of a state may contain one or more nested state diagrams separated by dashed lines, each with a title that describes the element to which the state diagram pertains. When a state becomes the current state of an element, all its nested state diagrams become active concurrently.
Figure 7-5 shows that when the project management
system enters the Active state, the following
nested state diagrams each has a current state:
-
Main Graphical User Interface WindoworForeground Processing Describes the lifecycle of the user interface. There are two states, including the
Shownstate, which indicates that the user interface is visible to the user, and theHiddenstate, which indicates that the user interface is not visible to the user. TheHideevent makes the user interface not visible to the user, and theShowevent makes the user interface visible to the user.-
Background Processing Describes the lifecycle of how the system works as it is handling requests from the user. There are two states, including the
Idlestate, which indicates that the project management system is not handling any user request, and theBusystate, which indicates that the project management system is handling a user request. TheDoProcessingevent makes the project management system busy handling a user request, and theProcessingCompleteevent makes the project management system idle waiting to handle a user request.
All the transitions going from a state pertain to each nested state
diagram; if one of these nested state diagrams activates an outgoing
transition, all nested state diagrams are forcibly exited. Figure 7-5 indicates that when the project management
system is in the Active state and a
Severe Error event occurs, both nested state
diagrams are terminated independent of which nested state diagram
caused the event to occur.