The next few sections present solutions for Part III.
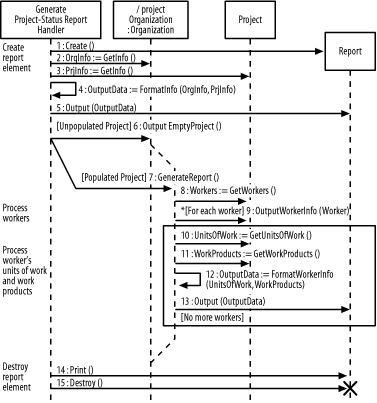
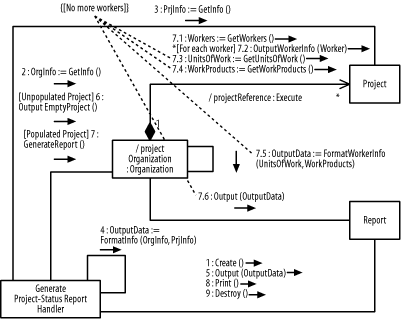
Figure B-32 shows the sequence diagram, and Figure B-33 shows the collaboration diagram. The interaction and collaboration is that of the
Generate Project-Status Reportdescribed in Chapter 6.In Figure B-32, the following elements are missing:
In Figure B-33, the following elements are missing:
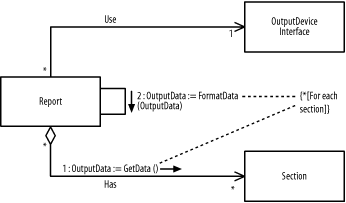
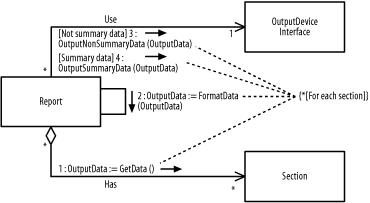
The following describes the figure: there are three elements, named
Section,Report, andOutputDeviceInterface. TheReportelement has aUserelationship with theOutputDeviceInterfaceelement and aHasrelationship with theSectionelement.Because these figures show an interaction and collaboration, each step adds to the previous step; otherwise, the notion of when a communication occurs would be lost!
Figure B-34 and Figure B-35 show the figures.
Figure B-36 and Figure B-37 show the figures.
Figure B-38 and Figure B-39 show the figures.


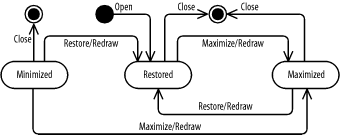
The following describes the figure:
The
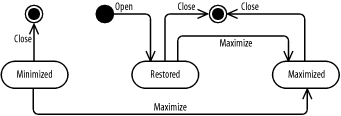
Minimizedstate indicates that a window is displayed as an icon taking a minimal amount of space on the user screen.The
Restoredstate indicates that a window is displayed as one of many windows taking a portion of the space on the user screen.The
Maximizedstate indicates that a window is displayed as the only window taking all the space on the user screen.When a window is created using the
Openevent or operation, it enters theRestoredstate.When a window is destroyed using the
Closeevent or operation, it may be in any simple state, including theMinimized,Restored, orMaximizedstate.
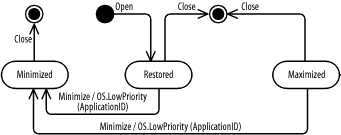
The following update the figure:
Figure B-40 shows the figure.
Figure B-41 shows the figure.
Figure B-42 shows the figure.
Figure B-43 shows the figure.
Figure B-44 shows the figure.
Figure B-45 shows the resulting diagram, which includes all the steps in this question.


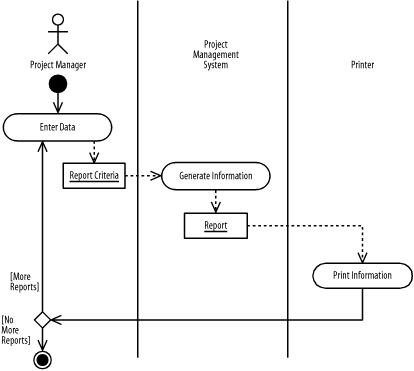
The following describes the figure:
The
Project Managerswimlane shows the action states that are the responsibility of a project manager.The
Project Management Systemswimlane shows the action states that are the responsibility of the project management system.The
Printerswimlane shows the action states that are the responsibility of a printer.First, the project manager enters data using the
Enter Dataaction state. Next, the project management system generates the report using theGenerate Informationaction state. Finally, the printer prints the report using thePrint Informationaction state.The
Generate Informationaction state outputs aReportobject and thePrintInformationaction state inputs theReportobject.After the printer prints a report using the
Print Informationaction state, a project manager may choose to print more than one report.
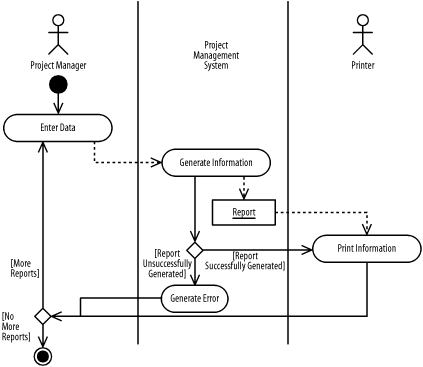
The following update the figure:
Figure B-46 shows the figure.
Figure B-47 shows the figure.
Figure B-48 shows the figure.
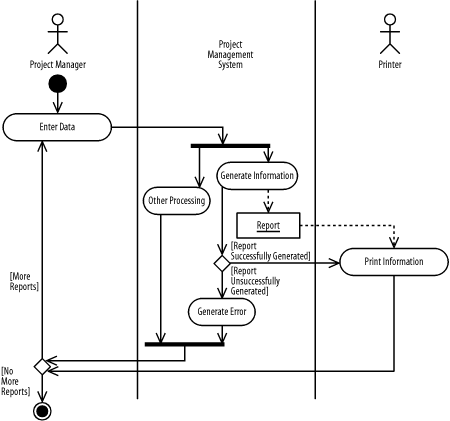
Figure B-49 shows the resulting diagram, which includes all the steps in this question.