

Have you ever noticed that the system administrator’s job seems to have two states applied to it? That they’re either ignored or hated? When everything is running smoothly, a system administrator is unnoticed by the end users. After all, if a system isn’t broken, why fix it? The problem comes in when things aren’t working all that well; namely, the users don’t have access to their applications. That’s when everyone notices the system administrator, who becomes the object of voodoo charms and curses.
To alleviate this love and hate relationship for the system administrator, he or she often has to play the role of psychiatrist, listening to the problems of the end user in a kind and sympathetic manner while trying to diagnose what happened with the application. The system administrator obviously has to wear many hats to get the job done. Not only do they have to play psychiatrist, but also first-level help desk, damage control, security consultant, application support, and so on.
Diagnosing applications, hardware, and network issues can be made easier by applying a mixture of common sense and patience to most problems. Having a well thought out strategy to fix issues when they come up allows the administrator to familiarize themselves with the environment enough to thwart common problems and to predict possible solutions.
There’s always more than one way to diagnose problems with a failed server or cluster. One approach is to go for the quick fix first. If you can remember how you fixed the problem last time, it’s a good idea to try that first. If that doesn’t work, a more complete method of troubleshooting is needed, including documenting what you’ve done and the steps you took to try to diagnose the issues. There are times when a quick fix, such as a server reboot or a hang up on sendmail, solves the problem because of something as innocuous as the universe being out of alignment. The problem might never manifest itself again.
If a reboot of the system doesn’t solve the problem, more drastic measures are needed, and it’s for this reason that it’s essential to have good documentation on hand for problems such as this. If you look through the documentation regarding the server in question, you should be able to piece together what issues you’re having, if this scenario has happened before. That’s assuming that you do have documentation in the first place.
The documentation should be able to tell you what has changed recently on the system, which is a good indication of what happened recently to affect something that now doesn’t work. Change management logs usually point you in the right direction. If the system you’re setting up is brand new, documentation and change management aren’t going to help you much, so you have to rely on common sense troubleshooting methods to eliminate the problem.
Most often, when your cluster has problems, you know why the application or hardware failed. It’s not that hard to diagnose hardware failures, for instance. If you’re getting input/output (I/O) disk errors, that’s a good indication that something is wrong with a disk drive, and it needs to be replaced. If your application doesn’t work for some reason, it’s a good idea to check to see if it’s even running. Nothing is more embarrassing than calling for support on a failed application and then finding out that it’s not running in the first place.
Sometimes, it’s not that easy to see what’s going wrong. Applications, although installed correctly, simply refuse to work to the befuddlement of everyone involved. There are times when even the application vendors are stumped, their vendors are stumped, and there’s nothing you can do besides shrug your shoulders and say that it doesn’t work. If you’re unlucky enough that the cluster involves more than one department, you can expect a lot of finger pointing. “It’s the network,” one exclaims. The network guys invariably answer, “No, QA did something to mess it up.”
By using the seven-layer approach to networking, one can effectively troubleshoot problem clusters and get a better idea of where the problem lies. Although not a sure fire cure for every problem, you can use this approach to diagnose issues with your cluster or any other problem you’re having.
Remember that the seven-layer network (discussed in Chapter 1, “Clustering Fundamentals”) is an abstraction of each aspect of interaction between computer to computer and also computer to human. The layers are application, presentation, session, transport, network, data link, and the physical layer. By going through each level step by step, you can troubleshoot the problems that you’re having in the cluster and work through the issues.
For example, let’s say you’re having a problem with a web server that connects to a remote database. You tried everything you can think of, and it still doesn’t work. The vendor can’t get it to work. There’s no sense in contacting QA, because frankly, they’re never there. So you decide to take some time and apply the seven-layer approach. Which end you start from is entirely up to you, although it’s suggested that you start at the bottom and work your way up.
Linux has a variety of tools at its disposal to diagnose issues at the network level. You can diagnose problems at the physical layer with a straight ping to test connectivity. First, ping the relevant machines in your cluster. If your machine needs outside access, ping outside your wide-area network (WAN) or local subnet. This alerts you if your default route is set up or not. Remember, to have any kind of network connectivity, you need three things: an IP address, a subnet mask, and a gateway. If the machines on the subnet aren’t using a gateway for their connectivity, the gateways are pointing to their own internal IP.
You also want to make sure that all cables are connected, and that each interface is up and has a link light. This is difficult when you’ve got a huge cluster, but it’s something to think about anyway. One notorious culprit is the cross-over cable, when a straight cable should be in its place. Anyway, make sure the links are up, and the switches are all configured nicely. Make sure the cabling is not loose, and that your computer operator has not chewed through them in frustration. To do so, it’s handy to have the right tools for the job to diagnose your network. A decent hand crimper to fix Ethernet cabling is always helpful, as is a cable tester to ensure that everything is up to snuff.
It’s also a good idea to have the cable professionally strung from the beginning because of potential problems. Cable has to conform to local wiring laws, and it’s easier to diagnose or repair systems when you don’t have to inspect yards of cable buried under the server room floor, or overhead in the rafters.
A laptop configured with the right networking tools is a great resource because you can drag it around to different parts of the environment and the cluster, and insert it on the fly. With the notebook configured for the proper subnet, you can easily use tools such as ping and traceroute to diagnose network issues. If it’s got the right software installed for your type of cluster, you can easily add it as another node.
There’s not much you can do at the data-link layer. It’s difficult to see that the protocols are working well; however, you can run an arp request to test connectivity. Using /sbin/arp <IP> shows you the hardware type of the interface (arcnet, pronet, ax25, netrom), and the Media Access Control (MAC) address of the interface. You can at least test physical connectivity.
Troubleshooting at the network layer is important for network functionality. It’s here where you’re going to diagnose most of your network errors. You can see mismatched network masks, misconfigured gateways, and things such as misconfigured hosts tables. The misconfigured gateway always seems to pop up when one least expects it, causing you to lose connectivity outside of your local network. You can check the default gateway with the route command:
# route
Kernel IP routing table
Destination     Gateway         Genmask         Flags Metric Ref    Use Iface
172.16.0.0      *               255.255.255.0   U     0      0        0 eth0
127.0.0.0       *               255.0.0.0       U     0      0        0 lo
default         172.16.0.1      0.0.0.0         UG    0      0        0 eth0
In this case, the default route at the bottom with the gateway in it states that each packet not headed for the local subnet is going to that address to be relayed.
Linux provides tools such as netstat to diagnose various network issues. Using netstat gives you a good idea of the environment so that you can trace connections. Using /sbin/route is also good for troubleshooting connections, as it gives you an idea of where your packets are headed. The route command shows the kernel’s routing tables after being manipulated by the ifconfig command.
# netstat
Proto Recv-Q Send-Q Local Address           Foreign Address         State
tcp        0      0 172.16.0.6:1255         172.16.0.2:x11
ESTABLISHED
tcp        0      0 172.16.0.6:1253         172.16.0.2:x11
ESTABLISHED
tcp        0      0 172.16.0.6:1250         172.16.0.2:x11
ESTABLISHED
tcp        0      0 172.16.0.6:1259         172.16.0.2:x11
ESTABLISHED
tcp        0      0 172.16.0.6:1245         172.16.0.2:x11
ESTABLISHED
tcp        0     40 172.16.0.6:1338         172.16.0.2:x11
ESTABLISHED
tcp        0      0 172.16.0.6:1337         172.16.0.2:x11
ESTABLISHED
tcp        1      0 172.16.0.6:1257         209.151.248.200:http
CLOSE_WAIT
tcp        1      0 172.16.0.6:1260         209.151.248.200:http
CLOSE_WAIT
Pulling up netstat shows active connections on the server that it’s being run from. If run from the master node on a cluster, you can see which connections are being made from where, which protocols are in use, and the state that the port is in.
Remember that there might be barriers to your network probes. Firewalls often block ping, traceroute, and other Internet Control Message Protocol (ICMP) traffic.
The transport layer consists of mechanisms for session establishment, which incorporate tcp and udp traffic. The session layer manages sessions between different presentation entities. Applications that use this layer include the X window system, Network File System (NFS), and Structured Query Language (SQL), among others.
“Okay,” you say. “That’s all well and good, but how does this apply to diagnosing the cluster?” One way of doing this is by sniffing the traffic on the network. By hooking up a sniffing device or program, you can see whether or not the packets for your particular program are being sent across the wire, and what the network is doing with them. Some great tools exist for Linux that are indispensable for the administrator who’s looking to diagnose network issues, and they happen to be freely available under the GNU general license. Among them are tcpdump, ethereal, and sniffit, which are described in more detail in the next section.
The presentation layer is responsible for presenting data to the application layer. It’s responsible for translating data and providing coding and conversion. This layer provides services for the application layer. There’s not a whole lot of necessary diagnosing that can go on at this level.
Troubleshooting problems at the application layer depend on the applications themselves, and are different for each type of cluster. Various tools can monitor the health of your applications, not including the applications themselves.
Third party applications such as mon, Big Brother, and NetSaint perform a limited service in maintaining services on the application layer. They can tell you if a particular service is up and running and even take action regarding certain events, as in Simple Network Management Protocol (SNMP). Although it’s a great place to test applications on a single machine, it’s not a great place to test connectivity.
For true application support, you have to bear down and read the documentation first of all. Secondly, knowing where to get answers for your application is the key to being a good system administrator. Mailing lists, books, search engines, and other administrators are all great resources for learning where to diagnose your application. Of course, sometimes the best place to go is paid application support from the vendors themselves, even though that’s not possible all the time.
Top is a similar program to ps, which is designed to display the top CPU processes and memory hogs in order. Top was inspired by a command, which listed the top five processes, including their use. This achieves a similar goal but is more attuned to ps. It’s a great program to display memory hogs and zombie processes. Although the experienced system administrator already has knowledge of Top, it’s always good to keep this program in mind for when the need arises. Following is a sample output of the top command. Top refreshes itself naturally every five seconds, but you can easily change that with the d or s commands.
1:15pm  up 6 days, 34 min,  3 users,  load average: 0.00, 0.00, 0.00
74 processes: 73 sleeping, 1 running, 0 zombie, 0 stopped
CPU0 states:  0.4% user,  3.0% system,  0.0% nice, 96.0% idle
CPU1 states:  0.0% user,  0.1% system,  0.0% nice, 99.4% idle
Mem:   158524K av,  155416K used,    3108K free,       0K shrd,   12364K buff
Swap:  415760K av,   27900K used,  387860K free                  114668K
cached

  PID USER     PRI  NI  SIZE  RSS SHARE STAT %CPU %MEM   TIME COMMAND
29480 edstorm   19   0  5616 5616  5308 S     1.9  3.5   0:24 kdeinit
29769 stomith   14   0  1056 1056   840 R     1.3  0.6   0:00 top
29432 root      11   0  2016 1984  1384 S     0.3  1.2   1:00 sshd
26907 root      10   0   516  276   260 S     0.1  0.1   0:08 sshd
    1 root       9   0   124   72    72 S     0.0  0.0   0:15 init
    2 root       9   0     0    0     0 SW    0.0  0.0   0:00 keventd
    3 root       9   0     0    0     0 SW    0.0  0.0   0:37 kswapd
    4 root       9   0     0    0     0 SW    0.0  0.0   0:00 kreclaimd
    5 root       9   0     0    0     0 SW    0.0  0.0   0:00 bdflush
    6 root       9   0     0    0     0 SW    0.0  0.0   0:20 kupdated
    7 root       9   0     0    0     0 SW    0.0  0.0   0:00 scsi_eh_0
    8 root       9   0     0    0     0 SW    0.0  0.0   0:00 khubd
  268 root       9   0   192    4     4 S     0.0  0.0   0:00 safe_mysqld
  332 root       9   0  5876 1472  1384 S     0.0  0.9   0:00 mysqld
  401 root       9   0  5876 1472  1384 S     0.0  0.9   0:09 mysqld
Top displays the processes that take up the most CPU time, down to the ones that take the least. The first column shows the process identification number of the offending process, then the owner, the tasks priority, and the nice value. Remember that the lower the nice value, the higher priority the job. The size column refers to the task’s code, plus data stack space in kilobytes. The RSS column displays the total amount of physical memory that the task uses in kilobytes, and the share column displays the amount of shared memory.
The stat column actually means state of the task. The letter S refers to a sleeping task, D is uninterruptible sleep, R is running, and Z is for Zombie. A process with a W means that the process is swapped out. The time column represents the total CPU time that the task has used since it started.
Your Linux distribution should come with top installed, as it’s extremely helpful. If it’s not, you can always find it at ftp.groupsys.com.
If your application is listening on specific ports, you might try to use Telnet to test connectivity. Telnet opens a connection that allows you to see exactly what’s going on, regardless of confusing interfaces. Depending on the application, you can arm yourself with the specific Request For Comments (RFC) and manually work the service without a pesky program such as a newsreader or mail client.
For example, take the classic example of mail transmittal and receiving. It’s easy to send and receive mail without even using a mail client. Receiving mail through Post Office Protocol (POP) is also extremely easy, although trying to manually get your mail through Internet Message Access Protocol (IMAP) is incredibly hard and won’t even be mentioned here. Check out the RFC if you’ve got the time.
Checking to see if your Simple Mail Transfer Protocol (SMTP) server is up is done through a simple Telnet to port 25 on the remote machine. Just like you’re attaching directly to the port which SMTP runs, you can Telnet to 110, the port which POP3 runs on. By receiving a banner after you Telnet to the port, you can know that your application is running. Following is an example:
# telnet localhost 25
Trying 127.0.0.1...
Connected to localhost.
Escape character is '^]'.
220 localhost.localdomain ESMTP Sendmail 8.11.6/8.11.6; Thu, 3 Jan 2002
00:43:52 –0800
Do you see that banner there with the 220 leering at you? That’s sendmail, which is waiting for the next prompt. Mail clients also see that, they just don’t display the output for you. This tells you that sendmail is up. Taking it a step further, if you type help
, you understand that sendmail isn’t meant to be run in the background without user intervention.
214-2.0.0 This is sendmail version 8.11.6
214-2.0.0 Topics:
214-2.0.0       HELO    EHLO    MAIL    RCPT    DATA
214-2.0.0       RSET    NOOP    QUIT    HELP    VRFY
214-2.0.0       EXPN    VERB    ETRN    DSN     AUTH
214-2.0.0       STARTTLS
214-2.0.0 For more info use "HELP <topic>".
214-2.0.0 To report bugs in the implementation send email to
214-2.0.0       [email protected].
214-2.0.0 For local information send email to Postmaster at your site.
2.0.0 End of HELP info
Programs such as sendmail and POP3, and Network News Transfer Protocol (NNTP) servers, all display help functions at the Telnet level, in case you want to test or even use the application as designed. Following is a manual sendmail session in action:
# telnet localhost 25
Trying 127.0.0.1...
Connected to localhost.
Escape character is '^]'.
220 localhost.localdomain ESMTP Sendmail 8.11.6/8.11.6; Thu, 3 Jan 2002
00:43:52 -0800
HELO matrix.etopian.net
250 localhost.localdomain Hello matrix [127.0.0.1], pleased to meet you
Mail From: [email protected]
250 2.1.0 [email protected]... Sender ok
RCPT To: [email protected]
250 2.1.5 [email protected]... Recipient ok
DATA
354 Enter mail, end with "." on a line by itself
This is a test. This is a test of the email system. This is only a test.
.
250 2.0.0 g03AGFB23641 Message accepted for delivery
quit
221 2.0.0 localhost.localdomain closing connection
Connection closed by foreign host.
In this example, there is huge potential for abuse. After connecting to the server itself, it’s easy to type in the wrong Mail From attribute, which might make your email come from someone else, such as your boss.
Checking email manually through POP is also a great way to test connectivity, and the protocol is simple enough that you don’t have to worry about reading miles of documentation. A POP server only handles six basic commands, user, pass, stat, list, retr, and dele. Following is an example session:
$ telnet localhost 110
Trying 127.0.0.1...
Connected to localhost.
Escape character is '^]'.
+OK Qpopper (version 4.0.3) at tiger starting.
user cbookman
+OK Password required for cbookman.
pass p@ssw0rd
+OK cbookman has 1 visible message (0 hidden) in 2166 octets.
list
+OK 1 visible messages (2166 octets)
1 2166
.
retr 1
+OK 2166 octets
Received: from mailhost.uop.edu (IDENT:[email protected] [138.9.1.1])
Received: (from mail@localhost)
        by proda201.uu.commissioner.com (8.9.3/8.9.3) id LAA26684;
        Tue, 23 Oct 2001 11:10:10 -0400
Message-Id: <[email protected]>
Date: Tue, 23 Oct 2001 08:12:53 -0700
From: "Jonathan" <[email protected]>
To: <[email protected]>
Subject: We have a winner!
Mime-Version: 1.0
Content-Disposition: inline
Content-Transfer-Encoding: 8bit
Content-Type: text/plain; charset=US-ASCII
REMEMBER that we have another Thursday thriller!  Colts and Chiefs!  That
game starts at 5:30.  All picks for the week must be in by 4:30 on Thursday!!
Good luck!  J
.
dele 1
+OK Message 1 has been deleted.
quit
+OK Pop server at tiger signing off.
Connection closed by foreign host.
Sometimes, a straight ping or top doesn’t diagnose an application or service. To fully understand what’s happening with your cluster, you have to look behind the scenes and see how the individual machines talk to one another.
Packet Capture provides a great deal of information for diagnosing traffic on the network, which includes telling you the locations of potential bottlenecks and problems. Capturing and viewing all traffic on your network comes with a small price, however. A certain amount of finesse is required to use it effectively, and to protect the security and privacy of your users. You must make sure that you’re not breaking any laws, and that the viewing packets abide by the guidelines of your organization.
Capturing and viewing traffic entails monitoring the data that travels across your network and analyzing it for certain patterns. Perhaps you might be looking for certain protocols to be transported over certain areas, or to look for certain handshaking between applications. You can use numerous tools to analyze traffic over your network, which either analyze or interpret the results for you.
The first question you have to ask yourself is if you can actually view the data in question. To view the data, you must get on the network that the data is being transferred over. If you’re using your public network to view traffic, it’s going to be difficult to view packets transmitted over your private parallel cluster. One way to make this easier is to use remote computers on the network with the proper tools on them, and then hit those various computers remotely. Another way is through creative use of virtual local-area network (VLAN) technology, if your network supports it. By putting a local computer on the same VLAN as your remote network, you can become a part of that network.
If all your data is transmitted over hubs, the data is effectively shared, and viewing the packets doesn’t present a problem. The problem comes in when the network isn’t composed of hubs. With the advent of cheaper and more reliable switching technology, hubs are becoming a thing of the past. More organizations aren’t even considering hubs because of the increased security that switches provide. That’s not saying that all is lost, however. If you have physical access to the network in question, you might be able to temporarily replace the switch with a hub, if that section of the network can take a temporary hit in performance. If you can’t do that, consider placing a hub on the switch, and only put those network connections on the hub which you want to view.
Packet sniffing works by putting a network interface in promiscuous mode. This forces the interface to grab all packets on the network, rather than accept packets destined for that address specifically. Linux needs the interface to be put into promiscuous mode with the ifconfig command. You need to be root to toggle the interface, which you can do with the following:
# ifconfig <device> -promisc
Discussion of data capture programs begins with tcpdump, which is one of the most basic programs for capture. The program was written at the Lawrence Berkeley Laboratory at the University of California at Berkeley. The tcpdump program uses libpcap, which is a high-level library that is designed specifically for packet capture.
Using tcpdump allows you to see exactly what’s going on with your network. The program isn’t a great analysis tool, but that’s not what it’s designed to do. It’s designed to take a snapshot of the network. You can optionally add filters to collect information about a certain part of a network or cluster, which is probably exactly what you want when diagnosing different aspects of your environment.
If tcpdump isn’t already installed on your system, you can get it at www.tcpdump.org. You also need to download and install libpcap. First, install libpcap, and then tcpdump. Both use the standard configure, make, and as root, make install.
Running tcpdump without any options causes the program to start spewing out every bit of possible information about the network and the data that it sees. You can save this information to a file with the redirect > optio n, or run it in the background with & or nohup.
The best thing you can do with tcpdump is use it to collect data for use in other applications, such as Ethereal. By using the –w switch, you enable tcpdump to write in raw mode. This switch tells tcpdump to directly dump raw binary data onto a text file. The syntax is as follows:
# tcpdump –w <textfile>
Now that you’ve got raw data about your network, you can use it in other ways. The -r switch, tcpdump can reread its binary file and display it in human readable format. You can then redirect that human readable format into a text file, such as the following:
# tcpdump –r <textfile> > <outputfile>
The –c switch tells tcpdump to exit after so many packets. The –I switch tells tcpdump which interface to listen on. This is a necessary tool if you’re using your Linux machine on multiple networks, or as a router.
If you don’t want to capture the entire network’s worth of data, use filters that only capture specific information. The filtering language is also used by other programs, such as Ethereal, so at least a cursory examination of the language is warranted.
Filters can be applied by either appending them to the end of the command line, or by a file. The file is read by using the –F switch with the name of the file. You typically use files for complex filters that are run repeatedly, rather than typing the filter on a constant basis during each command line argument.
The most basic filter is to sort based on type, by using the host, net, or port keywords. With these filters, you can display only the traffic that’s related to those services. For example:
# tcpdump net 172.16
shows you all the traffic on the Class B subnet. Using
# tcpdump port 80
displays all web traffic on the same network. You can also specify traffic going in a specific direction, with the src command, which denotes the source and dst for destination.
You can also specify the proto keyword to denote the protocol that you want to dump. Possible protocols include ether, fddi, tr, ip, ip6, arp, rarp, decent, tcp and udp. You can use these in combination with other filter attributes such as dst and host.
The tcpdump program can even look into the packet headers themselves and match such characteristics as packet length or packet contents. Using
# tcpdump greater 150
shows all packets with a size greater than 150 bytes.
You can also use compound filters with tcpdump to achieve more granulated results. You can use logical operators such as and, or, and not, otherwise known as &&, ||, and ! respectively, without taking the highest precedence. If you want to display just IP information from a certain host, you can use the following:
# tcpdump host 172.16.100.10 and ip
Although these examples of tcpdump generate raw data for other programs and advanced network administrators, you most likely need other programs to massage and analyze the data. Some programs that you might want to look into are tcpslice, tcpshow, tcp-reduce, and tcp trace. This is just a brief overview of tcpdump and what it can do for your cluster troubleshooting. It’s recommended that you use it for a while and play around with different filters and filter files. As always, be sure to check the man pages for more specific information; that’s always the best place to start.
Ethereal is a free network packet analyzer for both Linux and Windows systems that allows you to capture data from the local network, and to analyze the data captured from other programs such as tcpdump. Ethereal also uses the same filter and capture syntax as tcpdump, so you can use it from the command line and from a primarily graphical interface.
You can get Ethereal from www.ethereal.com. Ethereal needs at least GTK+ 1.2.0 or better to run because of graphic requirements. You also need the familiar libpcap installed from www.tcpdump.org. Binaries are available for most distributions of Linux, or you can start with the old, configure, make, make install of the source code. Using make install-man installs the man pages, which have to be done separately.
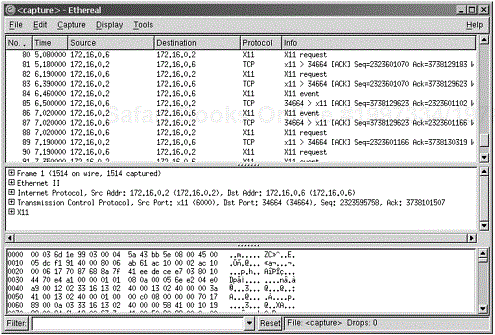
Ethereal supports a huge variety of protocols, and the list is constantly growing as more and more people submit protocol dissectors. This program is extremely useful for diagnosing network issues (see Figure 11.1). It tells you more about how the network works, and it shows you communication between clusters on the network.
You start ethereal by running Ethereal from the command line. This brings up a blank graphical interface.
You can either use Ethereal to capture data itself, or by loading the raw data saved with tcpdump and the –w switch. Click File, Open, and the name of the tcpdump-ed file to analyze the data, or you can use a previously saved Ethereal file.
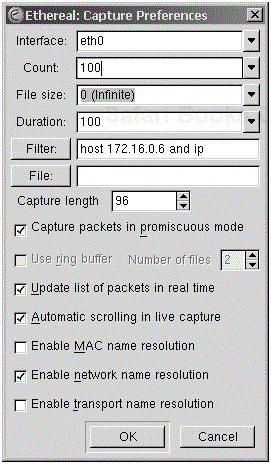
If you want to use Ethereal to capture data, simply select Capture, Start. This brings up another dialog box that you can use to massage the data you want to capture.
The graphical interface lets you choose the network interface that you want to capture data from, and the number of packets. The third field selects the file size limit, as an unlimited sized capture can easily fill up a partition full of raw data. The duration selects the number of packets to capture. The filter dialog box, if you remember correctly, follows the same syntax as tcpdump. The File option defines the file that you want to save the capture under when you hit Save As in the main file menu. Capture length here refers to the maximum length of the packet. The maximum length possible is 65,535. Make sure that it’s at least as large as your maximum transmission unit (MTU).
Clicking OK starts the capture process, and depending upon the options you’ve just selected, displays the captured packets in real time.
The resulting dialog box, shown in Figure 11.2, displays all the information that the capture has shown. After you’re done capturing data, you can return to the screen to analyze the data. The top pane shows the captured packets by number and time, where they came from, where they’re going, and the protocol they’re following.
Clicking any packet in the upper frame changes the lower two frames, and shows more data about the specific packet that was selected. The lower pane actually shows the packet collected in both hex and ASCII format, and the middle frame tells you more about what you’ve selected. One option is to right click the packet and then open it up in its own window for further observation.
Try selecting a portion in the middle frame, such as the Source or Destination address. The resulting hex information in the lower frame is displayed, which shows you the actual data. If you highlight a particular aspect of the frame in this way, and then right click, and select Match Selected, Ethereal updates its own filter for you and displays the relevant data depending on the resulting filter.
For example, to select all data going to a specific destination, expand the Ethernet II option, highlight the Source field, and right-click in that frame and select Match Selected. To clear the filter and return to the unfiltered data, click the Reset button on the bottom of the frame.
You can also view individual packets and select Follow tcp Stream. This collects all data from the tcp packets and displays it as one stream, which allows you to view information that has been transmitted, including possibly sensitive password information. The main reason to sniff packets isn’t for malicious password sniffing, however, but to diagnose the interactivity between applications.
One of the most powerful aspects of ethereal is its ability to display data in a variety of formats. Ethereal’s interface lets you colorize by protocol and type of packet. You can colorize all Domain Name System (DNS) requests, and any hundred or so protocols. Ethereal also makes its own filters based on your selections.
You also can highlight certain parts of the captured packet, right click in the display, and select Match as Selected. This matches other packet characteristics as necessary, and applies other filters to them, such as highlighting them with color for the display.
Using these, you can quickly see what kind of traffic is taking up the network, and therefore, what kind of information your cluster is passing to and from the other nodes. The documentation for ethereal is well written and worth more than a cursory glance. You can find them constantly updated and housed at www.ethereal.com/docs/user-guide.
If all else fails, and you can’t seem to diagnose the application, you might be better off rolling back to a previously known configuration, or installing from scratch because of the time it takes to diagnose what’s failed. If you think that diagnosing the application or OS problem will take longer than reinstalling the data, you can probably save time by rolling back to either the last time it worked or from a clean install.
When you’re thinking about rolling back to a previous state, remember what media you have to roll back from. This is why a roll back plan needs to be incorporated in each cluster design. You have to ask yourself a few questions before rolling back (reinstalling the OS from scratch). For example, will rolling back and starting from scratch actually solve the problem? Rolling back won’t save critical data.
Starting over might be the preferred method for solving any major problem with several nodes, as from a parallel computing or dedicated distributed cluster. These systems don’t actually hold any data for the most part, as they’re just nodes. Reinstalling from scratch only takes 45 minutes at the most, on a decent 100bt network. It’s even faster if you’re not doing a complete install or if you have finely tuned your image.
With a decent backup strategy in place, you might only need to roll back to the last incremental or differential backup, if you know where the last good working configuration was. This is preferable to reinstalling from scratch, if you know of a change that was made so that you can at least roll back to before the change.
If your budget can afford it, a standby machine might be an optimal solution. It’s much easier to throw in a spare node than to try to diagnose a failed application on a production machine. A hot standby with automatic failover is optimal. You can then repair the failed node or application when it’s not critical.
The key here is preparedness. You must have a decent plan to recover at the image level. The trick isn’t in installing the OS again, that’s easy. A more detailed explanation is found in Chapter 3, “Installing and Streamlining the Cluster.” The real issue is adding the necessary applications into the Kickstart routine so that they are available upon startup. The end goal is to use it so that you have a minimum of downtime.
If planned out well, you can use scripts to mount other directories on the network and run install routines so that you don’t have to worry about installing packages when installing each time. By using a script similar to this one, you can envision what kinds of things can be done at the install level to automate an entire install. If you prepare your environment and your scripts ahead of time, it’s easy to go from bare metal to production in under an hour, not counting potential data.
#!/bin/bash
#
# Script to setup services for the correct vlan
#
#############################################################
# Installing name services
cat > /etc/resolv.conf << EOD
domain stomith.com
nameserver 192.168.0.1
nameserver 192.168.1.1
EOD
#############################################################
# Script creates /etc/rc2.d/S99tempscript to install packages
# off of server daemon and yogsothoth; will remove itself when done.
# install_big_brother, install_mon, install_mosix are pre-built scripts
# off of daemon which install programs onto a machine called with this
# kickstart script.
#
cat > /etc/rc3.d/S99tempscript << EOD
mkdir /root
mkdir -p /import/src
mount 192.168.0.100:/usr/local/src /import/src
cd /import/src
/import/src/install_big_brother
PATH=$PATH:/usr/local/bin;export PATH
/import/src/install_mon
/import/src/install_mosix
rm /etc/rc2.d/S99tempscript
umount /import/src
#
# This portion of the script should install the latest version of SSH.
# Not the free openssh, but the non-commercial version, mind you.
mount 192.168.0.101:/kickstart
cp /mnt/Packages/ssh-3.0.1.tar.gz /root
cd /root
gunzip -c ssh-3.0.1.tar.gz | tar xf -
cd ssh-3.0.1
./configure
make
make install
cd startup/linux/redhat
if [ -f sshd2 ]; then
     cp sshd2 /etc/init.d/
     chmod +x /etc/init.d/sshd2
     ln -s /etc/init.d/sshd2 /etc/rc3.d/S96sshd2
     ln -s /etc/init.d/sshd2 /etc/rc0.d/K86sshd2
else
     :
fi
reboot
EOD
# "Temporary Startup Script Install Complete."
####################################################################
# Make tempscript executable; end script
#
chmod +x /a/etc/rc3.d/S99tempscript
This program is called after the Kickstart script starts the post installation. This script installs itself in /etc/rc3.d so that it is called upon at reboot. After the system is rebooted, the script is called and starts running install software from a third server. After the script is done, it removes itself from /etc/rc3.d so that it doesn’t get called for an install each time.
In the previous script, the install_ssh can also be placed standalone along with the other install scripts. This allows you to call your own scripts from there, or include them in the main install script, whichever works better. Disaster Recovery becomes much easier when you’ve got a plan.
As with Kickstart images, it might be easier to reinstall the entire operating system rather than diagnosing errors. You have to keep a golden image on a backup server or tape for this approach. It’s a good idea to make an image of the server right before you put it into production; this way, you can roll back to it whenever things get hairy.
It’s also a good idea also to make ghost images periodically, although it’s difficult at times to bring down production systems to do so. If you can manage to schedule downtime, you can have different images to pick from.
A restore plan at the OS and application level also saves on tapes. There’s no need to back up an OS if you have a ghost image or Kickstart method to fall back on. The only restores that you have to make are ones containing the actual changed data.
Learning how to deal with frustrating users and even more frustrating management is a skill that becomes more honed over time as you learn to adjust to your user base. The more you work with your cluster, the more you find out who uses it. You also find what needs they have, and which applications they have problems with or tend to accidentally delete occasionally. Learning to deal with the human element of the cluster is just as important or more so than all the hardware and software put together.
A good system administrator needs to remain calm at all times. It’s understandably hard to keep one’s cool when the bastard operator from hell thinks they’re doing you a favor by troubleshooting applications or hardware, and then calls you up to say that they couldn’t fix it but they absolutely know what the problem is and would you kindly fix it at your convenience (right now). Unless you’re building a cluster in a home hobby environment, you will have users for whom you’re responsible. Management has to be kept happy, and users have to actually use the cluster if you’re using a parallel or distributed environment. The thing to remember is that if you’re the one who maintains the cluster, you’re the one who has to keep everyone happy.
A good rule of thumb is to keep the appearance of calm at all times. This isn’t always easy, especially when you’ve been frantically trying to fix the disk array to the master node of the web server’s load balancer. It always happen that you get a call directly from an end user “just letting you know that the web site is down.” It’s a good idea to take a Zen-like approach, in that this, too, shall pass. It’s likely that the user doesn’t know that your mirror replicated the deleted operating system files across both drives and that your backup operator can’t restore the data.
If someone calls you screaming because the job that they’ve been working on for two days is lost somewhere, you can easily calm them down by using a nice, even tone of voice. Your natural instinct might be to yell back at them, but if you keep an even-tempered, calm voice, nine times out of ten you’ll find that you’ve just diffused a potential hazard. It’s almost impossible to continue shouting at a calm person.
A common technique in counseling is the idea of “matching behavior.” The trick here is to start out matching the behavior of a client. The client might call you on the phone, or even worse, jump into your cube yelling and screaming. If you’re the hot-headed type, then by all means, yell and scream back. Naturally, this can only escalate into something you both don’t want. The idea here is to start out upset, but gradually ease the conversation down to a nice, even, mellow tone within a short amount of time. The other person will gradually match your behavior, and you’ve just diffused a potentially harmful situation. Of course, this doesn’t happen often, but it’s good to arm yourself with knowledge for server room use.
Troubleshooting a failed cluster can be done if you know why the problem flaked out in the first place. Otherwise, you can use the network layered approach to diagnose failed clusters and their applications.
You can use common knowledge and tools to diagnose what’s going on with your network. Sniffing packets and displaying what’s going on in the midst of the network gives you a good idea of what’s actually happening.
It might be easier to simply recreate the cluster from an image rather than diagnose a failed application. If there’s a hardware problem, it might actually be easier to swap out an entire machine than fix it because of the time and cost of repair and maintenance contracts.
If all else fails, get yourself an Emergency System Administrator Kit. This item, not sold in stores, is a large red box with a single pane of glass that you hang on your wall in case of an emergency. If for some reason you can’t possibly fix the cluster, or because it’s messed up beyond belief, take the arm on the side of it, and break the glass. Within the emergency repair kit, you’ll find a copy of your resume. Make copies and distribute liberally.