COUNTRY SCIENTIST
USING SENSORS WITH DATA LOGGERS
Data logging is the automatic collection and saving of information. Having the ability to automatically log a string of measurements and save them for later study and analysis can help transform you from an experimenter into a scientist.
Trees are natural data loggers, and I described how to analyze their annual growth rings in MAKE Volume 19. So are layers of snow (Volume 21). And you can log sunlight intensity for entire days using blueprint paper (Volume 26).
Electronic data logging provides an enormous range of opportunities for amateur scientists. Back in the 1980s, I would connect a sensor to the joystick port of a PC like RadioShack’s Color Computer or IBM’s PCjr, and write simple data logging programs in BASIC. When analog-to-digital interface boards became affordable, my logging became more sophisticated. Still, these methods required a computer dedicated solely to the logging operation.
Data logging changed dramatically when miniature, standalone loggers were introduced. These devices provide real-time logging without the need for a dedicated computer. They’re activated and downloaded by a computer, but in between, they operate independently. Data loggers are available from Onset Computer, Jameco, Omega Engineering, SparkFun, and others. Maker Shed (makershed.com) also sells a data logging shield for Arduino microcontrollers.
Interfacing Sensors to Loggers
You can buy tiny data loggers that store temperature readings over time. Other loggers record light, carbon dioxide, pressure, and other parameters. But what if you want to log a parameter for which there is no logger?
You can build your own logging system from scratch or from published plans. Or you can do as I’ve done and design DIY sensor circuits that can be connected to the voltage input(s) of commercial loggers. This approach frees up considerable time, since software is already available for these loggers.
If a sensor produces an output voltage that doesn’t exceed the allowable input voltage for the logger, no circuitry is needed (unless the signal is so small that it requires amplification). A typical logger has an allowable input range of 0 to 2.5 volts. This means you can safely and directly log the voltage of many kinds of disposable and rechargeable power cells and batteries.
Voltage Divider Sensor Interface
If your sensor is resistive it won’t produce a voltage, so you’ll need to connect it as half of a voltage divider. The simplest interface circuit for resistive sensors is the single resistor or potentiometer circuit shown in Figure A. It can be used with light-sensitive photoresistors, temperature-sensitive thermistors, and other sensors having a resistance that changes with pressure, touch, weight, acceleration, rotary motion, and so forth.
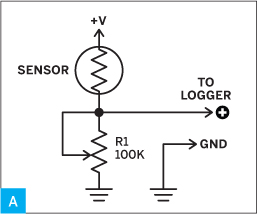
![]() Fig. A: Use this simple voltage divider to connect resistive sensors, like photoresistors and thermistors, to voltage loggers.
Fig. A: Use this simple voltage divider to connect resistive sensors, like photoresistors and thermistors, to voltage loggers.
R1 is a resistor or pot connected in series with the resistive sensor to form a voltage divider. Using a pot allows the sensitivity of the circuit to be easily adjusted. The free end of the sensor is connected to the logger’s positive supply voltage, and the free end of R1 is connected to the logger’s ground at the input. The junction of the sensor and R1 is connected to the logger’s positive input. Be sure to check the polarity of the logger’s input before making the connections.
It’s best to use the logger’s supply to power this interface, since this will avoid applying excessive voltage to the input. If the positive supply isn’t available externally, you can open the battery hatch or the enclosure and carefully solder a connection wire to the positive (+) side of the battery connection.

![]() SURF AND SUNBURN Data loggers showed that Hawaiian surf reflected solar UV-B radiation (see Figure F, following page).
SURF AND SUNBURN Data loggers showed that Hawaiian surf reflected solar UV-B radiation (see Figure F, following page).
Forrest M. Mims III
Op-Amp Sensor Interfaces
If your sensor’s output is too low for your logger, you’ll need to amplify it. Operational amplifiers are ideal for boosting the very tiny current from light-sensitive photodiodes and the voltage produced by thermocouples in response to temperature. Very few components are needed, since most of the electronics are inside the op-amp. For best results, select an op-amp that can be powered by a single polarity supply at or below the operating voltage of the data logger. This allows the sensor interface to be powered by the logger, and ensures that the sensor output won’t exceed the logger’s voltage.
Many different low-voltage op-amps are made by Maxim, Texas Instruments, National Semiconductor, and others. They’re available in both traditional 8-pin mini-DIPs and surface-mount packages, from Jameco, Digi-Key, Mouser, and other distributors.
I’ve had very good results using the TI 271 with 8-bit Onset loggers. This op-amp requires a minimum of 4V, which exceeds the 3V lithium battery that powers these loggers, so I have to attach a 9V battery to the modified logger. I’m planning a new set of modified loggers that will use the TLC251, TLC252 (a dual 251), or other op-amps powered by only a few volts.
Some sensors, like photodiodes and photovoltaic or solar cells, produce a variable current at a relatively stable voltage. Figure B (previous page) is a circuit I’ve used to interface various photodiodes with 8-bit and 12-bit Onset Hobo loggers. The photodiode generates a small photocurrent when illuminated by a light source of the appropriate wavelength. The op-amp converts the current to voltage and amplifies it, so it can be saved by a logger. The amplification or gain equals the resistance of feedback resistor R1. Thus, if R1 is rated 1,000,000 ohms (1MΩ), the photocurrent is amplified by 1 million. Reduce R1’s resistance if the circuit’s output approaches the power supply voltage before the light levels you’re trying to record are reached. Increase R1 if the circuit isn’t sufficiently sensitive. Capacitor C1 helps prevent oscillation of the circuit.

![]() Fig. B: Current-to-voltage input for a data logger. PD is a photodiode. IC1 is a single, not dual, op-amp.
Fig. B: Current-to-voltage input for a data logger. PD is a photodiode. IC1 is a single, not dual, op-amp.
The circuit in Figure C is for sensors that produce a variable voltage instead of a current. Thermocouples, for example, produce a voltage proportional to the temperature to which they’re heated. The gain of this circuit is 1 + (R2/R1). The values shown in Figure C provide a gain of about 1,000, suitable for monitoring the heat from a space heater when used with a type K thermocouple. Increase R2’s resistance for more temperature sensitivity.
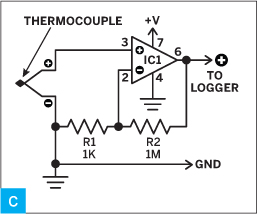
![]() Fig. C: Voltage-to-voltage input for a data logger. IC1 is a single op-amp.
Fig. C: Voltage-to-voltage input for a data logger. IC1 is a single op-amp.
Some Data Logger Applications
I first began using standalone data loggers to measure the temperature of fire ant mounds, our doghouse, and the cells in a paper wasp nest. These experiments were so interesting that I decided to measure other parameters, especially the sun’s ultraviolet and photosynthetically active radiation (PAR), the blue and red wavelengths that make plants grow. No data loggers were available for these applications, so I used the circuit in Figure B together with various DIY UV and PAR sensors.
The most interesting results from these logging projects came during one of my annual trips to calibrate instruments at Hawaii’s Mauna Loa Observatory (MLO). Prior to the trip, I modified 16 Onset Hobo loggers with the op-amp circuit in Figure B and photodiodes fitted with UV-B filters (Figure D).
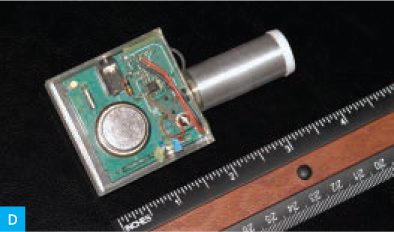
![]() Fig. D: Hobo data logger modified with UV detector (aluminum tube with Teflon diffuser cap) and current-to-voltage op-amp circuit on rectangular circuit board above the battery.
Fig. D: Hobo data logger modified with UV detector (aluminum tube with Teflon diffuser cap) and current-to-voltage op-amp circuit on rectangular circuit board above the battery.
I hid the modified loggers around the Big Island in places with full sunlight. Several days later I retrieved the loggers, which provided a record of solar UV-B between sea level and the 11,200-foot elevation of MLO. The MLO logger showed that cumulus clouds near the sun caused UV-B increases of up to 15%. Figure E shows the data on a clear day and on a day with clouds during the afternoon. This finding led to a report in a leading scientific journal (F.M. Mims III and John E. Frederick, “Cumulus Clouds and UV-B,” Nature 371, 1994).

![]() Fig. E: Effect of cumulus clouds on solar UV at Hawaii’s Mauna Loa Observatory (11,200 feet).
Fig. E: Effect of cumulus clouds on solar UV at Hawaii’s Mauna Loa Observatory (11,200 feet).
In Hawaii I’ve also measured the sun’s UV-B underwater and reflected by surf. Figure F shows a typical result when the sensor was mounted on a 12-foot pole and held over the surf: significant UV-B is reflected from ocean surf. When I repeated these measurements over a turbulent waterfall in Colorado, very little UV-B was reflected.
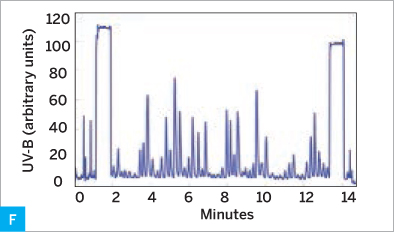
![]() Fig. F: Solar UV reflected from waves breaking on lava in Hawaii. The rectangular spikes at either end of the chart were when the UV detector was pointed upward toward the sun and sky.
Fig. F: Solar UV reflected from waves breaking on lava in Hawaii. The rectangular spikes at either end of the chart were when the UV detector was pointed upward toward the sun and sky.
During the May 10, 1994, annular eclipse of the sun, one of my modified Hobos monitored the sun’s UV-B. During peak annularity, the sun formed a thin ring of brilliant light around the moon for about five minutes. The highly diminished solar UV during this time is indicated by the bottom of the dip in Figure G.
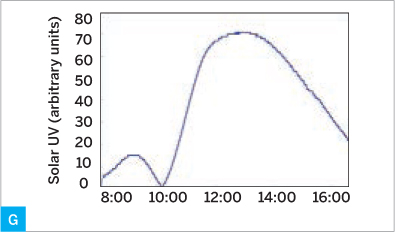
![]() Fig. G: Solar UV during the May 10, 1994, annular eclipse of the sun. Peak annularity is indicated by the bottom of the sharp dip in the graph, when for about 5 minutes the only sunlight was a brilliant ring around the moon.
Fig. G: Solar UV during the May 10, 1994, annular eclipse of the sun. Peak annularity is indicated by the bottom of the sharp dip in the graph, when for about 5 minutes the only sunlight was a brilliant ring around the moon.
NASA twice sent me to Brazil to monitor the ozone layer and other atmospheric parameters during that country’s annual burning seasons. Hobo data loggers modified to measure UV and PAR silently monitored whatever sunlight managed to leak through the smoky sky, allowing me to concentrate on measuring smoke and ozone. Figure H shows the PAR measured at Alta Floresta on a very smoky day and a cleaner day. When I left Alta Floresta for a remote camp on the Cristalino River, a concealed Hobo with a DIY sensor provided an important record of PAR during my absence.
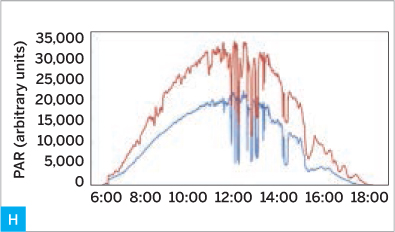
![]() Fig. H: The photosynthetic radiation (PAR) responsible for plant growth on a very smoky day (blue) and a cleaner day (red) at Alta Floresta, Brazil. Sharp dips indicate clouds at the sun.
Fig. H: The photosynthetic radiation (PAR) responsible for plant growth on a very smoky day (blue) and a cleaner day (red) at Alta Floresta, Brazil. Sharp dips indicate clouds at the sun.
Figure I shows two pyranometers (solar radiation sensors) at Hawaii’s Mauna Loa Observatory connected to an Onset U12-006. My recent work with these remarkable 12-bit loggers has led to new findings I hope to publish. The pyranometers were designed by my colleague Dr. David Brooks of the Institute for Earth Science Research and Education (IESRE) and are available as kits or assembled units at makezine.com/go/pyrano.
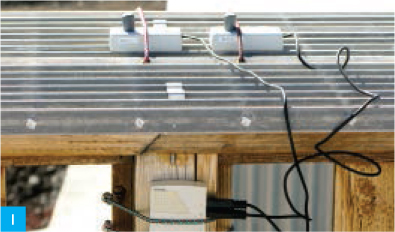
![]() Fig. I: The sunlight intensity measured by two solar pyranometers at Hawaii’s Mauna Loa Observatory is being logged by two of the four channels in an Onset 12-bit data logger.
Fig. I: The sunlight intensity measured by two solar pyranometers at Hawaii’s Mauna Loa Observatory is being logged by two of the four channels in an Onset 12-bit data logger.
Get Started Logging
If you want to do serious amateur science, data logging has huge potential. I recommend you acquire a basic temperature-sensing logger and start experimenting. The experience might inspire you to find entirely new logger applications. ![]()
Forrest M. Mims III (forrestmims.org), an amateur scientist and Rolex Award winner, was named by Discover magazine as one of the “50 Best Brains in Science.” His books have sold more than 7 million copies.