
Business Basics: Finance and Budgeting Are Not Just for Accountants!
Chapter Overview
Why do you need to know budgeting and finance? This chapter will answer this question by explaining some basic financial and budgeting concepts, why they are important for every manager to know, and how an effective manager uses these ideas. We will look at financial aspects of your organization which you need to know about to manage effectively. We start by reviewing why money is important to keep your organization and team running. We will explain budgeting and examine an example of a team budget to help you see what you need to track and manage. We will look at some financial measures for your organization and help you interpret them to understand the financial health of your organization.
Topics in this chapter:
- Why money matters
- Profit: What it means and why it is important, even in nonprofit organizations
- Budgeting for what you are managing
- Your budget: What does it look like and what does it tell you?
- Big picture financial health of your organization
- Recommendations for successful financial management
- Applying financial principles in clinical practices
- Chapter summary and key points
- Learning activities for this chapter
Why Money Matters
Jim Collins (2001), in his popular book, Good to Great, urges leaders to understand, “What drives your economic engine.”1 Think of money as the fuel that keeps your organization running. As we will see in the classifications below, the majority of hospitals in the United States operate as not-for-profit organizations. This is also the case for many community-based health clinics. This means they exist to serve community needs rather than to generate profit for investors. However, all organizations, even those that are driven by their mission to serve rather than to help investors make money, must generate or receive enough money to cover the costs of their facilities, employees, equipment, supplies, direct care activities, and all of the other expenses necessary to keep the organization running. This includes the costs of indirect administrative processes that handle information, billing, and reimbursement for patient treatment and overhead costs such as maintaining the facilities. The reminder, “No money, no mission,”2 is often heard particularly in not-for-profit organizations.
Classifications
Consider the percentage of health care organizations that are not-for-profit—existing to fulfill the needs of society and the people served rather than to generate financial returns for any private interests or investors—versus for-profit. Based on the latest survey of U.S. Hospitals in 2016 as reported by the American Hospital Association,3 of the 4,840 U.S. Community Hospitals4 included:
- 59 percent = 2,849 are Nongovernment Not-for-Profit Community Hospitals
- 21 percent = 1,035 are Investor-Owned (For-Profit) Community Hospitals
- 20 percent = 956 are State and Local Government Community Hospitals
There are more than twice as many nongovernmental not-for-profit hospitals as either investor-owned for-profit or state and local government community hospitals. Regardless of an organization’s mission and classification with regard to for-profit or not-for-profit status, money is necessary to cover all the activities and resources a health care organization relies on to deliver care to its patients.
Minding Your Business: Why Worry about the Money?
What are your beliefs and attitudes about managing money? You probably do this already in other areas of your life, particularly with a budget for home and family. The basic principles are straightforward as you ensure that you have enough money coming in or saved to cover your expenses. This is usually manageable when you understand where your money is coming from—your income—in the form of paychecks and perhaps other sources such as dividends or interest from investments and savings, rental income, and so forth.
And you incur costs for purchases plus recurring expenses such as rent or mortgage, car payments, other loans, and expenses for food, clothing, utilities, entertainment, and things like that. Maybe it is someone else in your family or household who manages the money, makes sure bills get paid each month, and that you are setting something aside for emergencies, later expenses, and the future (for example, college for kids, retirement for you). Still, you usually know how much money you need to cover your more immediate expenses, and it is a good idea to know what is in your bank account before you write a check, withdraw funds from an ATM, or charge a large purchase to your credit card.
Matching Clinical Practice to the Economics
Now, let us step back and see how these basic principles of budgeting and money management apply in running a health care practice. As Fred Michel, MD, observed, “We need to match our clinical practice to the economics.”5 This means operating efficiently and within our budgets, keeping an eye on our expenses (money being spent to operate the health care organization) relative to revenues (or income, the money coming in). There are many requirements and nuances of health care that can make it particularly challenging to manage and administer these economic issues, especially money matters that are largely driven by regulated funding sources such as public funds and private insurance companies.
A number of the people interviewed for this book noticed that many health care practitioners may prefer to avoid the business aspects of running their practices, or just may not feel they have the skills to do this effectively. This is not surprising, as many of us chose to enter clinical or medical professions because we wanted to help our patients or clients lead better, healthier, or happier lives, not because our primary motivation was to understand billing rules and accounting practices. Many of us enter our fields of wellness with limited business knowledge. Let us look at some key concepts that can help you understand important financial principles and apply them confidently for effective business-oriented management.
Profit: What It Means and Why It Is Important, Even in Nonprofit Organizations
From the report of the American Hospital Association at the start of this chapter, we have seen that the majority of hospitals in the United States are classified as not-for-profit (also referred to as nonprofit), and this is true of many other health care organizations that are not hospitals, especially outpatient community health centers providing safety-net services ensuring that people who need health care treatment and services receive them regardless of their ability to pay for them. Internal Revenue Code 501c(3) “provides exemptions for organizations organized and operated exclusively for charitable purposes, where no part of the net earnings inures to the benefit of any private shareholder or individual. An organization cannot be organized or operated exclusively for charitable purposes unless it serves a public rather than a private interest.”6
You may also hear such mission-based health care organizations referred to as nonprofit, not-for-profit, 501c(3), or tax-exempt organizations. Such organizations exist not to generate profits for shareholders or private individuals, but to provide benefits to the communities and patients they serve. And remember that nonprofit status does not mean the organization cannot or should not make a profit to cover its costs. In fact, it should generate enough revenue through billable services to patients, or receive enough funding through other sources (grants, private donations, or government funding) to cover its costs of operating! Generating a profit is important for the organization to sustain its important and beneficial work; qualifying for nonprofit status and tax exemption merely acknowledges that the organization serves the public good rather than the financial interests of any shareholders or individuals. Consider net profit (earnings before taxes), which is defined simply as:
Net Profit = Total Income - Expenses
When an organization’s net profit is positive, that means the organization produced enough revenue, or received other support, to cover its costs of operating.
Budgeting for What You Are Managing
Budgeting Begins at the Top
Budgets for the overall organization are developed at the executive level of the organization with guidance from the accounting and finance department, which provides the structure on revenue and expense categories along with data on actual revenue and expenses for past and current periods and forecasts of year-end results. They also develop the statements of the organization’s overall financial position—the balance sheet, income statement (profit and loss), and cash flow reports, along with other key ratios and metrics that describe the organization’s financial health and status.
You can find out where the overall financial statements for your organization are disseminated and distributed, and it could be worthwhile to schedule time with your accounting department to review them, discuss their meaning and implications, and discover levers for you to focus your team’s efforts on. Later in this chapter, we will look at these broader organizational financial statements, in which the summary-level budget for the overall organization may provide the capability to expand the details for specific items, departments, clinics, or teams.
More immediately, however, the key tool you need to work with directly as a manager is your budget for the specific teams or functions you are responsible for. This is where you allocate and track the money allocated to cover the costs of your team’s operations, and the revenues expected to be produced from the services (and possibly goods) provided to patients. Let us focus now on what you need to manage for your area of responsibility at the level of the team or clinic you manage.
Know What You Are Responsible for
Usually, if you have the responsibility and authority to hire and manage other staff members, you have a budget, but this is not always the case. Sometimes several teams or departments share a budget that is rolled up and managed by managerial leaders above you. As emphasized throughout this book, it is important for you to find out the extent of your responsibilities in your management role, especially for managing revenue and expenses.
If you have responsibility for managing any budgets, you should obtain, review, and verify your initial budget and ongoing periodic reports that show changes over time and current status. If you have not seen these, you need to request them from your accounting department. It is important that you check the contents and the formulas that go into your budget so you know or can ask for clarity about what is included and how things are calculated.
You cannot manage what you cannot see! I have known managers who were not aware they were expected to manage several particular staff members or clinical service components until they discovered them listed on their budgets—sometimes in error, left over from prior budget years, and other times accurately, but unbeknownst to the new manager.
How to Spend and Track
It is important to know how to spend company money for nonroutine needs that arise at work, outside of regular purchasing and ordering activities. It will empower you to make the spending decisions that are within the authority of your position without having to ask your manager about inconsequential purchases and expenses that you can handle yourself. Understand the difference between small, inconsequential purchases like a coffee maker or specialized office supplies, which you probably can initiate yourself, versus major investments for equipment costing hundreds of thousands of dollars, or multimillion dollar buildings, which require much more financial analysis and approvals at executive levels!
You probably will be able to order inexpensive items yourself such as a small replacement coffee maker for the staff break room or specialized office supplies that are needed to support a special project. Work with your purchasing department, especially for routine supplies for which they typically negotiate bulk pricing with their vendors and find out their procedures for handling nonroutine purchases and replacements. Find out what channels and processes you should use to buy and spend for the relatively inexpensive things your team needs, along with the cycles and deadlines for ordering routine supplies and nonroutine special items.
Before you make any nonroutine purchases or expenditures, you should know, or find out:
- Regular ordering and purchasing cycles
- Your spending limits
- Who else needs to approve and sign requisitions for special purchases
- What categories (accounts) in your budgets or other organizational budgets the expenses will get charged to
- How much is available (budgeted and not yet used) for you to use in the appropriate categories.
The more you understand about the budgets and financial resources you may access, the more effective you will be in managing your team’s work and handling the organization’s resources efficiently. Next, we will look at budget cycles to help you plan effectively to allocate financial resources.
Budget Cycles and Fiscal Year Periods
Budgets are usually developed for each fiscal year. They are prepared to begin at the start of the fiscal year, which might be something different from a traditional calendar year that begins on January 1. For instance, in Colorado, the state fiscal year runs from July 1 to June 30, so community health organizations that receive major funding from the Colorado Department of Healthcare Policy and Financing also follow this fiscal year. Some of the health care organizations refer to their fiscal years by the year at the end of the period; for these organizations the budget year for July 1, 2019 to June 30, 2020, would be referred to as Fiscal Year 2020 (typically referred to as “FY 2020.”) Others might include both the starting and ending year for clarity, so they would refer to it as FY 2019–2020.
For clear communications, find out the dates of the fiscal year in your organization and the correct way to refer to it. You also should ask about the timing and cycle for preparing and finalizing budgets so you can make appropriate and timely recommendations and input into it. This is crucial if you need to request more resources, especially staffing. It becomes very difficult to obtain such resources later if they were not budgeted anywhere (unless your organization follows a practice of rolling budgeting that makes adjustments as needed throughout the fiscal year based on changes in financial position.)
If your position, team, or department was created recently, your finance and accounting team might not have split it yet into a separate budget entity for reporting and accounting, especially if this change occurred after the start of a fiscal year budgeting cycle. Other exceptions could occur if new programs or services start up within a fiscal year (perhaps as the result of funding that becomes available through grants, major donations, or other sources such as unexpectedly high revenues and profit, or in response to crucial community or patient needs), or as the result of reorganizations that change structures and reporting relationships among teams or departments.
Your Budget: What Does It Look Like and What Does It Tell You?
The following budget example (Table 3.1) is based on a format used by one nonprofit community health care organization, with representative items in an annual budget for a hypothetical clinical team that delivers health care services for children and belongs to a larger nonprofit community health care organization containing several similar teams in different locations.

Budget Example
Let us suppose the budget was created in the fourth quarter of Fiscal Year 2018, after the end of the third quarter when data for the first three quarters of the year were reported and totaled, to prepare for budgeting for the next fiscal year, 2019. Financial values and other details were developed in this example to illustrate general budget concepts and explain some particular situations, and are not taken from an actual clinic. Before we look at the budget items in the rows, let us look first at the columns, which represent time periods.
Time Periods and Comparisons of Numbers: Column Headings and Their Meanings
The five columns with financial numbers in them represent what was budgeted (what was expected), what actually happened during the fiscal year, projections based on current status, differences between projected year-end budget performance and what was budgeted for the year (variance), and budget for the next fiscal year (shown in this example, but usually not shown in early periods of a current fiscal year.)
Budget for Current Year
The first, FY18 Budget, is shorthand for the current year budget (at the time represented in the example) for “Fiscal Year 2018,” the fiscal year that ends on June 30, 2018 for this particular organization that starts its fiscal years in July. Assume this is the current fiscal year of operation and the numbers represent the revenue and expenses that were allocated in the prior fiscal year when the budget was developed for this fiscal year’s operations. These are the revenues (or income) and expenses that were expected to occur in the current fiscal year.
Year-to-Date Progress
The next column header, YTD for Quarter 3, represents the numbers that have been reported, accumulated, and totaled for this budget year to date. In this example, the numbers are generated after the close of the third quarter, so the numbers represent three quarters of a full year of actual (not expected) operation.
Projected Results for the End of the Fiscal Year
The next column, Projected, represents the projection of year-end results for each revenue or expense item in this budget. This is simply an extension of three quarters of the year into a full year, dividing each number shown in the YTD column by 3/4. For example, if after three quarters of the year, the clinic had received revenue of $539,877 from Medicaid (Account Number 4540), then by the end of the fiscal year the expected amount of revenue received for the full four quarters would be $539,877/(3/4) = $539,877 × 4/3 = $719,836, which is shown in the column for Projected End of Fiscal Year.
However, you need to consider the things that typically occur in different quarters or seasons and will cause your actual year-end results to be different from this direct arithmetic calculation based on part of the fiscal year. Keep this in mind when planning so you realistically balance your income and expenses as they occur.
Variance
Variance represents the difference between the projected year-end numbers and what was budgeted for the fiscal year. Variance is favorable if you are bringing in more revenue or spending less than expected. It is unfavorable if revenue is lower or expenses are higher than expected. This is an important indicator for you to use to gauge whether your budgetary management is meeting, exceeding, or falling short of expectations. In the later subsection on observations about this budget, we will consider more closely what the variance in this particular budget reveals.
Budget for the Next Fiscal Year
This column, which is labeled ‘Budget FY19’, usually will not show up until late in the current fiscal year when it is time to budget for the next fiscal year. Let us assume for this example that we have completed the third of the four quarters in the current fiscal year and we are planning now for the next fiscal year. In this example, the organization bases its next year’s budget heavily on the projected year-end results obtained from the current year’s actual income and spending so far. Be aware that there are other methods of building budgets, but for simplicity, we start with this method for illustration and make adjustments as described below.
For many of the revenues and expenses in this example, the projected number for the end of the current fiscal year is simply moved to the budget for the next fiscal year. But in this case, let us suppose the organization has negotiated a 10 percent increase in the value of its Medicaid payment contract, so the number in the next column, $791,820, is calculated from $719,836 × 1.10 = $791,820. Likewise, for salary expenses, suppose the organization plans to apply a 3 percent Cost of Living Adjustment (COLA) to increase every employee’s salary by 3 percent. This is reflected in the higher amounts for salaries and expenses for FICA (which stands for “Federal Insurance Contributions Act”) in the next fiscal year 2019.
Chart of Accounts: Rows for Income and Expenses
The rows in this example show account numbers and descriptions that come from the organization’s chart of accounts (COA). The COA lists all the accounts available to record financial activities in the organization’s general ledger, which provides a complete record of all the organization’s financial transactions as money is received and spent to create financial statements such as balance sheets of company assets and liabilities, income statements (also referred to as profit-and-loss statements), cash flow reports, and other analysis. We will see examples of these organizational financial statements in a later section.
Your budgets might not show all the details from your organization’s chart of accounts, but be assured that there is a general ledger being used to record the organization’s incoming income (revenue) and expenses (costs), and track the organizational group (team, department, or cost center) associated with each item so the accumulated totals for each account show up in the correct budgets and reports.
For conciseness of this example, many typical details of account-level items were eliminated. Some organizations consolidate many of the categories—for example, rather than break out expenses related to payroll and benefits, your organization’s budgets might show just a percentage for “Employee benefits,” “Fringe benefits,” or something similar.
Your budget format will differ according to your organization’s standards and budget process, but the general principles will be similar. For instance, the Account Number column you see in this example represents this organization’s chart of accounts from its general ledger that is managed by the accounting department. Most organizations have their own systems or software packages that generate chart of account numbers and track the income and expenses that accrue to the accounts.
These account numbers are organized by categories—in this example, the items in the 4000 series refer to revenues produced by your team. The 6000 series refers to your team’s salaries and benefits. This budget example shows details of employee benefits such as payroll taxes, health insurance premiums, and insurance claims incurred by members of this team.
Income Sources
Health care organizations generate revenue from several kinds of income sources. We see in this budget example that this Children’s Health Care Clinic run by Team A has four sources of Revenue from Account 4320 for private insurance (nongovernmental), Account 4540 for Medicaid, and two federal grants shown in Accounts 4774 and 4779.
Insurance and Billing
Typically, a large portion of the revenue comes from public and private insurance, administered through contracts with payor organizations and fee-for-service billing based on treatments and procedures performed. Depending on the type of services provided and the patients receiving them, some services are paid for directly by the patients themselves. (There are no self-pay sources shown in this example.)
Grant Funding
The example shows the team is receiving some new federal grants for children’s wellness and prevention services. We see that the revenue for these grants is quite small compared to the other revenue sources from Medicaid and other insurance. Grants can be useful for helping providers start up new clinics and learn to operate new kinds of services, but very often the funding received does not cover the true costs of operating the program. Often there is an expectation from organizations that provide funding through grants that the funds will not fully sustain the ongoing operations, and the organization will learn to operate the programs profitably so they can become self-sustaining. If you are involved in applying for grants or managing clinical programs that receive grant funding, there are typically many requirements for tracking and reporting on your use of funding that are likely to involve additional administrative overhead expenses that give you a good reason to sharpen your budgeting skills! For more on grants, see Appendix A.
Expenses
Personnel Costs
From the figures in Total Personnel Costs and Wages we see that on top of direct salary to employees there is approximately 24 percent additional expense for employee benefits. This varies by organization, so if you want to plan your full staffing expense of the employees on your team, you need to find out from your human resources, payroll, or accounting departments what the average percentage is for fringe benefits and overhead expenses to be added to the salaries in your organization.
Example of a Mandatory Expense in Your Budget
Be aware that you will see in your budget some expenses that you cannot eliminate or control directly. For example, FICA (an acronym for the Federal Insurance Contributions Act) shows up as Account Number 6210, as part of the team’s personnel costs. It is a mandatory payroll tax that funds the federal Social Security and Medicare system that pays for retirement benefits, some disability payments, and Medicare health insurance.7 The calculation of FICA is simplified in this example as 7.65 percent of total employee wages. The actual calculation is more complicated with tiers of percentages applied at different ranges of salary; your payroll or accounting department applies the federal formula to provide the actual numbers for your employees.
Be aware that FICA is not optional or discretionary; the only way you can reduce its impact in your budget is to reduce the total amount of wages you pay your employees, or you might reduce the number of people who are actual employees on your payroll—for instance, outsource some work to other organizations or utilize self-employed consultants, but that will increase your expenses in other categories. FICA is just one example of several items that are assigned in your budget because of requirements outside your immediate control. Others include administrative and overhead allocations determined through higher-level financial analysis in your organization.
Other Operating Expenses
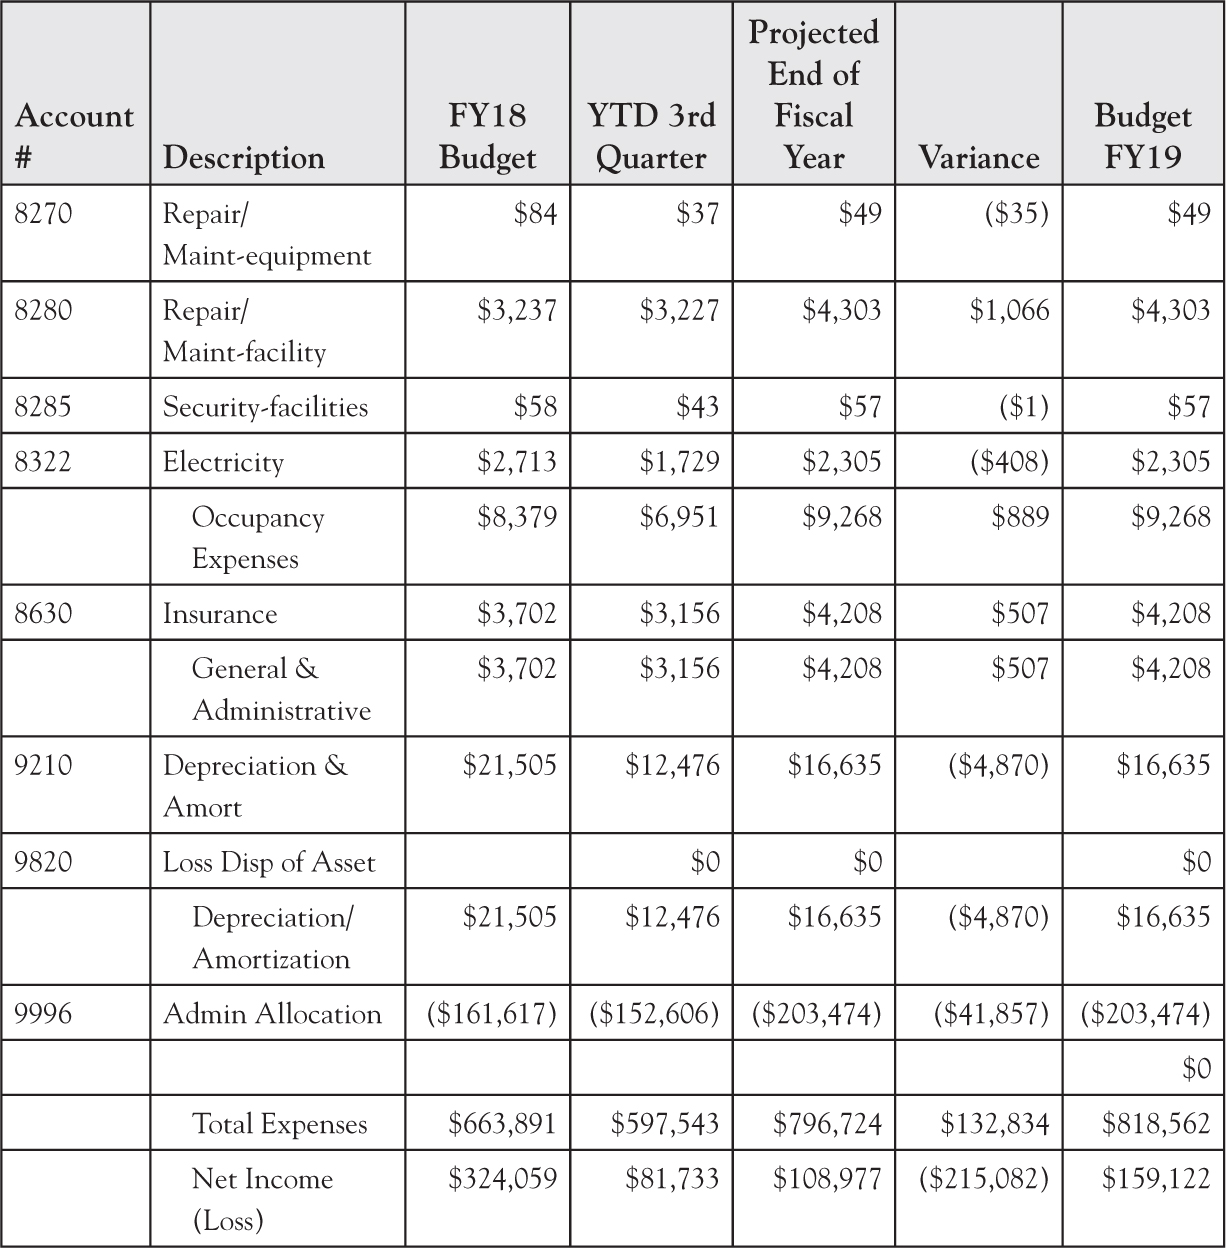
The 8000 series in this example contains other operating expenses incurred by or allocated to your team that are separate from employee salaries and benefits. The items in the 8000 and 8100 series are mostly things that are used by your team that you, as the manager are likely to have some ability to control or influence, although there will be exceptions. Other items in the 8000 and 9000 series are things that you do not control but still share in the overall expense to the organization, depending on how your accounting team allocates these expenses back to individual teams or departments. These are the expense categories in this example that total into the categories Occupancy Expenses (series 8200 and 8300), General and Administrative (8600 series), Depreciation and Amortization of major organizational assets (that could include buildings, furnishings, major equipment, and vehicles) in series 9200 and 9800.
Administrative Allocation
Then there is an Administrative Allocation, Account Number 9996 in this example, calculated by your accounting department. This operates like a credit to your budgeted expenses to acknowledge the organization’s need or commitment to support teams and departments that might be required to handle activities that cost more to operate than any revenue that comes in. This typically occurs in nonprofit organizations that provide treatment and services to underserved populations or to patients who are underinsured and unable to pay the full costs of their services and need the organization to extend charity care. Or it may be required to support needed and valued administrative departments and teams such as fundraising and public relations, billing and compliance, patient safety, quality management, information technology, and so forth.
Health care organizations need to invest in infrastructure and staffing with employees and technologies that do not provide revenue-generating health care services themselves to the organization’s patients but they build the processes and provide the labor to ensure that services are correctly delivered, recorded, documented, submitted, analyzed, and monitored internally so all the revenue is captured and flows smoothly into the organization. Often it is wise and necessary for the organization to increase its spending and investment in these supporting administrative functions.
For example, several years ago, community mental health care organizations in several states were feeling vulnerable to imminent intense federal scrutiny of their programs that increased the risk of high-impact audits that could require these organizations to return money that had already been collected for services delivered. Many of these organizations began to invest in increased internal audit programs and staff to interpret and ensure compliance with increasingly complex billing requirements. Thus, for the nonclinical departments responsible for these activities, the increased staffing increased the costs of their total wages and benefits, but the work they did protected the organization from serious fines and penalties that were likely to occur without the extra internal efforts and could seriously impact the organizations’ revenue and bottom-line profit. The cost of the extra staffing was less than the expected financial penalties that could lead to reduction in needed services to patients or prevent the even more disastrous risk of having to shut down altogether.
Observations about This Budget
Decisions and Impact Regarding Administrative Allocation
In the example of this clinical team, the Administrative Allocation credits some expenses and results in a profitable bottom line, which we see in the positive net income numbers: for Fiscal Year 2018 budget, the net income expected from budgeted revenues greater than budgeted expenses was $324,059. We know this was profit because the number is positive; if it had resulted in a loss, the number would be negative and expressed within parentheses as we see for the Administrative Allocation of ($161,617), which is, in effect, a negative (reversal of) expense equivalent to a positive credit to the budget.
Notice that at the Year-to-Date (column header “Quarter 3 YTD”) point, actual revenues are $679,276 and expenses are $597,543 after the Administrative Allocation reduced the total expenses by $152,606, resulting in a positive net income of $81,733. Without the Administrative Allocation, total expenses would be counted as $750,289 and subtracted from YTD revenue to result in negative net income of −$71,013, which would be expressed as ($71,013), with the parentheses indicating a negative value.
This illustrates that finances are managed at higher levels of the organization to allocate excess funds from profitable areas where revenues exceed their expenses, to cover others that do not generate revenue or do not fully cover their expenses. These are deliberate business decisions that organizations may make to balance the organization’s values and requirements to serve its patients and community when there are known factors that impact the capabilities of some clinics or programs to run profitably. However, be aware of expectations for your performance in managing expenses for the area you are responsible for. Expect that there will be rigorous financial analysis to compare the operations and performance of different clinical teams and programs that can result in consolidation, reorganization, or elimination of less profitable ones.
Expenses Exceeding Amount Budgeted
Another notable issue is the large expense for computer software that exceeded the budgeted amount. This could represent some new required capability for reporting associated with the grants or other activities. It would be desirable that the additional costs of the software could result in enhancements to staff productivity that could boost efficiency to increase services to patients. Note that very expensive items that are invested in and implemented over time, such as a full electronic medical record system, appear in a separate organizational capital budget where they are handled with different accounting rules.
A Closer Look at Variance and What It Signals
It is useful to consider variances, or differences, between what was expected and what is actually happening. Based on what has happened so far in the three quarters completed of the fiscal year, it is apparent that some budgeted sources of revenue—for Medicaid and the two federal grants—are projected to be higher than expected at the end of the fiscal year. The other one, for private insurance payments, is projected to be much lower. A quick analysis of the revenue numbers in the budget confirms this. The projected negative variance, shown as $(82,249) for total revenue is unfavorable and signals that the favorable variance for Medicaid and the two grants does not cover the projected shortfall in insurance revenue.
Furthermore, when we look at the total expenses at the bottom of the budget, we see unfavorable variance in expenses that are projected to be higher than budgeted. This resulting unfavorable variance in net income, shown as $(215,082) might signal a concerning trend that the team’s operations are becoming less profitable. Or this might be a case where this team’s work is supporting larger overall organizational goals, and the team is not expected to run as profitably while new foundations in practice and funding are being built to meet longer-term goals for community access and enhanced population health.
As we have discussed throughout earlier chapters, especially in Volume I,
Chapters 2 and 3, it is important for you to understand and manage such expectations. It could be helpful for you to track the work your team is doing, in terms that align with expectations such as increasing numbers of patients served, to provide visibility and recognition for the valuable contributions your team is making.
Budgets and Formats in Your Organization
Budgets for teams, departments, or clinics in most organizations are typically organized as a profit-and-loss (or income-and-expense) statement showing sources of revenue (income) and expenses (costs), as we have seen in our budget example. Your periodic statements of operations that you review regularly to track your ongoing financial performance may look similar in format. In this example and in many organizations, past performance is used as the starting point for building the next year’s budget. Other alternatives include zero-based budgeting in which assumptions and organizational needs are examined each year to determine what is actually needed at that point in time and the best way to allocate resources.
Generalizing Budget Concepts
The budgets you receive in your organization will look different in their details of some categories and descriptions, but many key concepts are the same.
- Revenue and expenses apply in the same way as you manage these items and make sure you are on track for your team’s operations within your organization.
- You might not see account numbers or columns like those in this example, as the structure of the budgets you work with in your organization are determined by accounting staff and the software programs they use to track financial information and develop budgets.
- In any case, you will see descriptions that tell you what each item represents.
- Many of the expenses relate directly to your team or area of responsibility.
- You are likely to see expense items listed in your budget that you have no direct control over.
Now that you understand the value of your local budget and how to manage it effectively, let us take a step back and look at finances for the larger organization so you see how your team’s work aligns with overall financial health.
Big Picture Financial Health of Your Organization
There are overall financial statements for your organization that help your senior managers, executive leaders, board members, and the community understand the big picture of how your organization is doing financially. Overall, is it healthy or in trouble? Are there important changes or trends to be aware of? Key changes to focus on include:
- Revenues that are going down from earlier periods to now
- Expenses that are going up
- Insufficient assets to cover what the organization owes
- Long delays in receiving payment for services that have been delivered
What is happening that contributes to these problems? We describe here the three key financial statements to review that help you understand the finances of the overall health care organization you work in and we show a representative illustration of each.
Cash Flow Statement
The cash flow statement answers the important question of where the organization’s cash went during a specified period of time. Cash flow is a particularly important issue in health care because of the high utilization of insurance payors along with governmental funds and other grants. Very often the ultimate consumer of services (the patient) is not the one paying for the services. With payment controlled by others and subject to administrative rules and often complicated processes, payments can be delayed and even withheld, which can limit our access to the resources we need to continue to run our clinics and facilities, pay our staff, and provide the care and treatment our patients need.
Mohr (2003) explains, “The cash flow statement can take many formats but the most common one breaks down the statement into three sections:
- Cash from operating activities. This could include the collection of receivables, payment of payables, and purchase of inventory.
- Cash from investing activities. This could include the purchase or disposal of equipment.
- Cash from financing activities. This could include borrowing new money from lenders, repaying debt to lenders, new capital investments from the owners, and cash distributions to owners.
The sums of all three sections of the cash flow statement plus the net income minus noncash expenses are combined to show the net increase or decrease in cash for the period.”8
Next, we illustrate a cash flow statement (Table 3.2). Numbers represent $1,000. Round numbers are used to simplify the illustration and make it easy to follow the calculations. Numbers in parentheses indicate expenditures flowing out of the organization, which are calculated as negative contribution to cash flow. For example, (3,000) represents the $3,000,000 spent on inventory.
This example shows that at the start of Fiscal Year 2017, the organization had $22,000,000 in cash.
- Operations:
In conducting its work of delivering health care services during the year, it received $34M and spent $23M in cash, for $11M net cash flow from operations.
- Investments
It conducted some investing activities by selling property and equipment that brought in $8M, and spending $20M on other property and equipment to result in net cash flow from investments of −$12M.
- Financing
There was some financing activity to repay a loan by spending $3M, which resulted in net cash flow from financing of −$3M. Totaling the results of these three types of cash flow activities shows that the organization had a −$4M net increase of cash. This means that in the Fiscal Year 2017 reporting period, the organization spent $4,000,000 more in cash than it received.

We see that the organization could sustain its ordinary operations through its positive net cash flow from operations. However, the large investment of $20,000,000 in property and equipment plus the loan repayment of $3,000,000 consumed more than the organization received for its investment and financing activities, and required using some of its cash reserves.
This example showed cash flow during a full fiscal year. Statements for shorter periods can show monthly accounts receivables (the money that is owed to the organization for services that have already been delivered) and accounts payable (the money the organization owes to its creditors for goods and services it has already purchased.) It shows the organization’s ability to pay current expenses, particularly as a function of the amount of money owed to an organization for services and goods that have already been provided and the length of time it takes to receive payment.
Remember that cash flow considers cash coming in along with cash going out of the organization. This is why it is often necessary to wait to purchase expensive new things until the liquid resources (which means readily available cash) are available to pay for them. Decisions to make expenditures that result in negative net increase in cash, like what we saw in the example, are made at high levels of the organization and often require approval of the board of directors or board of trustees of the organization.
Income Statement
The income statement is also referred to as a profit-and-loss statement. Think of it as the overall budget for the organization. It shows the difference between revenue (income) and costs (expenses), to show profit over a given period of time from service delivery to payment. Jeremy Donai (2014) provides financial definitions from the perspective of an audiology clinic. In his explanation, the income statement lists income (also referred to as revenue), which comes from services to patients and sales of merchandise such as hearing aids in his example, costs (also referred to as expenses), and the difference between the two, which is net income (also referred to as profits, or losses) over a given period of time.9
The income statement is where you can find out your organization’s overall profitability, as bottom-line profit and profit margin. You will also see the organization’s revenues and expenses. Expenses are categorized as
- Direct expenses of labor and supplies in delivering care and services
- Overhead or Indirect expenses incurred to run the business, such as rent, utilities, and administrative costs
Key results to focus on:
- Revenue – Expenses = Profit before taxes.
Profit before taxes –Taxes = Net Income (the “Bottom Line” profit).
Note that nonprofit organizations, meeting the requirements of IRS code 501c(3), qualify for tax-exempt status; for such organizations, net income is simply the difference between revenue and expenses. Thus,
- Net Income = Revenue − Expenses (for nonprofit organizations)
- Net Income = Revenue − Expenses − Taxes (for for-profit organizations)
- Net Profit Margin = Net Income/Total Revenue. (Multiply by 100 to express as a percentage.)
Net Profit Margin is a ratio of the proportion of Revenue that is needed to pay the expenses for the health care organization to conduct its work.
Net Profit Margin takes all business expenses into account. It indicates the percentage of income that remains after all expenses have been paid. Thus, higher margins indicate higher efficiencies. The organization must have enough revenue to cover its expenses. Too much expenditure on capital (for example, equipment and buildings) relative to income can put an organization at risk of financial failure; this would show up in lower net profit margin.10
Table 3.3 provides an illustration of an income statement.

Note that unlike in our cash flow statement, the income statement focuses on just the revenue and expenses from the organization’s operations, not including its separate activities for investing and financing. This explains why it is often necessary to wait until the organization’s financial position is in better balance before investing in major expenditures such as new buildings.
Often the income statement will show only one period of time. This example includes two fiscal years so we can compare changes in financial performance from one fiscal year to another. In this example, revenue increased. If the organization was providing more services to patients, we would expect revenue to increase along with the expenses for staffing, space, and equipment to provide and support those services. The net profit margin shows that the organization generated more net income from its service operations, so it appears to be handling its increased service capacity efficiently.
The two previous types of financial statements we covered, the cash flow statement and the income statement, looked at the organization’s financial activities over specified periods of time. This included its generation and expenditure of revenues and its acquisition and disposition of capital and investment assets. The balance sheet, in contrast, focuses on the assets and liabilities (debts or money owed) that an organization has at a particular point in time.
The balance sheet reveals the net worth (which may be referred to as shareholder equity in for-profit organizations) of the organization, as the difference between the organization’s assets that reflect financial value and liabilities that reflect what is owed, as a snapshot at a specific point in time. The key relationship is:
Net Worth = Assets − Liabilities, at a particular point in time.
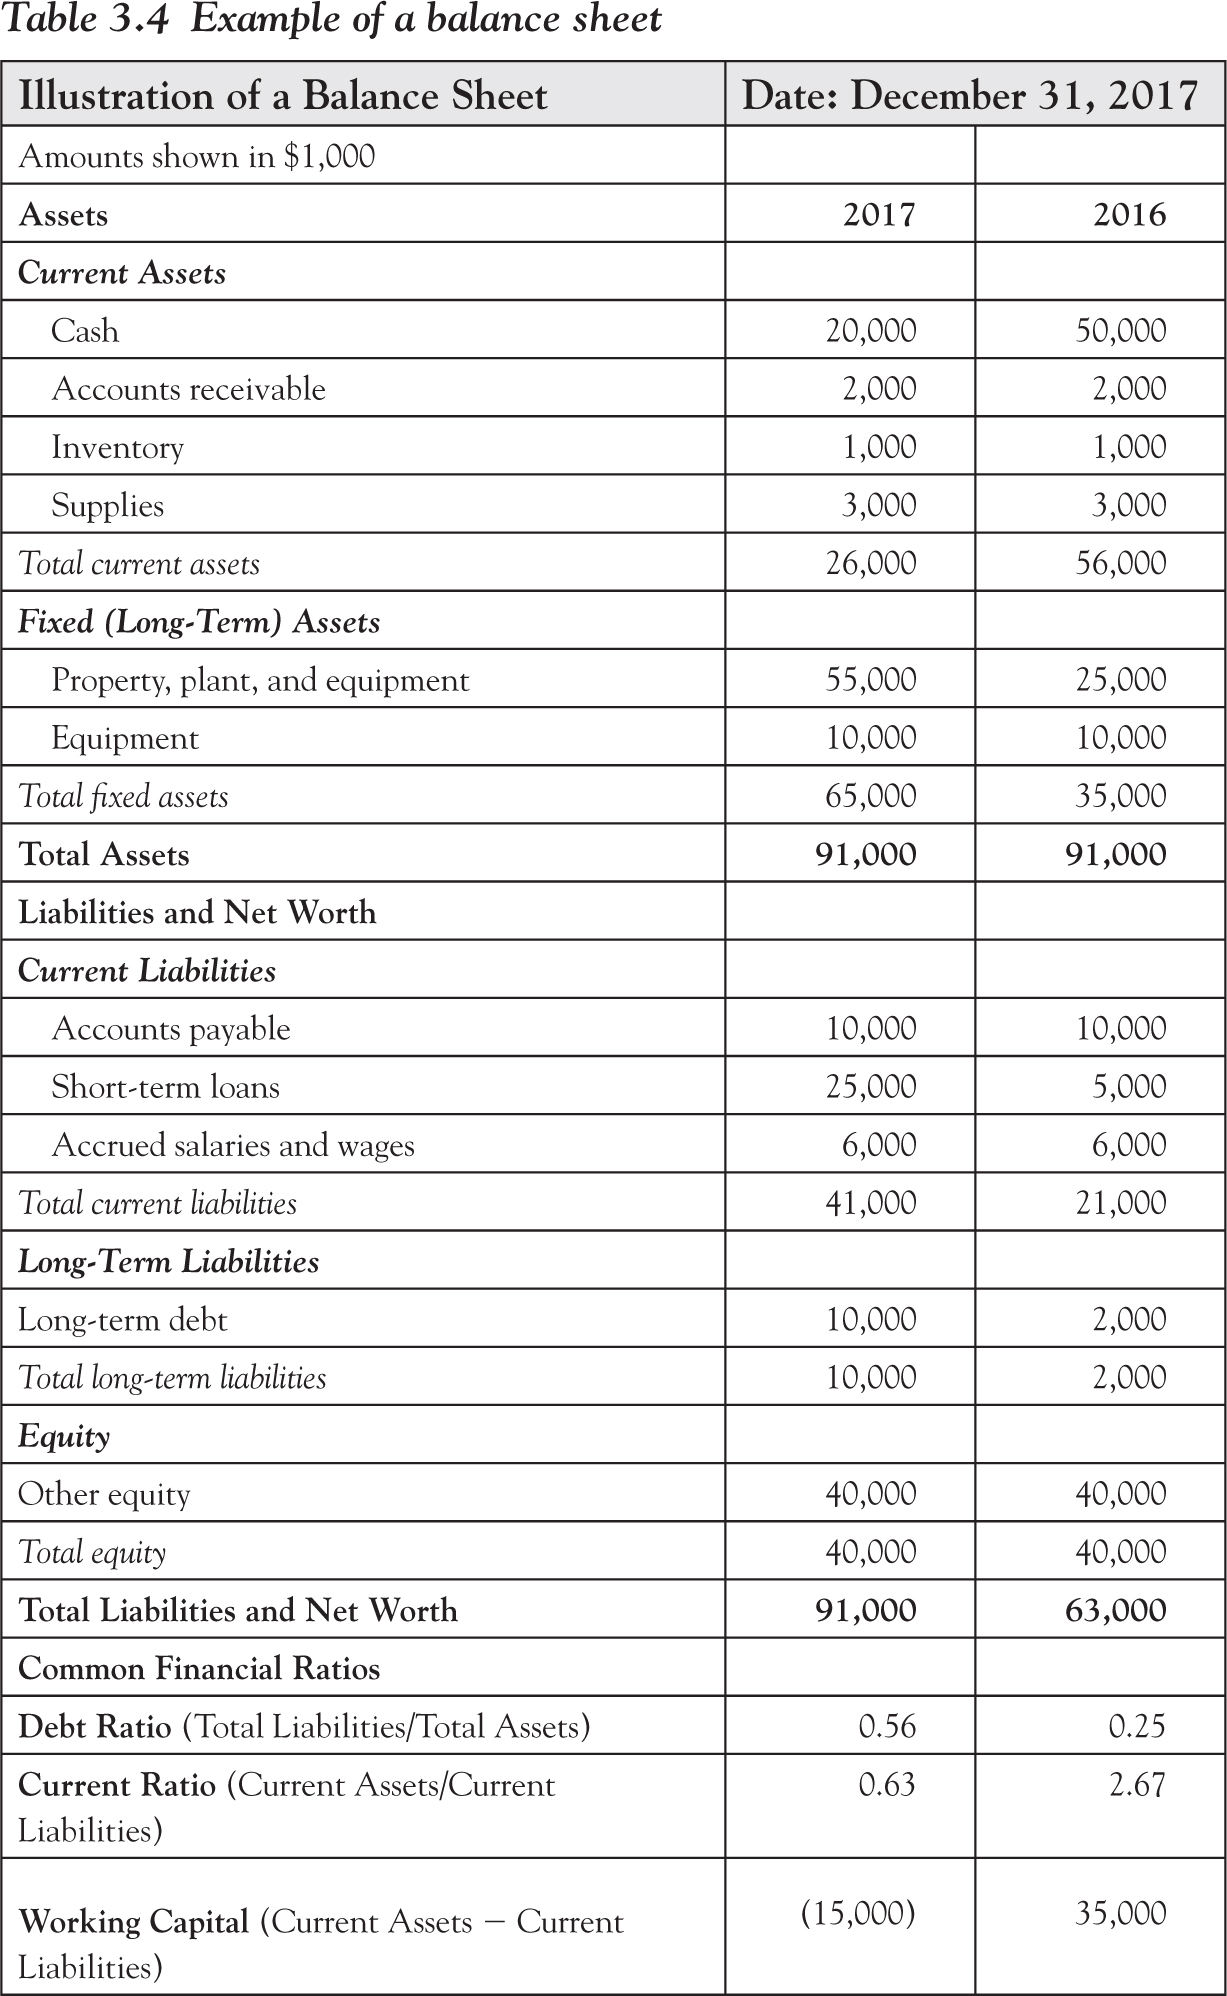
Table 3.4 provides an illustration of an organization’s balance sheet.
Remember, a balance sheet shows the organization’s assets and liabilities at one particular point in time. For this example, we display the numbers for the same point in time in two different fiscal years so we can see how an organization’s financial status has changed from one point in time to another (in this case, the halfway point of two fiscal years for an organization whose fiscal year runs July 1 to June 30.)
Notice that the organization’s total assets are the same from one year to the next, but there has been some movement of its cash, assumption of long- and short-term debt, and apparent investment in property and equipment. These activities might have been needed at the time to cover necessary expansion to meet growing needs for services. However, we see in the Common Financial Ratios that these activities changed the organization’s financial position for what it can afford to do next. It has assumed more debt, decreased its ratio of current assets to current liabilities, and has negative working capital because current liabilities exceed current assets.
Why are these ratios important? They signal the financial health of the organization. For those who might want to invest in the organization or provide financial support, these ratios indicate how solvent the business is, how likely it is to survive, and possibly how efficiently resources are being used. The ratios can be used to compare year-to-year performance, compare the financial performance of your organization to others of similar size and operations, and to demonstrate the financial health of the organization in applications to receive financial resources from lenders and others.11
Summary Comparison of Balance Sheet, Income Statement, and Cash Flow
Table 3.5 provides a comparison of balance sheet, income statement, and cash flow.

These statements can show you early warning signs that may help you recognize opportunities for you and your team to help your organization run better to improve its financial performance and service capacity. You might lead your team to find ways to increase revenue from billable services, or to reduce expenses by streamlining work processes and consolidating unneeded steps or supplies, or by documenting your work with patients more effectively to increase the speed and full value of insurance payments received. Being proactive helps you and your team increase and demonstrate your value to the organization. And you need to be aware ahead of time of financial challenges likely to lead to requirements for increasing productivity and efficiency that will affect your team.
Recommendations for Successful Financial Management
Now that we have looked at local budgeting and financial statements for the overall organization, let us synthesize what you have seen to highlight key points and formulate some recommendations.
Review Reports and Data
Make sure you understand the source of data and calculations that affect and appear in your budget. You should continually examine the variances in your operations, through the ongoing operating statements produced by your accounting department, to understand and plan for changes and differences between what was expected and what is happening. In health care, there can be many shifts and changes in funding models and payor sources, sometimes without a lot of prior notice. In our earlier budget example, it looks like something is changing in either the insurance enrollment of the patients served in this clinic, shifting some from private insurance to government-funded programs such as Medicaid, or there could be shifts in the number of patients being served, or other contractual changes that affect how much the organization gets paid for serving patients.
Be aware of the difference between favorable and unfavorable variances. When revenue is higher than budgeted, the variance is favorable, but when expenses are higher, that variance is unfavorable. Likewise, lower revenue is unfavorable variance and lower expenses are favorable. As we saw in our closer look at variance above, positive or negative numbers for individual accounts do not tell the whole story; they must be considered in the context of what the numbers represent, how they contribute to the bottom line, and in alignment with organizational operations and goals.
Do not wait for once-a-year budget processes to track what is happening—make it a practice to review financial reports and data at least as often as once a month, watch trends and changes, be sure you understand how reported information is calculated, and ask questions.
It is important for you to understand clearly what assumptions are made, what is included (and not) in the totals you see so you can focus on the right issues, be proactive in making needed improvements, and request corrections or changes if needed.
Understand Budget Drivers and Where They Are Tracked
For example, a major driver of oncology income is the volume of chemotherapy services. If this revenue from chemotherapy is reported in the Oncology Division’s budget, that division would look very profitable. If, instead, that revenue is reported in the overall hospital budget, then the Oncology Division would appear to be incurring more cost than the revenue it generates, which might make it vulnerable for reduction in its resources.
As another example, your team might deliver initial clinical assessment or emergency treatment services that are not fully reimbursed by payors for the true cost, so it could appear that your team is operating at a loss, when your team’s activities are actually enabling later revenue generation through other services such as surgery or other high-cost treatments that generate revenue for the organization. Looking at statements and reports for the overall organization results, and other tracking areas you may be able to request access to, can help you maintain awareness to explain or quantify the value your team’s work contributes to the organization.
Contributions and Alignment
Even if your team does not generate revenue directly from its activities, or the revenue it contributes to producing is tracked somewhere else in your organizational budgets, it is essential that you understand how much you and your team are expected to contribute to revenue production, how much money has been allocated for your team to operate, and how it is being spent.
Suppose you are responsible for an administrative or clinical support function such as quality, outcomes evaluation, employee training, or compliance that is necessary to the organization’s operations but does not provide any billable services to patients directly. For example, your team might perform analysis of clinical outcomes, for which your team might not accrue any payment directly, but the resulting information confirms the value of the organization’s treatment services, which helps the organization attract more contracts and funding.
When you understand the contributions your team is making to overall operations and financial health, you might request realignment of revenue and expense tracking to provide more accurate visibility and to support you in managing your revenue and expenses effectively, but you might not be able to influence accounting practices for allocation and reporting to the extent you would like. Thus, it is helpful for you to understand how your team’s activities support the overall financial health of the organization. The earlier section on big picture financial health will help you understand the bigger picture and how to use information about the organization’s finances.
Manage Reasonably and Spend Responsibly: Avoid Hoarding and Frivolous Spending!
Track and manage your spending throughout the year. Be reasonable and responsible to sustain your team’s work. Remember, as a manager, it is your job to ensure that your team has the tools and resources needed to do the work and achieve expected results. Spend what is necessary, and be a prudent steward of the organization’s money. Avoid delaying needed expenditures too long and ending the fiscal year with remaining funds that you should have utilized throughout the period.
Be responsible, but do not hoard and deny access to available funds throughout the budget year for the things your team truly needs; such practices can lead to panic-driven, ineffective spending at the end of the budget year when managers realize they need to use money that was allocated in a current budgetary year or lose access to the money until the next budget cycle. This can make you look frivolous and irresponsible in your spending.
Another danger of waiting too long to spend your available funds occurs if your organization develops its next fiscal year budgets using year-end expenditure projections from what has been spent prior to the last quarter. Your apparent frugality can set an invalid expectation for what you actually require to run your team effectively in a full fiscal year cycle.
Recognize Quarterly and Seasonal Variation
Do not assume that every quarter is like the prior one. Be aware of seasonal cycles and other variations that affect expenses or revenue. For example, flu season and the start of school years can add expense to stock extra medication for vaccines. Unexpected outbreaks of infectious diseases can increase service demand that results in extra overtime or temporary staffing, but might also generate additional service revenue.
On the other hand, demand for service can also decrease based on school year cycles and weather. Kids may be less inclined to come in for treatment during school holiday periods; kids and adults might avoid coming in during cold and inclement weather periods. On the expense side, conferences and external continuing education activities for staff might occur at certain times of year and add to expenses during those periods that are not repeated in other periods.
Generate Insights for Further Learning
As you look at how your organization is performing overall, you will gain insights, formulate questions about the value of your team’s contributions, and strengthen its alignment with the overall organization. This can be the perfect opportunity for you to get to know the members of your accounting department who can help you get and interpret numbers and information to master the skills to be an effective manager of the business of running your health care teams!
Applying Financial Principles in Clinical Practices
Now you have seen how to organize, track, and manage the financial resources that fuel the work of your team and organization. As we wrap up this chapter, let us reflect on how this impacts our clinical practices to benefit our patients. Here are some examples from other leaders in clinical settings.
Business Goals: Less Negotiable than Shared Patient Outcome Goals
When I asked my old boss, Carl Clark, MD, CEO of the Mental Health Center of Denver, about medical education and how it matched with running the business of health care, he explained that in clinical training, there is emphasis on engagement, treatment options, and negotiations. “You hope that you and your patient have the common goal of good health outcomes. Business goals, on the other hand, are not so negotiable. You need to make sure the right functions of the business are in place, in service to the operations of the business.” He explained the importance of understanding the levers and their effects on financial effects. For instance, understanding how to work with your organization’s cycle of payments to its vendors could impact the organization’s cash flow.12
Cash Flow’s Positive Effects on Services
When David Dobrzykowski, PhD, was working as a health care executive, he was able to free up cash flow, which allowed him to open up three more facilities for his organization.13 Another organization with a large annual budget found that if it could delay payments to its vendors from 30 to 31 days, it could increase the organization’s cash on hand by almost a quarter of a million dollars. Lisa Potter, MHA, MBA, explained that implementing consistent practices for collecting patient co-pays and fees up front improves cash flow and reduces expenses from having to pursue collections later.14 Generating cash can fund the resources needed to focus on delivering more and better care for patients.
Mastery of Business Principles for Financial Well-Being
Wellness practitioners who are running their own businesses know that their financial well-being depends on their mastery of business principles. Cherie Sohnen-Moe (2016), a massage therapist in private practice, explains how private practitioners need to know how much money their practice requires to start up and operate in the first and subsequent years. They identify the income they need to earn, the revenue they expect to earn from specific sources (direct services, training, consulting, workshops, classes, other products and services), and the costs they need to cover (rent, utilities, supplies, salaries, administrative services, marketing, insurance, etc.).15 Their mastery of the business components sustains the effective and enduring operations of their health care practices.
Julie Artigliere, PhD, runs a speech and voice therapy practice. Her costs of operating include paying for office space and administrative services such as patient scheduling and billing services. Her revenues vary with the rates paid by different insurance companies that cover the services to patients. For example, physicians’ diagnoses can impact the rates paid for patients covered by Medicaid and Medicare, and she has a separate contract with another insurance company that she bills directly and collects different rates, which changes her revenue and expenses for services to those patients. Setting appropriate wages for provider staff gets complicated because there isn’t one consistent hourly rate earned in services for all patients.16 Understanding the factors that contribute to the bottom line ensures continuing financial health that fuels the resources that support the continuing practice.
Healthy Finances Enable Healthy Patients
As these examples show, minding the money and finding efficiencies can help the organization do more with its resources. Dixie Casford, LPC, MBA, Vice President of Acute Care at Mental Health Partners, summed it up vividly as, “When we look at how to allocate funding and resources, we can put a face to every dollar.”17 In other words, we need money and other resources to continue to operate so we can provide our patients with the health care services they need.
Joanie Gergen, CRCR, Director of Revenue Cycle at Mental Health Partners, pointed out that implementing fee collection policies was helpful to the organization’s clients, too, in setting expectations for treatment and connecting with the organization’s goal to ensure positive client experiences.18 Thus, managing the business aspects of our health care organization ensures the financial health of the organization to support service availability and effectiveness for patients.
Chapter Summary and Key Points
Now that you have learned about key financial principles that drive your organization’s business, it can help you plan and manage the resources on your team, and point you toward areas where you and your team can impact organizational success. We worked through a budget example that illustrated the development of a budget based on the previous year’s operations and projections for the next year. You have seen illustrations of three key financial statements: a balance sheet, income statement, and cash flow statement. You learned some key financial definitions such as profit and fiscal year cycles, looked at relationships related to profit and loss and the organization’s cash flow, and saw examples of how that can help you serve your patients.
Key Points:
- Many health care organizations operate as “not-for-profits,” existing to serve the needs of their communities rather than generate profits for any groups or individuals.
- Regardless of profit motive, every health care organization needs to generate enough revenue to cover the expenses of running the organization and serving its patients.
- The organization’s balance sheet shows its assets, liabilities, and net worth at a point in time.
- The organization’s income statement, also referred to as a profit-and-loss statement, reports what the organization received (income or revenue), and what it spent (expenses and costs) over a specified period of time.
- The organization’s cash flow statement shows the organization’s ability to pay current expenses, particularly as a function of the amount of money owed to an organization for services and goods that have already been provided and the length of time it takes to receive payment.
- The balance sheet, income statement, and cash flow statements shed light on an organization’s earning and spending that drive budgeting and buying decisions.
- Your budget helps you plan and allocate the resources that are needed for your team to do its work.
- You can track and manage important parts of your managerial performance by reviewing your team’s budgeted and actual financial activities.
- Organizations operate on fiscal year cycles, which drive your planning and budgeting activities. Know when the fiscal year begins in your organization—it may be at a different time of year than the January 1 start of the calendar year.
- Track and manage your spending throughout the year. Be reasonable and responsible to sustain your team’s work. Avoid delaying needed expenditures too long and risking loss of the funds when the fiscal year ends.
Learning Activities for This Chapter
Here are some questions to consider that can help you understand the business aspects of your organization and your managerial role in it. This will help you identify what you need to know, where you can find out, and think about how your knowledge in these areas is beneficial to your team, organization, and your direct success as a health care manager.
- What is the mission of your organization? Why does the organization exist, what purposes does it serve, and who benefits?
- For financial purposes, how is your organization classified? What are the implications? Even in not-for-profit, mission-based organizations, keep in mind the saying, “No money, no mission!” What does this mean in the context of delivering health care services in a not-for-profit health care organization?
- What is charity care and how much of your organization’s services are in this category?
- Do you believe that minding the money is someone else’s job? To what extent? How much of the responsibility is yours?
- In your organization, who keeps track of the financial health and operational details of revenue and expenses? What resources and information do they have that can help you manage your teams’ budgets effectively?
- How do you and your team impact the financial health of the organization? What do you contribute to:
- Income (also referred to as Revenue), and how—through what activities?
- Expenses—consider the costs of operating your team, and things your team can do to manage costs.
- Grants can help fund new clinics, programs, and research. Should you always pursue and accept grant funding? Why or why not? What is your organization’s history of successfully applying for grants and utilizing the funding? For more information on grant funding, see Appendix A.
Here are some activities to help you apply these subjects to your business management responsibilities in your organization.
- Get copies of your team’s budget from the previous and current fiscal years. What has changed and what factors contributed to changes in revenue, expenses, and staffing?
- Find out from your accounting department where to get operating statements or other available information that shows you year-to-date financial performance relative to your budget.
- If things continue at the current rate of revenue and expense accrual, what are your projections for year-end results (at the end of your fiscal year)?
- Are there variances and trends you see that signal there are actions you need to take now?
- To be more effective in your budget and financial performance, what things should you Start, Stop, and Continue doing?