
In this chapter, we will take a further look at Revit's Conceptual Design tool and how you can leverage it for sustainable design analysis. We'll also explore some tools with Revit and some that use Revit's BIM geometry to support sustainable design analysis.
Revit has a number of tools that support sustainable design processes and analysis, ranging from accurate material takeoffs to energy analysis to daylighting. As you move from a more traditional design workflow to Revit, you will see more opportunities to engage environmental simulations within the Revit model. This ability to see the model from different points of view makes a BIM project perfect for exploring sustainable design strategies. We will explore how Revit can help support those strategies.
In this chapter, you'll learn to:
Environmentally thoughtful design strategies have been around for millennium, but the practice of sustainable design has seen substantial growth over the past few years. Sustainable design practices can help address many issues, among them energy use, access to natural daylight, human health and productivity, and resource conversation. One of the principal goals of sustainable design is to reduce a building's overall resource use. This can be measured in the building's carbon footprint (http://greenfootstep.org), or the net amount of carbon dioxide emitted by a building through its energy use.
An important factor in sustainable design is the large effect that the construction industry has on the environment. The United States, for example, uses 25 percent of the world's energy, and the U.S. building industry uses 40 percent of global energy. Buildings, taken together, are the largest single resource consumer in the world. To solve the problem of global warming, you need to look at the low-hanging fruit of the architecture, engineering, and construction (AEC) industry and work toward a more efficient, more sustainable building practice.
Before we delve into discussing any specific workflows involving BIM and sustainability, it's important to recognize that many concepts are both interdependent and cumulative. The more sustainable methodologies you can incorporate into a project, the "greener" the project becomes.
Take the example of building orientation, glazing, and daylighting. Rotating your building in the proper direction, using the right glass in the correct amount and location, and integrating sun shading into the project to optimize the use of natural light all build upon each other. Using these three strategies together makes a building operate more efficiently while allowing occupants access to plenty of natural light. The amount of usable daylight you might capture will be greatly reduced with highly reflective glass or if the building faces the wrong orientation. The appropriateness any of these individual strategies and the benefits depend on building type and climate.
Revit has similar characteristics. Because it is a parametric modeler, all the parts are interrelated. Understanding and capitalizing on these interrelationships typically take numerous iterations that span multiple projects. Optimizing the integrated strategies and technologies for a high-performance green design requires a continual look at understanding of how they work together to deliver the best potential. That is where Revit comes in—allowing the ability to iterate and analyze faster than in a more traditional process. The process is built on the following methodology for reducing the energy consumption of buildings:
Understand climate.
Reduce loads.
Use free energy.
Use efficient systems.

Like poor ecology, poor BIM modeling can have a negative impact downstream on team members and project stakeholders. If you are choosing to use your model for sustainable design analysis, remember that the more accurate you are in your modeling, the more accurate your results will be.
Conversely, a poorly assembled model will deliver inaccurate results. If you do not establish the proper materials in a daylighting model, for instance, you will not get the right reflectivity and therefore your daylighting results will be inaccurate. If rooms and volumes are not established properly within the Revit model, your energy performance will be off. These faulty results can prompt you to make changes in your design that are incorrect or unnecessary.
It is a good idea to establish early on in your modeling process which sustainable design analyses you will be performing based on your Revit model geometry. It is much easier to set the model up for successful analysis when you begin than it is to go back and have to make significant changes to the model midstream to perform analysis.
You can repurpose many tools in Revit for other uses. Schedules are a great example of this. In Chapter 5, we discussed how to use schedules to track quality control of the model. Schedules are also a useful tool in sustainable design. Schedules can help track the amount of materials in the design process. If the design is looking to achieve a Leadership in Energy and Environmental Design (LEED) certification (www.usgbc.org/leed), one of the possible points is for the use of recycled materials. Based on how LEED calculates their recycled content requirements (by volume and cost), some of the key materials for recycled content tend to be steel and concrete. Although the schedules created in Revit are not usable for LEED credit submissions in this case, knowing how to calculate recycled content within a project can help steer the project goals during the design phase.
In this section's project, pretend you want to use fly ash, a by-product of steel manufacturing, in your project as recycled content. Fly ash was first used as a concrete additive in 1929 in the Hoover Dam. Since your building has a primarily concrete structure, you can easily calculate the amounts of fly ash using schedules.
To create this schedule, open the Chapter 10 Jenkins.rvt file. You can download this file from the book's companion website (www.sybex.com/go/masteringrevit2011).
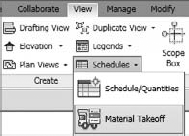
Select the View tab and choose the Schedules fly-out. In this menu, select Material Takeoff, as shown in Figure 10.1.
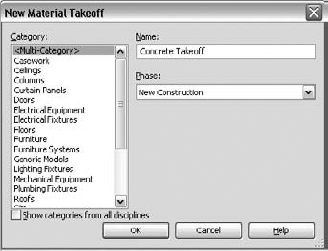
The New Material Takeoff dialog box shown in Figure 10.2 appears. Rename the default schedule name to Concrete Take-off.
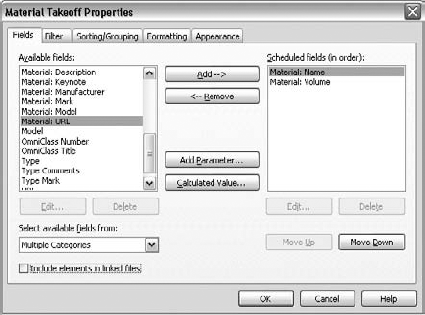
Now you want to add a couple of fields. Choose Material: Name and Material: Volume from the list on the left. Using the Add button, add them to the column on the right (Figure 10.3).
Now, still on the Fields tab, click the Calculated Value button. Clicking this button opens the Calculated Value dialog box, which allows you to add custom fields that contain equations. You cannot only leverage some of the features of Revit's database structure, but also create fields in your schedules that are formulaically based on other content. In this dialog box, name the value Recycled Content and change the type to Volume, as shown in Figure 10.4.
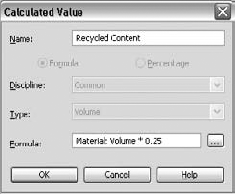
At the bottom of the Calculated Value dialog box is a blank field for the formula. This field directs Revit on how to perform the calculations. In this project, you want to calculate the volume of fly ash in the model. So, in Revit terminology, you want to create a formula using the Material: Volume and multiply that against the amount of fly ash you want to use in the construction. To create this formula, you can either type the formula in directly or select the fields you want to perform calculations against using the field selection button

For this project, your goal is to include 25 percent fly ash in our concrete mixture. Since you have just selected the Material: Volume field, you need to finish the equation. To do this, multiply by 0.25 so your final equation will look like Figure 10.6. Click OK.
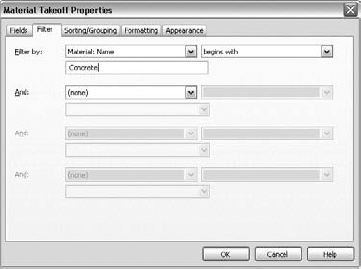
Now that you have your fields defined, you need to visit the rest of the tabs to define your schedule. The next tab is Filter tab. So far, you haven't defined what materials you want to see in your schedule—you are currently showing all of them. In this example, you want to filter out all but concrete as a material. In the Filter By field, select Material: Name. In the drop-down next to that, select Begins With and in the field below the Material: Name, type Concrete. Your filtered schedule should look like Figure 10.7. This will schedule only materials that begin with the name Concrete. Filtering in this way can be more effective than filtering for an exact name because it allows for some variety in the material names. If you are working on a project team and one team member has called the material Concrete – Cast in Place and another team member has created a material called Concrete – CIP, this schedule will include both.
After you complete the Filter tab, select the Sorting/Grouping tab. In this tab, choose to sort by Material: Name (Figure 10.8). You also want to select the Grand Totals checkbox at the bottom of this tab.
The last tab you'll need to adjust is the Formatting tab. Select this tab and highlight Material: Volume in the column on the left. Here you can adjust the alignment of the Material: Volume field. From the Alignment drop-down, choose Right. You want to see the columns calculate their totals. To do this, choose the Calculate Totals checkbox. This checkbox is activated individually for each column. You want to make the same adjustments for the Recycled Content field (Figure 10.9), both right-justification and calculating the totals.
Now that you've completed all of the formatting and calculations, you can see the results of the schedule. Click OK, and the schedule will generate a single line, as shown in Figure 10.10. The new Concrete Take-off schedule shows the name of the material, the cubic feet of concrete in the project, and how much fly ash would be (calculated in cubic feet) if you use 25 percent of the volume of the concrete. This schedule will continue to dynamically update as you add or subtract concrete from the overall design, giving you an up-to-date amount of fly ash.


The window-to-wall ratio (WWR) is the percent of glazing you have on any given façade versus the amount of unglazed area. Knowing this percentage can help determine the ideal amount of glazing you will want on each façade to maximize the efficiency of your HVAC system coupled with your glazing area. The exact percentage of this number will vary depending on your building use, longitude, and façade orientation. Working directly with your mechanical consultant, you can arrive at a goal percentage for each primary building façade.
As a general rule of thumb, it's best to minimize east/west exposure and maximize the north/south exposures if the building site allows. With south exposures, it's easier to control the amount of daylight entering the building with the use of sun shading. North exposures have limited, if any, direct solar exposure. Since the sun rises and sets on the east/west sides of the building, there is a full arc of daylight (from the peak of the azimuth to the horizon) over the course of the day, making those exposures the most challenging to moderate.
In the sample Jenkins building project, you have an adjacent building proposed next to the existing one. In this scenario, you have been modeling a proposed new building form in Revit's conceptual massing. While doing so, say you've been working with your mechanical engineer to establish the ideal WWR for your primary façade. You now need to calculate the amount of façade you have per floor so you can begin to add glazing to the design.
During conceptual design, the focus was more on the building form than the exact locations of the floors relative to the existing building. Since the form was created as a conceptual mass, the only datum established was the ground plane. To view the sample building addition, open the JenkinsAddition.rfa file located on the book's companion web page (www.sybex.com/go/masteringrevit2011). Open the Jenkins Building model and load the JenkinsAddition.rfa family into the file, placing it to the right of the primary façade (Figure 10.11). Now you're ready to create a quick schedule to run these calculations.

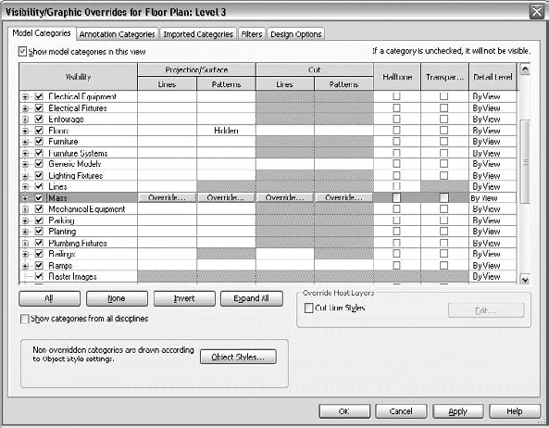
The first thing you might notice when inserting the mass into the model is that the mass isn't visible in each of the views. You need to turn on the visibility of the mass so you can see it in all the views. On the Massing & Site tab, click the Show Mass button. This will highlight and stay highlighted until turned off and allow you to see the inserted mass family in all the views (Figure 10.12). This is a unique feature for masses; activating this button will allow you to see the masses, but remember that if you don't select Mass in the Visibility/Graphic Overrides dialog box, it won't show up when you print the views, even though you'll see it on the screen.
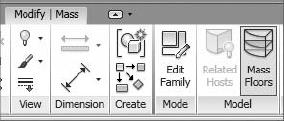
Since you didn't add any levels to the mass, you need to project the levels of the original building into the addition and create floors. You want to ultimately create a schedule showing WWR by floor so you have more control over glazing areas. But first you need the floors projected into your mass. To do this, select and highlight the mass. The Modify | Mass tab will appear, Click the Mass Floors button (Figure 10.13).
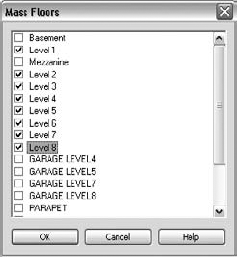
Selecting this tool will open the Mass Floors dialog box. Since you want one floor in the addition for each floor in the main model, select Levels 1–8, as shown in Figure 10.14. In addition, you're choosing to incorporate a double-height lobby space, so do not select the mezzanine level.
Click OK to populate the mass family with floors, similar to Figure 10.15.
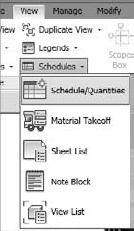
Now that the floors are established, you can create a schedule that will report some key information about the mass and the new floors. You can use scheduling to not only help you find the wall-to-floor ratio (so you can establish WWR) but also the actual area of each new floor plate. To start this, choose Schedule/Quantities from the View tab (Figure 10.16).
From the list of schedule categories, choose Mass Floor and give the new schedule a distinctive name (Figure 10.17).
Similar to the last schedule you created, you need to select some fields to populate the schedule. Choose the following fields:
Level
Floor Area
Exterior Surface Area
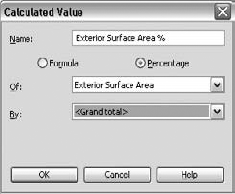
You also want to create a new Calculated Value. Click the Calculated Value button and name the new field Exterior Surface Area %. Select Percentage from the radio buttons and from the Of drop-down, select Exterior Surface Area (Figure 10.18).
The finished Fields tab will look like Figure 10.19. Now, select the Sorting/Grouping tab.
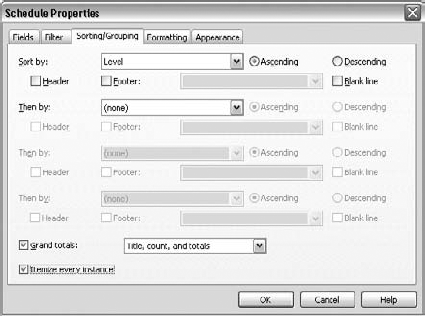
On the Sorting/Grouping tab, you want to see the floors in order, so choose Level from the Sort By drop-down (Figure 10.20).
As a final adjustment to our schedule, you want to select the Formatting tab. For the following fields, change Alignment to Right and select the Calculate Values box (Figure 10.21).
The finished schedule for this mass will look like Figure 10.22. You will see you were able to quickly calculate the floor area available by level in the mass as well as the exterior wall area. The Exterior Surface Area % tells you how much of the existing wall area each floor occupies. Using this, you can work with your mechanical consultant to better determine how much glazing you should have by façade and floor.


Good sustainable design optimizes the use of natural daylight within the building, thereby minimizing the need for artificial lighting. While letting in the natural daylight, it's good to mitigate the amount of direct light coming into the building because sunlight directly entering a building becomes heat and that heat then needs to be conditioned or taken into account for HVAC loads.
You can see even in this project the difference in direct sun exposure on the glazing at different times of year. Figure 10.23 shows the sun striking the building at noon on the equinox, while Figure 10.24 shows the sun hitting the building façade during the summer solstice. The deeper windows in this façade help to add some shading to the glazing.

Sun studies are views that can be stills or animated that help you visualize the solar exposure and sun shading on the building. These views can be created in interior or exterior conditions and help to demonstrate the course of the sun over the length of the year. By creating camera views at key locations within your model, you can see the resulting sun and shadows over the course of the day or year. In Figure 10.25, you can see the difference in the sun between the summer and winter solstices (June 21 and December 21, respectively).

Remember that once the views are established, you will be able to revisit those same views as the design evolves so you can regularly see how the sun affects the new building form from the same angle.
Open the Jenkins building model in the Chapter 10 folder on the book's companion web page (www.sybex.com/go/masteringrevit2011), and let's create a few views to study the sun on the building interior and exterior. First, you need to establish a view in which to see the building.
Set up a camera view by selecting Level 3 and creating a camera view. Click at the lower left of the plan, then the upper right. This will create a camera view with a similar view angle to Figure 10.26. Name the view Solar Study from the North.
Before you turn on the sun, you need to turn on our mass. By default, the mass you placed earlier is not visible. Open the Visibility/Graphic Overrides dialog box by pressing VG on the keyboard and on the Model tab, select the Mass checkbox (Figure 10.27). This will allow you to see both the existing building and the new mass form.
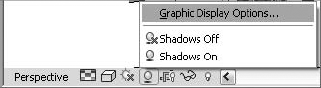
By default, this view will look like a colorless perspective. You will adjust this as you add shade and shadow to the perspective. Now that you have a view established, click Graphic Display Options in the status bar at the bottom of the screen (Figure 10.28).
In the dialog box that opens (see Figure 10.29), we're going to adjust some settings, but to get started, click the

This will open a new dialog box that will control the sun settings (Figure 10.30). In this dialog box, you can control time of day, direction of the sun, and location of your project (longitude and latitude), among other settings. You can also control if you are going to see the sun placed at a single time of day or multiple times over a day, week, or year in an animation. There are four settings to choose from:
Still casts the sun at a specific time of day based on the parameters you choose.
Single-Day allows you to animate the sun and export the animation to an AVI file to show it over the course of a single day.
Multi-Day casts the sun in the same position (same time of day) over the course of multiple days and can also be exported to an AVI.
Lighting uses Revit's lighting families. The other families are sun based and will not activate any inserted lighting.
You'll get to the animation in a bit, so let's start with a single view first. You're going to choose to see the sun and shadows on the summer solstice to begin.
Click the Still radio button.
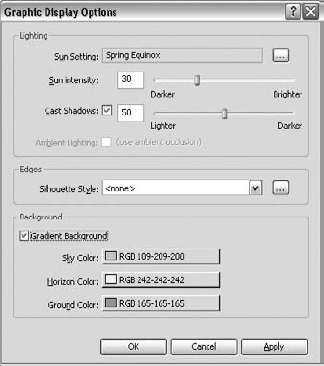
Choose Summer Solstice from the Presets. This won't have all the settings correct, but once you put them in place, it will be set correctly for our location.
For the building location, choose your area. We have chosen Kansas City, MO.
The date and time for the solstice is June 21, 2010, and we'll set the time of day to 3 p.m.
By default, there is no ground plane selected. Without a ground plane, there's nowhere for the shadows to fall on the ground (sometimes you might not want to see those shadows). For our setting, choose Level 1. Click OK.
Now you are back in the Graphic Display Options dialog box. There are a couple more options you'll want to select. First, select the Cast Shadows checkbox. This will turn the shadows on and they will fall based on the settings you just established. The other checkbox you want to select is Gradient Background. This controls the color of the ground plane and the horizon in 3D views and helps to add a bit of visual depth to the images. It also helps to make them not "float" by applying a ground plane for them to rest on (Figure 10.31). Once this is done, click OK.

The finished view will look like Figure 10.32. After you create these settings, you can quickly toggle the shadows on and off using the other two selections from the Graphics Display options in the status bar. Remember, turning the shadows off will allow the view to render more quickly if you make any modifications to the model.

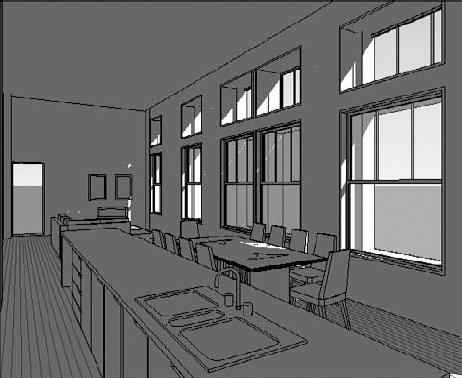
Once this view is complete, it's quick work to make other views using the same settings and visualize the building shading from various angles. In our model, let's choose two other angles: one from the third floor again looking from the south to the north (Figure 10.33) and one from the third floor inside the kitchen (Figure 10.34).
Adding shading to the view is not much easier to establish. Since you've already applied the settings to a previous view, all you need to do is select Shadows On from the View Control menu, and Revit will apply shadows to the view from the previously used shadow settings. Our exterior view will now look like Figure 10.35.


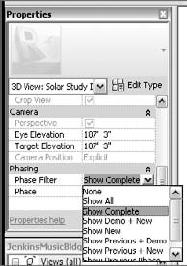
Apply this same setting to the interior view, and it will deliver some odd results—your windows won't be clear; they'll be solid. Whenever you are working in Revit views, it's important to know what phase you are working in as well as how phasing will affect visibility. Since the original building was created in an Existing phase, those materials render as solid in 3D views. To change this, select the view crop region and scroll down in the Properties Palette on the left. Change Phase Filter to Show Complete, as shown in Figure 10.36.
This will put all the materials shown within the view in the same state (a current or finished one). Now the finished view should have transparent glazing and look like Figure 10.37. You can see that even in this view, sunlight inside the space at this time of day is somewhat limited.
Creating a solar study is a great tool to visualize the effects of the sun at various times of day on a building. But what about being able to watch the progress of the sun over the course of the day, week, or year? Fortunately, Revit has the ability to animate the solar studies so you can see the progress of the sun and its impact on the building.
Any view with Shade and Shadows turned on can be animated to show the sun over time. To access these settings, choose Graphic Display Options in the status bar (Figure 10.38).

Using the same method you used for the still solar study, choose Sun Settings in the Graphic Display Options dialog box. This will bring you back to the Sun Settings dialog box you used for the still. This time, let's select one of the other options. You can choose one of the following:
- Single Day
Create single-day studies with the settings on the Single-Day tab. These settings will show the effect of sun on a specific day at various intervals (15, 30, 45, or 60 minutes). By setting the date and checking the Sunrise To Sunset box, you'll be able to animate the effect of sun on your model.
- Multi-Day
The settings on the Multi-Day tab are just like the settings on the Single-Day tab, but the interval is days, weeks, or months, and you can see the effect of sun over the course of an entire year. To create a multi-day sun study, we will follow steps very similar to a single day study. Figure 10.39 shows the configured Sun Settings dialog box.
For this exercise, let's choose the Single Day study. We'll work with the solstice again, but you need to modify some of the settings from the last solar study.
Choose the Single Day radio button.
For the building location, choose your area. We have chosen Kansas City, MO.
The date and time for the solstice is June 21, 2010, and we'll set the time of day to range from 5 a.m. until 9 p.m.
Set the ground plane to Level 1. Click OK.

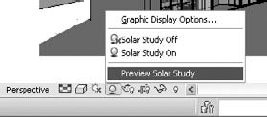
Your solar study will now look like a still; however, you will have a new tool available in the status bar. Select the Graphic Display Options button from the status bar, and you'll see a new option: Preview Solar Study (Figure 10.40). Selecting this will give you tools for video playback, similar to your DVR or iTunes, under the Ribbon.
Using this method for playback will be choppy because Revit will need to render each of the frames. A more fluid way to view the animation is to export it as an AVI and view the animation in its totality.
The solar study is easy and quick to export. To do so, click the Application button and select Export
Choosing this option will give you a standard Save As dialog box, allowing you to name and place the animation. Clicking the Options button in this box will provide you with some more advanced controls over the video output. Let's look at the Length/Format dialog box, shown in Figure 10.42, in a bit more detail.

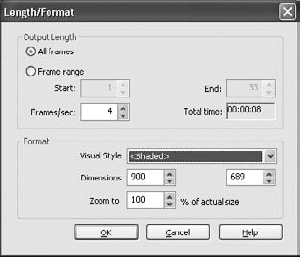
This dialog box gives you the option to export all the frames or just partial frame sets. You might want to include partial frames if you're looking for a visualization that is only summer months or only the afternoon in a Single Day sequence. You also have the ability to change the frame rate. By default, the frame rate is set to 15 frames per second. This is a good frame rate for video but tends to move pretty fast for a sun shading animation. We recommend reducing the frame rate to 4, which will allow you more time to absorb how the shading changes across the building over time but still moves quickly enough so the video isn't stagnant. Notice that changing the frame rate from 15 to 4 has increased the Total time from 3 seconds to 8.
The other element you can edit in this dialog box is the format. You can change the output of the video size and how it is rendered. Rendered video options are similar to the view settings (Shaded, Hidden Line, etc). Change the settings and click OK.
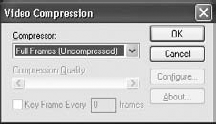
Now, click OK in the Save As dialog box. You'll be presented with one last set of options before the video exports: the Video Compression dialog box (Figure 10.43). This dialog box will allow you to use a variety of video codecs to compress the video for a smaller file size. Once you've chosen the appropriate compressor, click OK.
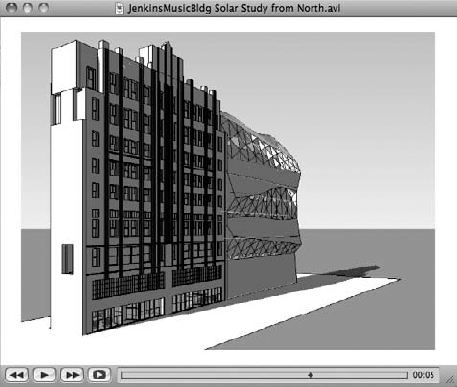
You'll see the Revit model reappear and render its way through the various animation times. Depending on the speed of your computer and the number of frames you're rendering, this could take several minutes. Once it's finished, you'll be able to view your final animation. Since it's not possible for us to embed a copy of the video within this book, you can download a copy of this animation from the book's companion website. Figure 10.44 shows a still of the video viewed in the VLC viewer.
New to Revit 2011 is the ability to visualize the path of the sun across the model's sky. This is a feature recently ported to Revit from Ecotect. To activate this feature, open the Jenkins Building model in the Chapter 10 folder on the book's companion web page (www.sybex.com/go/masteringrevit2011) and open the default 3D view.
In the status bar at the bottom of the screen is a new icon, Sun Path. Click this icon and you'll see you have the option to turn the sun path on or off and go directly to the Sun Settings dialog box (Figure 10.45). Selecting this option will open the dialog box you had previously accessed through the Graphic Display Options dialog box. Here, you can access that dialog box directly and modify the Sun Settings (Figure 10.46).
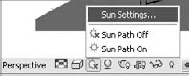

The settings here should reflect the Single Day animation you just completed. Let's leave these settings for now. Click OK to close this dialog box. Now, in Sun Settings, choose Sun Path On. You'll see a sun shown as a yellow ball placed in the sky and a compass rose placed under the building. The sun will have an arc displaying the path across the sky, reflecting its position at the day you chose, and nodes on this path, reflecting the time intervals you had preset (Figure 10.47).
Click and hold on the sun; this will activate the entire solar path across the range of the entire year (Figure 10.48). You can now drag the sun to any position within this solar range. Note that the time will be reflected just above sun itself and the date ranges are shown next to the compass rose.


Understanding a building's energy needs is paramount to helping the project become more sustainable. According to the U.S. Energy Information Administration, buildings in the United States account for 30 percent of the world's energy and 60 percent of the world's electricity, making the United States the primary consumer of energy in the world and the built form the largest consumer (Figure 10.49). That gives you a large burden to build responsibly and to think about your choices before you implement them.

Source: U.S. Energy Information Administration
The energy needs of a building depend on a number of issues that are not simply related to leaving the lights on in a room that you are no longer using or turning down the heat or upping the air conditioning. Many of the systems within a building revolve around the energy use. For instance, if you increase the windows on the south façade, you allow in more natural light and lower your need for electric illumination. However, without proper sun shading, you are also letting in additional solar heat gain, with those larger windows increasing your need for more air conditioning and potentially negating the energy savings from lighting.
In exploring the use of energy in a building, you must consider all energy-related issues, which is why you can use energy simulation. These computer-based models use climatic data coupled with building loads, such as the following:
The heating, ventilation, and air conditioning system (HVAC)
Solar heat gain
The number of occupants and their activity levels
Sun shading devices
Daylight dimming
Lighting levels
And a number of other variables
The energy model combines these factors to predict the building's energy demands to help size the building's HVAC system and parameters of other components properly so you are not using a system larger than what you need and so you can understand the impact of our design on the global environment. By keeping the energy model updated with the current design, you can begin to understand how building massing, building envelope, window locations, building orientation, and other parameters affect energy demands.
For energy modeling to be successful, you first need a solid, well-built model. This does not mean you need all the materials and details figured out, but you do have to establish some basic conditions. To ensure your model is correctly constructed to work with an energy modeling application, there are a few things that you need to do within the model to get the proper results. Some of this might sound like common sense, but it is important to ensure that you have the following elements properly modeled or you can have adverse results:
The model must have roofs and floors.
Walls inside and outside need to touch the roofs and floors.
All areas within the analysis should be bound by building geometry (no unbound building geometry allowed).
The energy analysis won't be accurate without all the building elements in place.
To perform an energy analysis, you need to take portions of the Revit file and export them using gbXML to an energy analysis application. The following are the energy modeling applications commonly used within the design industry. Each varies in price, ease of use, and interoperability with a gbXML model. Choosing the correct application for your office or workflow will depend on a balance of those variables.
- IES <VE>
IES <VE> (
www.iesve.com) is a robust energy analysis tool that offers a high degree of accuracy and interoperability with a BIM model. The application can run the whole gamut of building environmental analysis from energy to daylighting to Computational Fluid Dynamics (CFDs) used to study airflow for mechanical systems. Cons to this application are its current complexity for the user and the relatively expensive cost of the tool suite.- Autodesk Ecotect
This application (
www.autodesk.com/ecotect-analysis) has a great graphical interface and is easy to use and operate. The creators of this application also have a number of other tools, including a daylighting and weather tool. While easy to use, it can be challenging to import model geometry depending on what specific application you are using for your BIM model. As an example, SketchUp and Vectorworks can import directly, whereas applications like Revit can be more of a challenge.- eQuest
The name stands for the Quick Energy Simulation Tool (
www.doe2.com/equest). This application is a free tool created by the Lawrence Berkeley National Laboratory (LBNL). Although robust, it contains a series of wizards to help you define your energy parameters for a building. Like Ecotect, it can be a challenge to import BIM model data smoothly depending on the complexity of the design, although it will directly import SketchUp models by using a free plug-in.- Autodesk Green Building Studio
Green Building Studio (
www.greenbuildingstudio.com) is an online service that allows you to upload a gbXML file for a free energy analysis. The service provides quick and graphical feedback of the buildings' energy performance based on a survey of building use and loads. The survey is not highly detailed, so if your building type or use does not fit into the limited choices available, the results might not be accurate.
Before you can export the model to gbXML and run your energy analysis, you need to create several settings within Revit so you can export the proper information. It isn't important which order these get set, but it is important to check that they are set before exporting to gbXML. If the information within the model is not properly created, the results of the energy analysis will be incorrect.
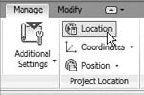
The physical location of the project on the globe is an important factor in energy use. In Revit, you can give your building a location a couple of ways. One is to choose the Manage tab and click the Location button (Figure 10.50).
Another way to get to this same dialog box is through the Graphic Display Options you used for solar shading earlier in this chapter. Once in the Local Weather And Site dialog box (Figure 10.51), you can either select your location using the map in the lower portion of the window or type in your city and state and then click Search. This map will link to Google Maps, giving you a way to pinpoint the exact longitude and latitude of your project address.

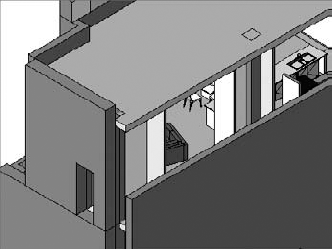
Although this might seem obvious in concept, a building without walls cannot have an accurate energy analysis run on it. Although the specific wall or roof composition won't be taken into account, each room needs to be bound by a wall, floor, or roof. These elements are critical in creating the gbXML file and defining the spaces or rooms within the building. These spaces can in turn be defined as different activity zones in the energy analysis application. Before you export, verify that you have a building envelope free of unwanted openings. This means all your walls meet floors and roofs and there are no "holes" in the building (Figure 10.52).
When Revit exports to a gbXML file, it is actually exporting the room volumes as they are constrained by the building geometry. This is what will define the zones within the energy analysis application. There are several steps you will need to verify to make sure your rooms and room volumes are properly in place.
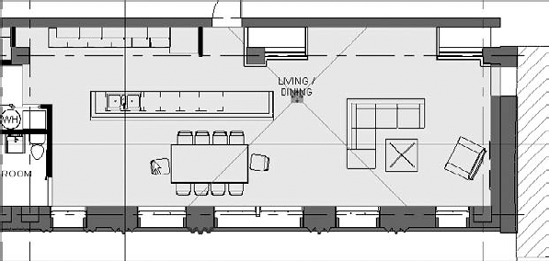
Each area within the Revit model that will be affected by the mechanical system will need to have a room element added to it. To add rooms, select the Room tool from the Home tab. Placed rooms within the model will look like Figure 10.53.
Once all the rooms are placed, each room's properties should be redefined to reflect its height. The height of the room should extend to the bottom of the room above (in a multistory building), or if it is the top/only floor of a building, the room must fully extend through the roof plane. When you extend the room through the roof plane, Revit will use the Roof geometry to limit the height of the room element and conform it to the bottom of the roof. Rooms should never overlap either in plan (horizontally) or vertically (between floors) as this will give you inaccurate results.
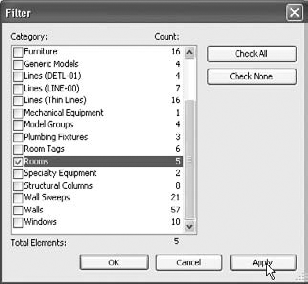
An easy way to set the room heights is to open each level and select everything on the level. Using the Filter tool (Figure 10.54), you can unselect all the elements and choose to only keep the rooms selected. In this way, you can edit all the rooms on a given floor at one time.
Once the rooms are selected, go to the Properties Palette and modify the room heights. By default, rooms are inserted at 8'-0" high. You have the option to set a room height directly, or you can modify the room height settings to go to the bottom of the floor above. This second option is what you have set for our rooms and is shown in Figure 10.55. Note that you'll need to set Upper Limit to the floor above and delete the value (8'-0" by default) in the offset. Repeat this same workflow for every floor of the building.

Now that all the heights are defined, you have to tell Revit to calculate the volumes of the spaces. By default, Revit does not perform this calculation. Depending on the size of your file, leaving this setting on can hinder performance. Make sure that after you export to gbXML you come back to this dialog box and change the setting back to Areas Only.
To turn on room volumes, select the fly-out menu from the Room panel on the Home tab (Figure 10.56) and select Area And Volume Computations.

This will open the Area And Volume Computations dialog box. There are a couple of simple settings here that will allow you to activate the volume calculations within Revit (Figure 10.57). You'll want to select the radio button Areas And Volumes so that Revit will calculate in the vertical dimension as well as the horizontal for your room elements.

The second setting tells Revit where to calculate the rooms from. By choosing Wall Finish, Revit will not calculate any of the space a wall actually takes up with the model. Arguably, this is also conditioned space. Technically, what you would want is to calculate from the wall centers on interior partitions and the interior face of wall on exterior walls. However, Revit does not allow you that option, so you have chosen to calculate from At Wall Center. Once you've modified those settings, click OK.
Now that you have all the room settings in place, we're ready to export to gbXML. To start this process, click the Application button and select Export
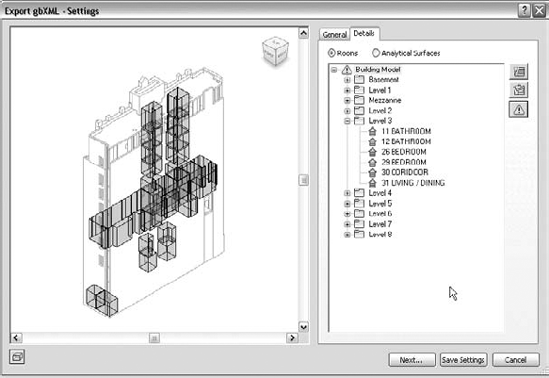
There are a few things to take note of in this dialog box. First, you'll see a 3D image of the building showing all the room volumes and bounded by the exterior building geometry. You can see in our building visualization that the boundary for the building is not completely full of room elements and that some of the room elements do not visually extend to the floor above. This would be your first clue that all your rooms do not have room elements placed or set properly, and you'll want to dismiss this dialog box to change those settings.
Second, you'll note the ViewCube at the upper right of the 3D view window. This window will respond to all the same commands as a default 3D view will directly in Revit, allowing you to turn, pan, and zoom the visualization.
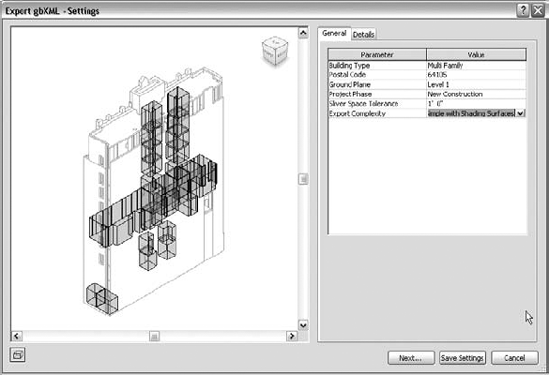
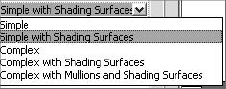
There are also two tabs on the right of this dialog box. The General tab will contain general information about your building and you'll want to verify it is filled out properly. Some of this information is Building Type, Postal Code (Zip Code), Ground Plane, and Project Phase. These settings will help determine the building use type (for conceptual-level energy modeling) and the location of your building in the world. There are two other settings: Sliver Space Tolerance and Export Complexity. Sliver Space Tolerance will help take into account that you might not have fully buttoned up your Revit building geometry. This will allow you a gap of up to a foot and Revit will assume that those gaps (12" or less) are not meant to be there. The Export Complexity setting allows you to modify the complexity of the gbXML export. There are several choices (Figure 10.59) based on the complexity of your model and the export.
Once you're ready to finish the export, click Next. This will give you the standard Save As dialog box, allowing you to locate and name your gbXML file. Depending on the size and complexity of your building, a gbXML export can take several minutes and the resulting file size can be tens of megabytes.
You're now ready to import the gbXML file into your energy analysis application to begin computing your energy loads.
Daylighting is the use of natural light for primary interior illumination. This reduces your need for artificial light within the space, reducing internal heat gain and energy use. Natural light is the highest quality and most efficient light source available today, and the source is free.
An effective daylighting design relies heavily on proper building orientation, massing, and envelope design. The proper combination of these strategies allows you to optimize your building's use of natural resources and minimize your dependency on artificial lighting. A fully integrated daylighting system can enhance the visual acuity, comfort, and beauty of a space while controlling external heat gain and glare.
Some common terms that are associated with daylighting are:
A footcandle, which is a measure of light intensity. A footcandle is defined as the amount of light received by 1 square foot of a surface that is 1 foot from a point source of light equivalent to one candle of a certain type. Depending on the sky conditions, daylight can produce anywhere from 2,000 to 10,000 footcandles.
Illuminance, which is the luminous flux per unit area on an intercepting surface at any given point, expressed in footcandles. Commonly described as the amount of light on a surface.
Luminance, which is the luminous intensity of a surface in a given direction per unit of projected area, expressed in footcandles. Commonly described as the amount of light leaving a surface.
Glare, which is the sensation produced by luminance within the visual field that is sufficiently greater than the luminance to which the eyes have adapted to cause annoyance, discomfort, or visibility difficulty.
Not only does natural daylight help to light our workplaces and homes, but it also supplies us with a connection to the outdoors. Providing occupants with natural light and ties to the outside has been proven in a number of cases to have a positive effect on human health and productivity. Studies have shown that buildings with good daylighting design have positive effects on their occupants:
Increased productivity levels
Low absentee rates
Better grades
Retail sale increases
Improved dental records
Healthier occupants
Revit itself does not perform daylighting analysis. To get accurate daylighting results, you need to use other applications in the same way you did with energy analysis. Daylighting, however, is much easier to evaluate for accurate results and doesn't require several years of school to perfect. There are several tools on the market that will do daylighting analysis:
- DaySIM
DaySIM (
http://apps1.eere.energy.gov/buildings/tools_directory/software.cfm/ID=428/pagename=alpha_list) is a free application supported by the U.S. Department of Energy. It is built from the Radiance engine, one of the most accurate and trusted currently available, but requires a working knowledge of the Radiance engine to be properly proficient.- Ecotect
Ecotect offers its own flavor of daylighting analysis (
www.autodesk.com/ecotect-analysis). Ecotect is powerful as a one-stop shop for sustainable design analysis (as it also performs energy analysis as well as other building analysis) but has been noted to be clunky and difficult to use.- 3ds Max Design
3ds Max Design is a rendering application (
www.autodesk.com/3dsmax) that in 2008 added a daylighting package. The daylighting engine is Radiance based but is easy to use and will directly import Revit model geometry through the use of an FBX translator.
For the purposes of this exercise, we'll focus on the 3ds Max Design daylighting tool because we think this allows the most speed and versatility for daylighting analysis.
As in energy modeling, you must perform several steps in order to successfully analyze a building for daylight. If all the steps are not performed, your analysis will be inaccurate and not trustworthy. Let's step through the specific settings needed to perform daylighting. In this analysis, we used the same Jenkins model we used for other exercises in this project to better emulate a real-life workflow.
As in energy modeling, if your building model is missing walls or has holes in the exterior (that aren't supposed to be there), it will leak light into the space and invalidate your results. Make sure your model is properly created; that there are roofs, floors, and walls in place; and that those elements meet properly in their corners.
Proper building phasing is also important. Your building model will be exported from a perspective or 3D view. Make sure that you have the view phase set to Show Complete.
Note
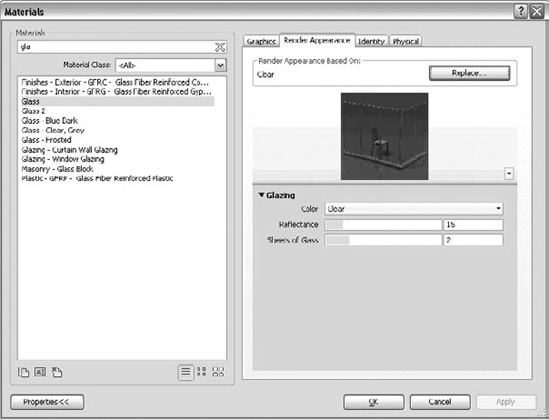
Materiality is an important part of daylighting as the nature of the materials will allow light transmittance (in the case of glazing) or allow light reflectance (in the case of flooring, wall paint, etc.). You'll want to have all your materials properly defined in the view from which you want to create the daylighting simulation. To set your materials, navigate to the Manage tab and choose the Materials button. It will open the Materials dialog box (Figure 10.61). All of your elements within the model, even Generic elements (such as generic walls), should have materials defined. Let's look at some of these materials in more detail.
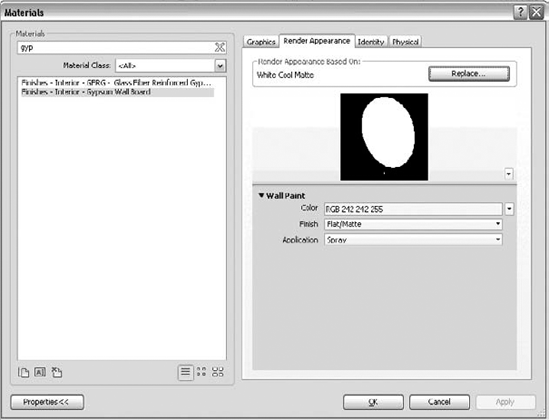
One common material will be paint (shown in Figure 10.61). Here, we have applied paint as the finish type (called Cool White Matte) to describe the finish type for Gypsum Wall Board, one of our more common building materials. As you can see on the Render Appearance tab, you have the ability to change some of the properties of the paint. You can alter the reflectance (flat, eggshell, semi-gloss, gloss, and so on) and how the paint is applied to the wall (rolled, sprayed, and so on). Each of these will affect the reflectance of the paint in a different way.
Another material you should look at is glazing. Getting the proper glazing settings will determine how much daylight you are getting inside the space. On the Render Appearance tab, shown in Figure 10.62, there are a few critical settings for glazing:
- Color
The color of the glazing will partially determine light transmittance. Set your glazing color to reflect the color you will have in your design. Revit supplies several common glazing colors.
- Reflectance
As with different colors, reflectance will also help determine how much light you will get inside a space. You will see that if you use the Replace feature at the top to select one of Revit's preset glazing colors, it will also give you a default value for reflectance.
- Sheets Of Glass
The number of sheets of glass will determine how the light will be refracted as it moves from outside the building to the inside. Typically, in a Revit window family, you model glass as a 1" single pane for ease of modeling. Modifying the number of panes in this location will allow us to keep our modeling easy but still maintain a level of accuracy in the daylighting analysis.
Depending on the stage of design you are in, you might not know what your final material is, but you want to apply some defaults to the material types so you can perform some preliminary lighting analysis. When in doubt, here are some default reflectance values you can apply to the Generic materials:
Floors: 20% reflectance
Walls: 50% reflectance
Ceilings: 85% reflectance
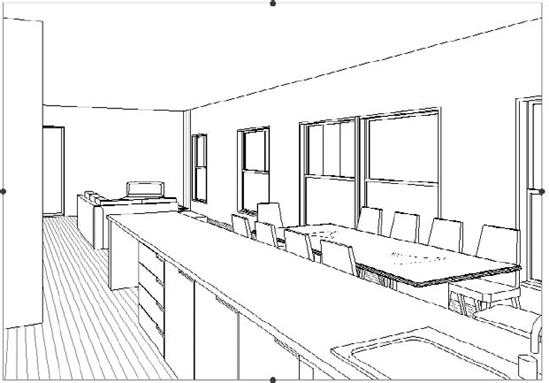
Once you have your materials defined and the model is ready to go, you need to define the view from which you want to export. To do this, select the camera tool from the View tab and create a perspective view of the area you want to analyze (Figure 10.63).
Now you are ready to export this view to FBX. To do so, click the Application button and select Export
Although this is a Revit book, we recognize that in today's design workflow not everything can happen within one application. Because of the general ease of performing daylighting in 3ds Max Design, you are going to finish the analysis in the other application. Before you begin in 3ds Max Design, there are a couple of things to note. First, you need to have a copy of Max Design, not Max. They are similar applications but the Design flavor of Max allows you to perform daylighting. Regular Max does not have this feature. Second, keep in mind that daylighting is science. The more accurate you are in following the steps, the more accurate your final results will be. These steps will be similar between Max Design 2009 and 2010.
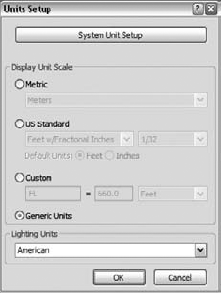
Open 3ds Max Design. From the Customize drop-down, choose Units Setup. Set your units to American, as shown in Figure 10.64. This will report your analysis in footcandles. You'll need to specify this setting only once.
Click the Application button, select Import

From this point, you'll have the imported Revit model in Max. It should look like the generic 3D view from Revit. To get to the view you exported from, right-click the white text in the upper-right corner of your view window and choose Default 3D View (if you didn't rename the view in Revit prior to export) or the view name you exported. This should bring you back to the familiar view you created in Revit.
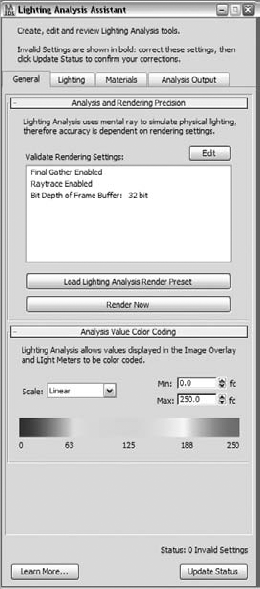
Now, we're going to step through some settings in the Max dialog boxes and drop-downs. You should notice the Lighting Analysis menu at the top of the screen (if you don't have this, you don't have the right flavor of Max). Click the Lighting Analysis menu and choose Lighting Analysis Assistant (Figure 10.66).
The Lighting Analysis Assistant has four tabs. By default, it opens on the General tab (Figure 10.67). This tab allows you to load some presets for daylighting analysis. Choose the Load Lighting Analysis Render Preset from this tab. You should also notice the lighting scale at the bottom of the dialog box. This will give you minimum and maximum color values for your daylighting simulation. Feel free to play with these values to achieve a desired graphic during this process.
Next is the Materials tab (Figure 10.68). This tab will show you if you have any materials in the import that are invalid and will therefore not reflect light properly. If you have invalid materials, it's probably a good idea to go back to Revit and fix them. This will not only make sure they are valid in the daylighting analysis, but if you alter them in 3ds Max Design, you'll need to alter them every time you perform another daylighting analysis. If you need to locate the materials that are invalid, you can select the pick button

Now, let's jump back to the Lighting tab (Figure 10.69). On this tab, we're going to set the building location, time of day, and the rendering engine you want to use to perform the daylighting analysis. All of these settings will be created in other dialog boxes that are spawned from this dialog box. Don't worry—we'll step through them one at a time.
To begin, select the top Select & Edit button. This will activate the sidebar menu and allow you to modify the position of the sun (Figure 10.70). We're going to want to change the Orbital Scale value at the bottom of this menu to something like 1500. This doesn't affect any analysis, but it will move the visualization of the sun off the ground plane and up into the sky. The other thing you want to do is select the Weather Data File radio button. This will activate the setup button right next to this selection.
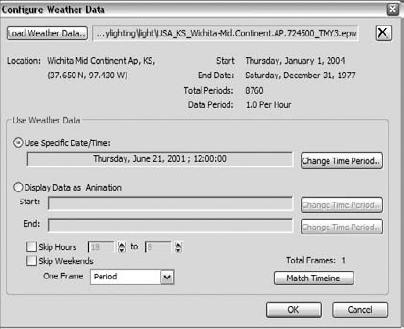
By clicking the Setup button, you will open yet another dialog box called Configure Weather Data. Here you can set the building location and time of day. 3ds Max works off TMY2 weather data files created by the department of energy. You'll need to navigate to their website (
http://apps1.eere.energy.gov/buildings/energyplus/cfm/weather_data2.cfm/region=4_north_and_central_america_wmo_region_4) and download an EPW file. This file contains the average weather for your given location over a 30-year interval. Once you've downloaded the EPW file, click the Load Weather Data button (shown in Figure 10.71) and browse to the file, select it, and click OK.Now, click the Change Time Period button. This will pull up another dialog box (yes, you're now four deep) and give you a slider to change the date and time of your analysis (Figure 10.72). If you're performing an analysis for LEED EQ 8.1, you'll want to set it to June 21 at noon. You might notice that as you move the slider back and forth, the dates jump forward and backward over time. This happens by design. Over the 30-year span contained in the EPW file, it is displaying the specific day and year of the weather file that had weather that most closely reflected the average conditions over that 30-year span. Set your time and date and click OK. Click OK again to exit the other dialog box.
Still on the Lighting tab, click the bottom Select & Edit. This will activate the sidebar menu. From this menu, choose Perez All Weather from the Sky Model drop-down (Figure 10.73).
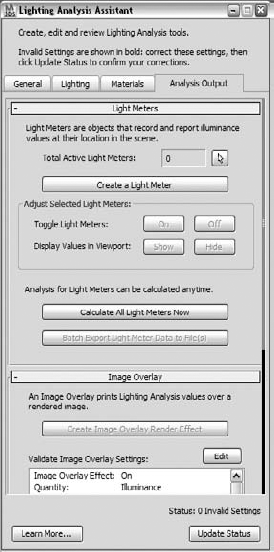
OK, nearly done with the settings. Choose the last tab, Analysis Output. You need to create a light meter in which to calculate the daylight (Figure 10.74). Click the Create Light Meter button, and in a plan view of your model, drag two points to create a grid.
This will also active the sidebar menu and give you the option to add node points to the light grid. If you're after your LEED analysis, you'll need to relocate the grid to 30" above the floor line and have meters every 2' in both directions. Your final grid will look like Figure 10.75. Once that is set, click OK to dismiss this dialog box.
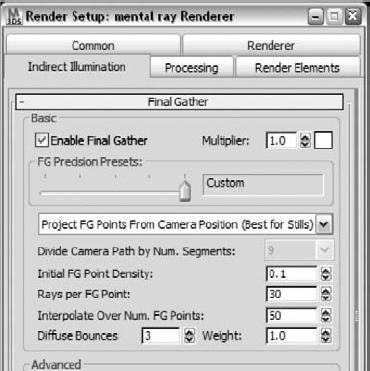
From the Render drop-down, choose Render Setup and select the Indirect Illumination tab. On this tab, you want to set Final Gather to 3 (Figure 10.76). Final Gather will calculate the number of times light will bounce within the space. A setting of 0 means no light bounces and will give an inaccurate reading. A setting of 7 will be highly accurate, but will take considerably more processing power to create as the light bounces calculate exponentially. A setting of 3 optimizes the accuracy and speed for your output.
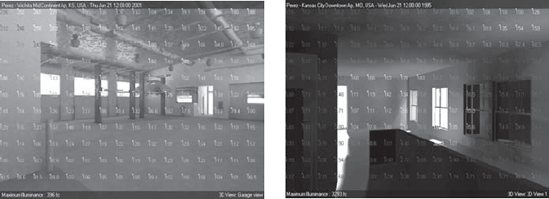
You're now ready to perform the analysis. On the Analysis Output tab of the Lighting Assistant, click the Calculate All Light Meters Now button. This will render the light meters to give you a final image, like Figure 10.77. You'll be able to get a footcandle reading for each of the light meters as well as a color gradation showing you light and dark spots within the view.


Once you've mastered the ability to perform these types of daylighting analyses, you'll find it is fairly quick and easy to iterate several designs and images. With a few more steps, you can render the final scene with a daylighting grid overlay (Figure 10.78).
In each of these scenarios, it's important to vet your results. Don't take the values at their face values; review them to make sure they are accurate. So that you have a scale in which to value your results, Table 10.1 gives you some footcandle readings that you can use to figure out how much light is a proper amount based on the tasks you are performing within that space.
Table 10.1. Footcandle Readings
Activity | Category | Lux | Footcandles |
|---|---|---|---|
A–C for illuminances over a large area (such as lobby space) | |||
D–F for localized tasks | |||
G–I for extremely difficult visual tasks | |||
Public spaces with dark surroundings | A | 20-30-50 | 2-3-5 |
Simple orientation for short temporary visits | B | 50-75-100 | 5-7.5-10 |
Working spaces where visual tasks are only occasionally performed | C | 100-150-200 | 10-15-20 |
Performance of visual tasks of high contrast or large size | D | 200-300-500 | 20-30-50 |
Performance of visual tasks of medium contrast or small size | E | 500-750-1000 | 50-75-100 |
Performance of visual tasks of low contrast or very small size | F | 1000-1500-2000 | 100-150-200 |
Performance of visual tasks of low contrast or very small size over a prolonged period | G | 2000-3000-5000 | 200-300-500 |
Performance of prolonged and exacting visual tasks | H | 5000-7500-10000 | 500-750-1000 |
Performance of special visual tasks of extremely low contrast | I | 10000-15000-20000 | 1000-1500-2000 |
- Embrace sustainable design concepts.
Understanding the concepts behind sustainable design is an important part of being able to perform analysis within the Revit model and a critical factor in today's design environment.
- Master It
What are four key methods for a holistic sustainable design?
- Leverage schedules.
Using schedules in Revit helps you track many of your design elements throughout the whole design process. These schedules can also be used to validate programmatic information during conceptual design.
- Master It
Explain how to create a schedule from a conceptual mass that will show the programmatic areas for each floor level.
- Use sun shading and solar paths.
Understanding the effects of the sun on a building design is a critical way to create and form space. Revit has tools to help you identify how the sun will affect the design and where shade and shadow will fall inside and outside the building over the course of the year.
- Master It
How can you use the tools in Revit to produce still and animated solar studies from interior and exterior views in order to understand shading and the sun's effect on the building and space?
- Prepare and export your model for energy analysis.
Being able to predict a building's energy performance is a necessary part of designing sustainably. Although Revit doesn't have an energy modeling application built into it, it does have interoperability with many applications that have that functionality.
- Master It
Explain the steps you need to take to get a Revit model ready for energy analysis.
- Analyze your project for daylighting.
Not only can proper daylighting in a building save energy, but it can make the inhabitants happier and healthier. Through analysis, you can now quantify the amount of light you're getting in any space and measure the footcandle readings! before you begin building. This allows you to iterate the design-making modifications to maximize your daylight while balancing the amount of glazing against solar heat gain and mechanical needs.
- Master It
Understand how much daylight you need to perform certain tasks. How much daylighting is needed for the following:
Working in an office
Reading a book
Working on or reading something small for an extended period of time