
If you are not a completely new programmer, I am sure you must have spent some amount of time debugging your or someone else's code. Debugging is almost like an art form. Every language has different methods and challenges around debugging. JavaScript has traditionally been a difficult language to debug. I have personally spent days and nights of misery trying to debug badly-written JavaScript code using alert() functions. Fortunately, modern browsers such as Mozilla Firefox and Google Chrome have excellent developer tools to help debug JavaScript in the browser. There are IDEs like
IntelliJ WebStorm with great debugging support for JavaScript and Node.js. In this chapter, we will focus primarily on Google Chrome's built-in developer tool. Firefox also supports the Firebug extension and has excellent built-in developer tools, but as they behave more or less the same as Google Chrome's
Developer Tools (DevTools), we will discuss common debugging approaches that work in both of these tools.
Before we talk about the specific debugging techniques, let's understand the type of errors that we would be interested in while we try to debug our code.
When your code has something that does not confirm to the JavaScript language grammar, the interpreter rejects this piece of code. These are easy to catch if your IDE is helping you with syntax checking. Most modern IDEs help with these errors. Earlier, we discussed the usefulness of the tools such as JSLint and JSHint around catching syntax issues with your code. They analyze the code and flag errors in the syntax. JSHint output can be very illuminating. For example, the following output shows up so many things that we can change in the code. This snippet is from one of my existing projects:
temp git:(dev_branch) ✗ jshint test.js
test.js: line 1, col 1, Use the function form of "use strict".
test.js: line 4, col 1, 'destructuring expression' is available in ES6 (use esnext option) or Mozilla JS extensions (use moz).
test.js: line 44, col 70, 'arrow function syntax (=>)' is only available in ES6 (use esnext option).
test.js: line 61, col 33, 'arrow function syntax (=>)' is only available in ES6 (use esnext option).
test.js: line 200, col 29, Expected ')' to match '(' from line 200 and instead saw ':'.
test.js: line 200, col 29, 'function closure expressions' is only available in Mozilla JavaScript extensions (use moz option).
test.js: line 200, col 37, Expected '}' to match '{' from line 36 and instead saw ')'.
test.js: line 200, col 39, Expected ')' and instead saw '{'.
test.js: line 200, col 40, Missing semicolon.We briefly discussed the
strict mode in earlier chapters. The strict mode in JavaScript flags or eliminates some of the JavaScript silent errors. Rather than silently failing, the strict mode makes these failures throw errors instead. The strict mode also helps in converting mistakes to actual errors. There are two ways of enforcing the strict mode. If you want the strict mode for the entire script, you can just add the use strict statement as the first line of your JavaScript program. If you want a specific function to conform with the strict mode, you can add the directive as the first line of a function:
function strictFn(){
// This line makes EVERYTHING under this strict mode
'use strict';
…
function nestedStrictFn() {
//Everything in this function is also nested
…
}
}These errors appear when you execute the code and try to refer to an undefined variable or process a null. When a runtime exception occurs, any code after that particular line (which caused the exception) does not get executed. It is essential to handle such exceptional scenarios correctly in the code. While exception handling can help prevent crashes, they also aid in debugging. You can wrap the code that may encounter a runtime exception in a try{ } block. When any code in this block generates a runtime exception, a corresponding handler captures it. The handler is defined by a catch(exception){} block. Let's clarify this using an example:
try {
  var a = doesnotexist; // throws a runtime exception
} catch(e) {
  console.log(e.message);  //handle the exception
  //prints - "doesnotexist is not defined"
}
In this example, the var a = doesnotexist; line tries to assign an undefined variable, doesnotexist, to another variable, a. This causes a runtime exception. When we wrap this problematic code in the try{} catch(){} block and when the exception occurs (or is thrown), the execution stops in the try{} block and goes directly to the catch() {} handler. The catch handler is responsible for handling the exceptional scenario. In this case, we are displaying the error message on the console for debugging purposes. You can explicitly throw an exception to trigger an unhandled scenario in the code. Consider the following example:
function engageGear(gear){
  if(gear==="R"){ console.log ("Reversing");}
  if(gear==="D"){ console.log ("Driving");}
  if(gear==="N"){ console.log ("Neutral/Parking");}
  throw new Error("Invalid Gear State");
}
try
{
  engageGear("R");  //Reversing
  engageGear("P");  //Invalid Gear State
}
catch(e){
  console.log(e.message);
}
In this example, we are handling valid states of a gear shift (R, N, and D), but when we receive an invalid state, we are explicitly throwing an exception clearly stating the reason. When we call the function that we think may throw an exception, we wrap the code in the try{} block and attach a catch(){} handler with it. When the exception is caught by the catch() block, we handle the exceptional condition appropriately.
Displaying the state of execution on the console can be very useful while debugging. However, modern developer tools allow you to put breakpoints and halt execution to inspect a particular value during runtime. You can quickly detect small issues by logging some variable state on the console.
With these concepts, let's see how we can use Chrome Developer Tools to debug JavaScript code.
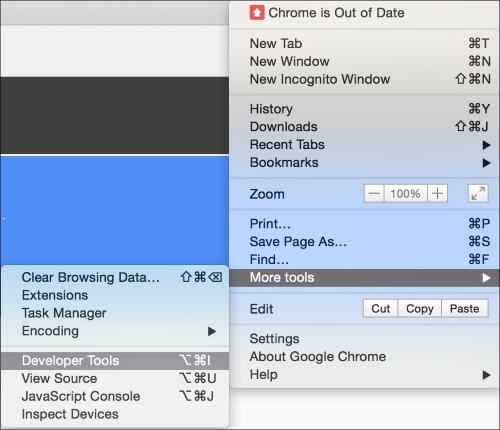
You can start Chrome DevTools by navigating to menu | More tools | Developer Tools:
Chrome DevTools opens up on the lower pane of your browser and has a bunch of very useful sections:

The Elements panel helps you inspect and monitor the DOM tree and associated style sheet for each of these components.
The Network panel is useful to understand network activity. For example, you can monitor the resources being downloaded over the network in real time.
The most important pane for us is the Sources pane. This pane is where the JavaScript source and debugger are displayed. Let's create a sample HTML with the following content:
<!DOCTYPE html>
<html>
<head>
  <meta charset="utf-8">
  <title>This test</title>
  <script type="text/javascript">
  function engageGear(gear){
    if(gear==="R"){ console.log ("Reversing");}
    if(gear==="D"){ console.log ("Driving");}
    if(gear==="N"){ console.log ("Neutral/Parking");}
    throw new Error("Invalid Gear State");
  }
  try
  {
    engageGear("R");  //Reversing
    engageGear("P");  //Invalid Gear State
  }
  catch(e){
    console.log(e.message);
  }
  </script>
</head>
<body>
</body>
</html>
Save this HTML file and open it in Google Chrome. Open DevTools in the browser and you will see the following screen:
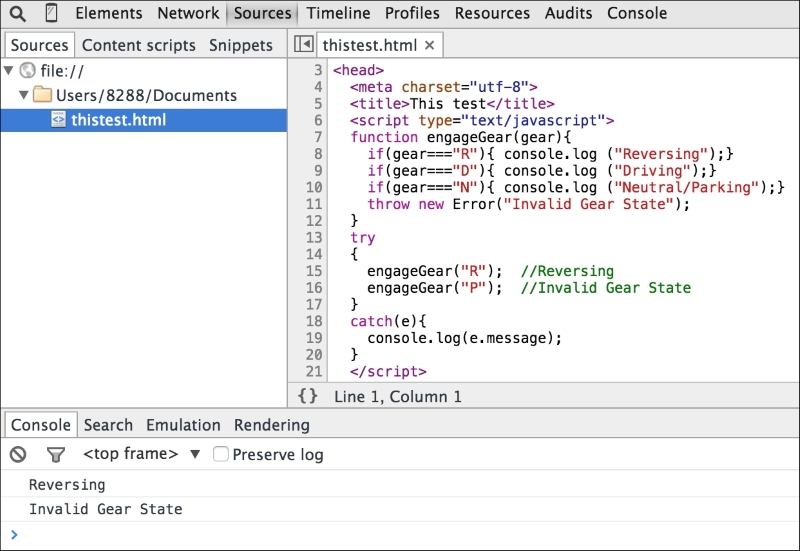
This is the view of the Sources panel. You can see the HTML and embedded JavaScript source in this panel. You can see the Console window as well. You can see that the file is executed and output is displayed in the Console.
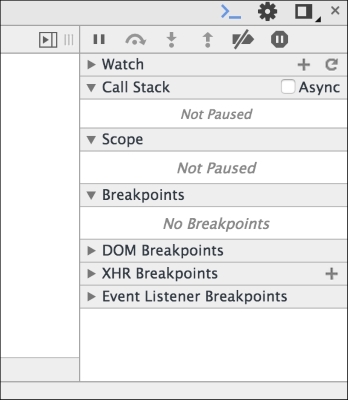
On the right-hand side, you will see the debugger window:
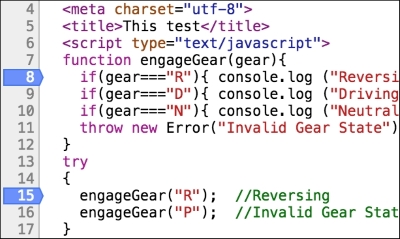
In the Sources panel, click on the line numbers 8 and 15 to add a breakpoint. The breakpoints allow you to stop the execution of the script at the specified point:
In the debugging pane, you can see all the existing breakpoints:
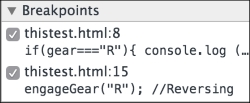
Now, when you rerun the same page, you will see that the execution stops at the debug point. One very useful technique is to inject code during the debugging phase. While the debugger is running, you can add code in order to help you understand the state of the code better:
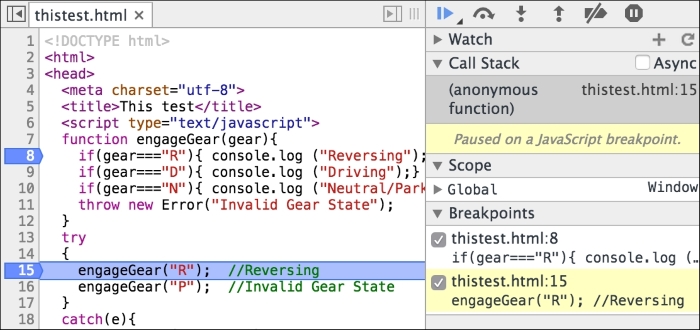
This window now has all the action. You can see that the execution is paused on line 15. In the debug window, you can see which breakpoint is being triggered. You can see the Call Stack also. You can resume execution in several ways. The debug command window has a bunch of actions:
You can resume execution (which will execute until the next breakpoint) by clicking on the ![]() button. When you do this, the execution continues until the next breakpoint is encountered. In our case, we halt at line 8:
button. When you do this, the execution continues until the next breakpoint is encountered. In our case, we halt at line 8:
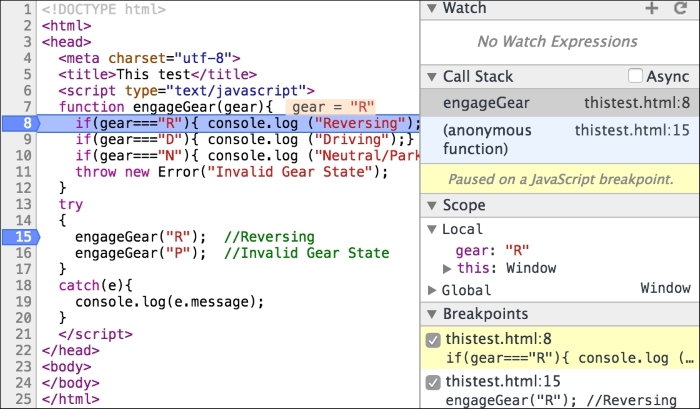
You can observe that the Call Stack window shows you how we arrived at line 8. The Scope panel shows the Local scope where you can see the variables in the scope when the breakpoint was arrived at. You can also step into or step over the next function.
There are other very useful mechanisms to debug and profile your code using Chrome DevTools. I would suggest you to go experiment with the tool and make it a part of your regular development flow.