
Like any other language, writing correct JavaScript code at scale is an involved task. As the language matures, several of the inherent problems are being taken care of. There are several exceptional libraries that aid in writing good quality code. For most serious systems, good code = correct code + high performance code. The demands of new-generation software systems are high on performance. In this section, we will discuss a few tools that you can use to analyze your JavaScript code and understand its performance metrics.
We will discuss the following two ideas in this section:
- Profiling: Timing various functions and operations during script-profiling helps in identifying areas where you can optimize your code
- Network performance: Examining the loading of network resources such as images, stylesheets, and scripts
JavaScript profiling is critical to understand performance aspects of various parts of your code. You can observe timings of the functions and operations to understand which operation is taking more time. With this information, you can optimize the performance of time-consuming functions and tune the overall performance of your code. We will be focusing on the profiling options provided by Chrome's Developer Tools. There are comprehensive analysis tools that you can use to understand the performance metrics of your code.
The CPU profile shows the execution time spent by various parts of your code. We have to inform DevTools to record the CPU profile data. Let's take the profiler for a spin.
You can enable the CPU profiler in DevTools as follows:
- Open the Chrome DevTools Profiles panel.
- Verify that Collect JavaScript CPU Profile is selected:

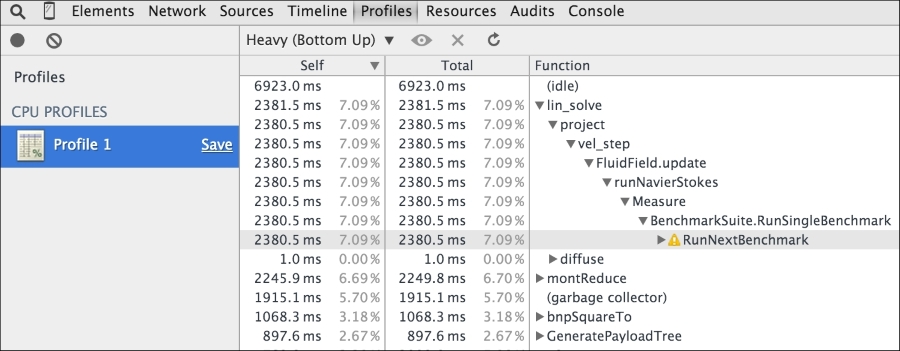
For this chapter, we will be using Google's own benchmark page, http://octane-benchmark.googlecode.com/svn/latest/index.html. We will use this because it contains sample functions where we can see various performance bottlenecks and benchmarks. To start recording the CPU profile, open DevTools in Chrome, and in the Profiles tab, click on the Start button or press Cmd/Ctrl + E. Refresh the V8 Benchmark Suite page. When the page has completed reloading, a score for the benchmark tests is shown. Return to the Profiles panel and stop the recording by clicking on the Stop button or pressing Cmd/Ctrl + E again.
The recorded CPU profile shows you a detailed view of the functions and the execution time taken by them in the bottom-up fashion, as shown in the following image:
The Chrome DevTools Timeline tool is the first place you can start looking at the overall performance of your code. It lets you record and analyze all the activity in your application as it runs.
The Timeline provides you with a complete overview of where time is spent when loading and using your site. A timeline recording includes a record for each event that occurred and is displayed in a waterfall graph:
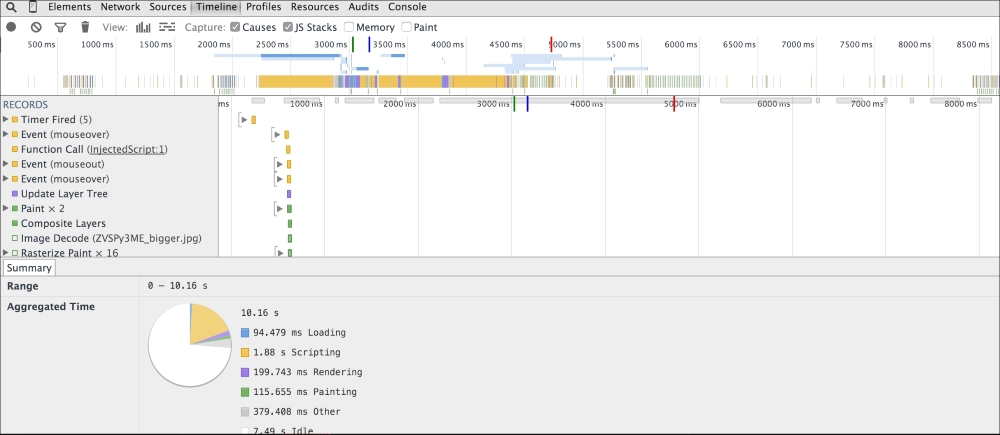
The preceding screen shows you the timeline view when we try to render https://twitter.com/ in the browser. The timeline view gives you an overall view of which operation took how much time in execution:

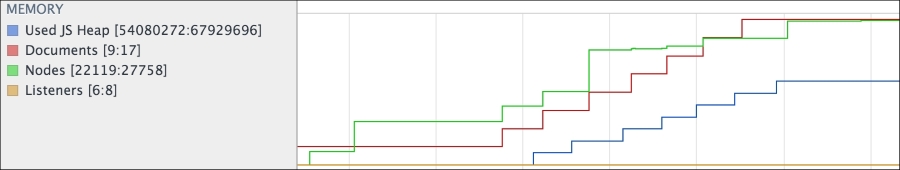
In the preceding screenshot, we can see the progressive execution of various JavaScript functions, network calls, resource downloads, and other operations involved in rendering the Twitter home page. This view gives us a very good idea about which operations may be taking longer. Once we identify such operations, we can optimize them for performance. The Memory view is a great tool to understand how the memory is used during the lifetime of your application in the browser. The Memory view shows you a graph of the memory used by your application over time and maintains a counter of the number of documents, DOM nodes, and event listeners that are held in the memory. The Memory view can help detect memory leaks and give you good enough hints to understand what optimizations are required:
JavaScript performance is a fascinating subject and deserves its own dedicated text. I would urge you to explore Chrome's DevTools and understand how best to use the tools to detect and diagnose performance problems in your code.