Chapter 13
Archiving and Monitoring
Any company facing the world of compliance will probably need to account not only for who is instant messaging with whom and when but also for the content of those messages. This is where the Archiving role comes into play.
Its partner role is the Monitoring role. Neither Archiving nor Monitoring is a dedicated role in Skype for Business, but both rely on separate databases for storage and are defined within the topology. As such, it’s easiest to continue to think of them as roles. Monitoring is often associated with service availability up/down reporting capabilities, but the Skype for Business Server 2015 Monitoring role is responsible for the quality-based call monitoring as well as the call detail recording capability normally associated with PBXs.
Server (and service) availability monitoring is the responsibility of System Center Operations Manager, and Skype for Business Server 2015 has a management pack available to provide specific service alerting and reporting into System Center.
In this chapter, you will learn to
- Understand the architecture of the Archiving and Monitoring roles
- Provide reporting on the data available from the Archiving and Monitoring roles
- Use the capabilities in the System Center Operations Manager management pack to report on the availability of the Skype for Business service
Deploying the Architecture
Live Communications Server (LCS) introduced the archiving and call detail recording (CDR) capability; however, the Monitoring server role was not available until OCS 2007.
In both LCS (2003 and 2005) and OCS 2007, the Archiving database contained the IM logs as well as the CDR data. The Monitoring database introduced with OCS 2007 contained only the quality of experience (QoE) data; however, with the move to OCS 2007 R2, the CDR data was removed from the Archiving database and included with the QoE data. This configuration was similar with both versions of Lync Server; archiving contained only the IM logs, and monitoring included both CDR and QoE data.
Lync Server 2013 changed the way in which archived data is maintained. When Exchange 2013 is also deployed in the environment, archiving can be directed to archive the data within the Exchange 2013 environment and make it subject to the same archiving configuration as Exchange. You can find specific information on this configuration in Chapter 22, “Exchange, SharePoint, and Office Web Applications Server.”
Otherwise, Skype for Business can continue to archive data to a SQL Server database.
In this chapter we’ll focus on native archiving. You’ll look at the prerequisites required, the deployment architecture, and the policies required to enable the archiving and monitoring capability for users.
Prerequisites
Both Archiving and Monitoring roles have been combined into the Front End role, so no additional hardware is required to deploy them; it’s just a case of enabling them and publishing the topology. These roles both use SQL Server as a repository for their data. Only Archiving can use Exchange Server 2013 as an alternative.
Unlike in previous versions, neither role requires Microsoft Message Queuing (MSMQ) to be installed.
Installation
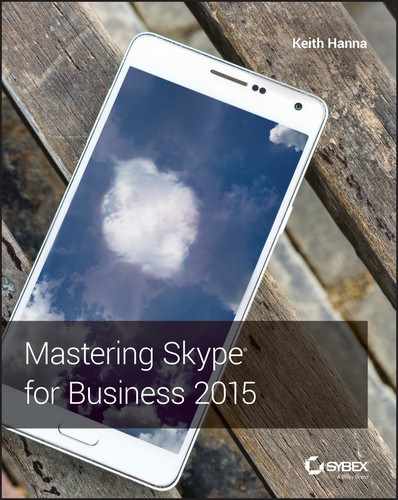
Archiving and Monitoring are both defined within Topology Builder; however, since Lync Server 2013, they no longer require separate servers. Rather, they are installed as additional services on top of a Front End server. Either role can be enabled as part of the New Pool Wizard, or they can be added later through editing and publishing the topology. Figure 13.1 shows the associations section of a pool being edited on a previously published pool.
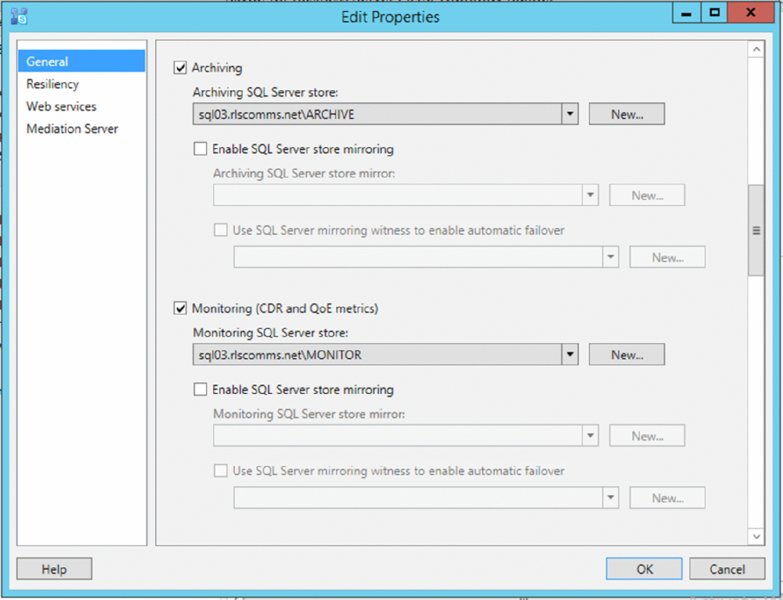
FIGURE 13.1 Defining archiving and monitoring associations on a pool
As with other roles that are reliant upon databases, the act of publishing the topology will also prompt to allow for creation of the databases. You can leave it to Topology Builder to select the locations for the database files, or you can manually control them.
Database Support, Architecture, and Capacity
Microsoft recommends that you deploy separate instances for each of the Archiving and Monitoring installations; however, it does support sharing an instance between Archiving and Monitoring and even sharing within a Back End or Persistent Chat database instance.
While this is a supported configuration, it’s not recommended because of the likely capacity of the Archiving database. Larger databases can need more maintenance time, potentially impacting the other databases. Typically, separate instances will be used when the performance of SQL Server is critical.
In the case of a Standard Edition server, a separate SQL Server installation is still required. Archiving and Monitoring cannot use the SQL Express instance used by the Standard Edition server.
The Archiving instance creates a single database called LCSLog, whereas the Monitoring instance creates two databases, LCSCDR, containing call data record information, and QoEMetrics, containing QoE information.
Skype for Business also provides a significant number of reports for accessing and reporting on the QoE data, allowing administrators to help diagnose and troubleshoot call quality problems. You’ll see some of these later in this chapter.
Both roles require the 64-bit version of SQL Server to be used; the Monitoring Reporting Pack requires SQL Reporting Services. The following versions of SQL Server are supported (or later service packs):
- SQL Server 2008 R2 Standard
- SQL Server 2008 R2 Enterprise
- SQL Server 2012 Standard
- SQL Server 2012 Enterprise
- SQL Server 2014 Standard
- SQL Server 2014 Enterprise
High Availability
Lync Server 2010 and previous versions did not support high availability for Archiving or Monitoring. There was support for Critical Mode Archiving, meaning that if the solution was unable to archive a message for a given time period (which varied based on version but was configurable), the Front End services would shut down. This resulted in no message transfer possible, and indeed users would be logged out in earlier versions.
With the changes to Lync Server 2013 and how it used SQL Server, coupled with the fact that Archiving and Monitoring are services on the Front End servers, high availability is automatically achieved with an environment that includes the high-availability components in the design and deployment, such as multiple Front Ends and a SQL Server instance in mirrored configuration for the Back End.
Skype for Business builds on this with support for SQL Server AlwaysOn Availability Groups.
Configuring Policies
The configurations for both Archiving and Monitoring are defined in the same location within the Control Panel application, as shown in Figure 13.2.
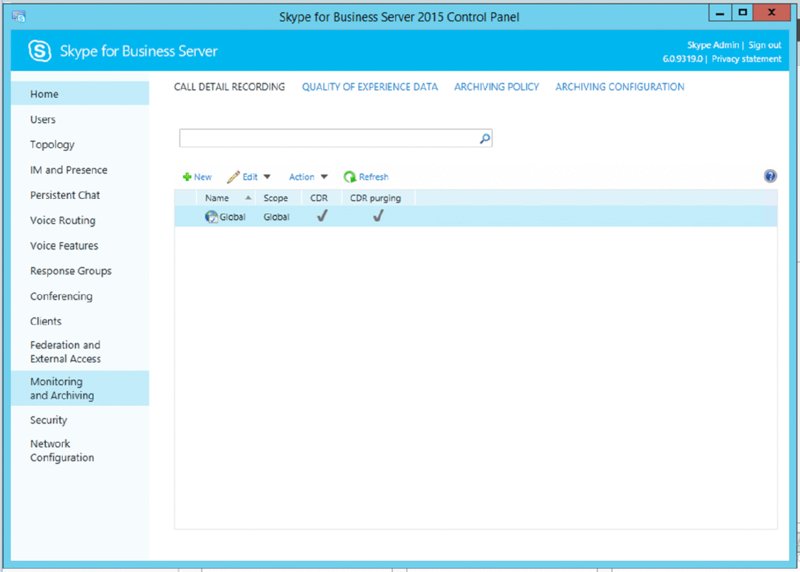
FIGURE 13.2 The Archiving And Monitoring configuration menu
Both policies have the same scope configuration options.
- Global
- Site
- User (Archiving Policy only)
User policies will override both site and global polices, and site policies will override global policies. In the case of archiving, external and internal communications can be configured separately and can be overridden separately also; for example, if both external and internal archiving are enabled at the global level and internal archiving of communications is disabled at the site level, then for users at that site, only archiving of external communications would occur.
Both call detail recording and quality of experience data have the same options.
- Scope
- Enabled
- Purging
- Number of days for data to be kept (if purging is enabled)
In addition, call detail recording can specify how long error reports are kept.
Archiving policy allows for control over internal and/or external enablement, as shown in Figure 13.3.
FIGURE 13.3 Defining the archiving policy
To define the CDR policy using PowerShell, enter this command:
New-CsCdrConfiguration -Identity site:EMEA -EnableCDR $true
-EnablePurging $true -KeepCallDetailForDays 30
-KeepErrorReportForDays 30 -PurgeHourOfDay 3
To configure the QoE data, use the New-CsQoeConfiguration cmdlet.
The PurgeHourOfDay parameter allows you to customize when the old data will be purged. Common sense suggests that you define this outside normal office hours; however, other operations (such as backups) may occur at the default time (2 a.m.), and you may find it useful to change this.
Archiving can be enabled for internal or external communications, or both. You can define additional policies to allow this distinction to be made on a per-user or per-site basis if required.
The New-CsArchivingConfiguation cmdlet provides the options shown in Table 13.1 to configure the actual policy (using New-CsArchivingPolicy).
TABLE 13.1 Archiving configuration cmdlet parameters
| PARAMETER | DEFAULT | NOTES |
ArchiveDuplicateMessages |
True |
Used when dealing with cross-pool messages. If set to True, the message will be archived once per pool of users involved. If False, it will be archived only once. |
BlockOnArchiveFailure |
False |
If set to True, IMs will be refused if there are any issues with the archiving service. False enables message flow to continue in the event of problems. |
CachePurgingInterval |
24 |
Defines how often the system cache is purged of messages when none of the participants is enabled for archiving. |
EnableArchiving |
None |
Specifies what is archived: None ImOnly ImAndWebConf |
EnableExchangeArchiving |
False |
If set to True, archive data is stored in Exchange Server 2013 rather than SQL Server. If Exchange archiving is enabled, then Exchange archiving policies will be applied, not Lync policies. |
EnablePurging |
False |
If set to True, messages will be removed from the database if older than the value specified in KeepArchivingDataForDays. If False, messages are not removed. |
KeepArchivingDataForDays |
14 |
Number of days that messages are kept (between 1 and 2,562, approximately 7 years). |
PurgeExportedArchivesOnly |
False |
If True, only messages that have been exported will be purged (overrides the KeepArchivingDataForDays value). |
PurgeHourOfDay |
2 |
Time value (hour only) when the data purging will occur. |
A common archiving requirement is for compliance purposes, and typically it requires data to be kept for more than the default 14-day period. To create a new policy configuration with a one-year retention period, use the following command:
New-CsArchivingConfiguration -Identity site:EMEA
-KeepArchivingDataForDays 365 -EnableArchiving ImAndWebConf
If the Archiving role has not yet been deployed, a warning will appear to remind the administrator that enabling archiving requires the Archiving server role to be deployed.
Using Get-CsArchivingConfiguration will return the following data for a new policy configuration:
Identity                  : Site:EMEA
EnableArchiving           : ImAndWebConf
EnablePurging             : False
PurgeExportedArchivesOnly : False
BlockOnArchiveFailure     : False
KeepArchivingDataForDays  : 365
PurgeHourofDay            : 2
ArchiveDuplicateMessages  : True
CachePurgingInterval      : 24
EnableExchangeArchiving   : False
To apply this configuration as a policy, you need to create an associated policy using the New-CsArchivingPolicy cmdlet; this will allow you to define whether the configuration applies to internal or external (or both) types of communication.
New-CsArchivingPolicy -Identity 1-year-external -ArchiveExternal $TrueHere, you have created a user policy with only external archiving enabled.
Using Get-CsArchivingPolicy will display the following configuration:
Identity        : Tag:1-year-external
Description     :
ArchiveInternal : False
ArchiveExternal : True
Given that you created a site-based policy configuration and a user-based policy, when you assign the user-based policy to users (with the Grant-CsArchivingPolicy cmdlet), this specific site policy will take effect only when users are part of the EMEA site; for locations outside EMEA, the global policy is in effect with the default values.
Deploying the Reporting Pack
The QoE data can be complicated, but Microsoft has provided a pack of built-in reports to help you understand the data captured. They range from simple usage and trending reports to detailed troubleshooting reports. They are deployed into a SQL Reporting Services instance, using the Deployment Wizard setup application (shown in Figure 13.4).
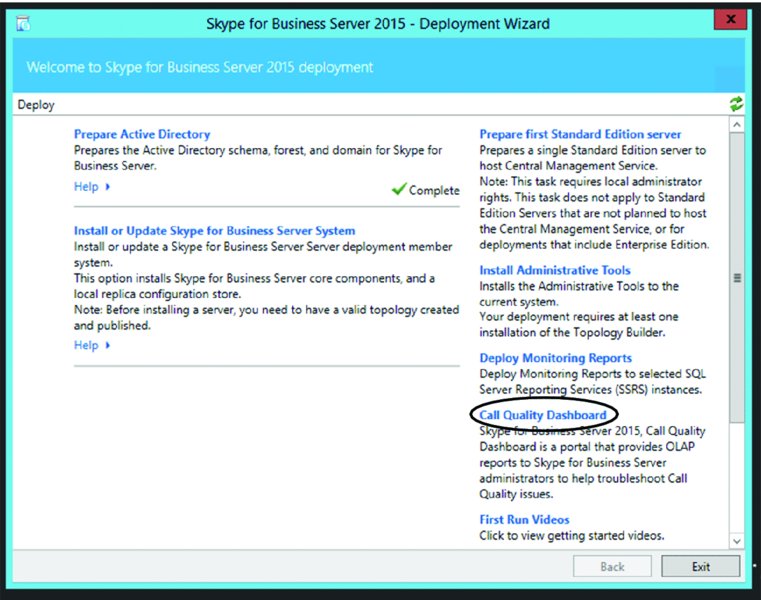
FIGURE 13.4 The Deployment Wizard allows you to deploy Monitoring server reports.
Once you select Deploy Monitoring Reports, the Deployment Wizard prompts you for the following information (although it is already completed with the SQL Server information from Topology Builder, as shown in Figure 13.5):
- Monitoring server
- SQL Server Reporting Services instance
- SQL Server account credentials (for use by the SQL Reporting Services)
- User group (to provide read-only access to the reports)
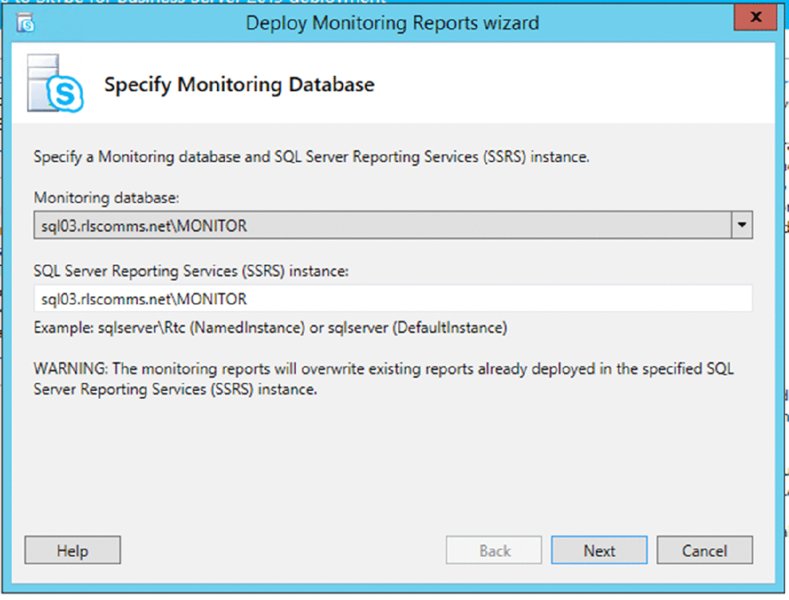
FIGURE 13.5 Deploying the monitoring reports
By default in Lync Server 2010, the wizard attempted to create a secure web page on which to publish the reports (shown in the link on the home page of the Control Panel). However, the installation and configuration of the certificate was a manual process that wasn’t really required. You don’t have to install a certificate on this website, and you can access it without deploying a certificate if required.
Skype for Business takes a more realistic approach by configuring the link as a standard HTTP link rather than HTTPS.
Unfortunately, the Reporting Pack covers only the Monitoring server databases (CDR and QOE); from an IM perspective, the best information that can be retrieved from this is that two users had an IM conversation. The contents of that conversation (assuming archiving is enabled) are stored in the Archiving server database (LCSLog), which does not have any associated Reporting Pack.
Access to this data is via a SQL query, which, providing the user has the correct permissions, can be achieved using any product that supports Open Database Connectivity (ODBC) to retrieve and then manipulate the data. The actual IM conversation is held in Rich Text Format (RTF) and may require further manipulation before it is readable.
Interpreting the Monitoring Server Reports
Data is useless unless it can be interpreted and understood; the data provided by the Monitoring Reporting Pack is extremely rich and can be used in a number of ways.
- Troubleshooting
- Trend analysis for future capacity planning
- Usage analysis for return on investment (ROI) calculations
The following sections will cover the metrics used and how to interpret them as well as provide details on the reports available.
Understanding Voice Quality
Before delving into the details about the reports and how to interpret them, you really need to understand how voice quality is measured and what steps are taken to ensure that quality is retained throughout a call even when outside events impact that quality.
Some of the key metrics measured per call are listed here:
- Endpoint IP address
- Endpoint subnet
- Internal/external connectivity
- Codec used
- Network connectivity type (wired versus wireless)
- Link speed
- Any bandwidth restrictions applied (due to Call Admission Control)
- Signal level send
- Signal level receive
- Echo
- Device CPU
- Device driver/firmware versions
- Packet loss
- Round-trip time
- Latency
- Jitter
- Burst
- Network MOS
- Listening MOS
- Sending MOS
- Degradation MOS
- Audio healer metrics
Individually, these metrics may report values that would be considered “good.” In spite of that, however, the call may still be considered poor quality because often it is the combination of many of the metrics that result in a poor call. For example, latency, jitter, round-trip time, and packet loss may individually be within tolerances, but the combination of packets being dropped along with packets that do arrive but are late will likely create problems on the call from which the healing metrics are unable to recover.
MEAN OPINION SCORE
Traditional telephony provides a subjective assessment of voice quality, based on a scale of 1 to 5, with 5 being perfect and 1 being very poor. A typical PSTN call will rate 2.95 on this scale.
The scoring is carried out by a group of testers listening to an output signal and rating it. This is where the subjective nature of the assessment comes in. It is up to the individual to mark the score, and the average is provided as the final rating.
Because this is a subjective rating, the results can vary from one test to another. Skype for Business Server uses an objective approach, where the output signal is compared to a model to predict the perceived quality, in a way that’s similar to the Perceptual Evaluation of Speech Quality (PESQ) standard.
There are four types of Mean Opinion Score (MOS) values.
Listening Quality MOS
This value is commonly used in VoIP deployments, but it does not consider bidirectional effects such as delay or echo. The following three metrics are wideband MOS-LQ scores:
Network MOS The Network MOS value takes into account only network-related factors (packet loss, jitter, and so on) and can be used to identify network conditions that impact audio quality.
Listening MOS The Listening MOS value is a prediction of the wideband quality of an audio stream being played to a user; it considers the output aspects of the device, as well as codec, transcoding, speech level, and background noise. Problems encountered with the sound output will be identified within Listening MOS.
Sending MOS Sending MOS is the counterpart to Listening MOS, and it is a prediction of the wideband quality of an audio stream being
sentby a user. It deals with the input levels of the signal, considering the same aspects as Listening MOS. Both Listening and Sending MOS problems typically highlight device issues.
Conversational Quality MOS
This value considers the quality on both ends and includes bidirectional effects such as delay and echo. There is one narrowband MOS-CQ score in Lync Server.
Conversational MOS In addition to the aspects considered by Listening and Sending MOS, Conversational MOS also takes into account bidirectional aspects such as echo and delay.
MOS Values by Codec
Being able to understand the different areas of impact in a call will help you narrow down the problem; if one user reports problems hearing a call but another user reports all is well, it can suggest that you should start investigating Listening MOS and the values associated there. What about comparing calls with each other?
Well, it’s extremely difficult to replicate network conditions at any given time; starting with a comparison between the different expectations by codec is useful (shown in Table 13.2).
TABLE 13.2 MOS value by codec
| CALL TYPE | CODEC USED | MAX NETWORK MOS |
| Skype for Business-Skype for Business | SILK | 4.42 |
| Media Bypass | G711 | 4.30 |
| UC-UC | RTAudio (wideband) | 4.10 |
| UC-PSTN (non-media bypass scenarios) | RTAudio (narrowband) | 2.95 |
| UC-PSTN | SIREN | 3.72 |
| Conference Call | G722 | 4.30 |
| Conference Call | SIREN | 3.72 |
Viewing the Reports
Lync Server 2010 reporting offered several improvements to Office Communications Server 2007 R2, including an increase in the number of available reports, tooltips, and color highlighting. (Highlighted text is visible when the mouse is hovered over text, ensuring that potential issues are visible to the reader and easily understood.) Some diagnostic reports are generated only when there is enough data to be worthwhile. For example, problematic-server quality reports are available only on the dashboard when more than 30 data points have been captured.
Reporting in Skype for Business hasn’t changed since Lync Server 2013, which was more of an incremental increase in capability. There weren’t many new reports (since Lync 2010), but one dramatic change is the increase in the amount of data returned in each report; the number of records has been increased to 1,000.
By default the Reporting Pack is installed at the following location (reachable via a web browser):
Http:<SQL server name>:80/ReportServer_<SQL instance name>There are two top-level report types.
Dashboard Provides a weekly or monthly snapshot of the state of the environment, allowing an administrator to quickly see trends in both user usage and hotspots for problems. Each report is a hyperlink to the next level of detail. Figure 13.6 shows the weekly dashboard report.
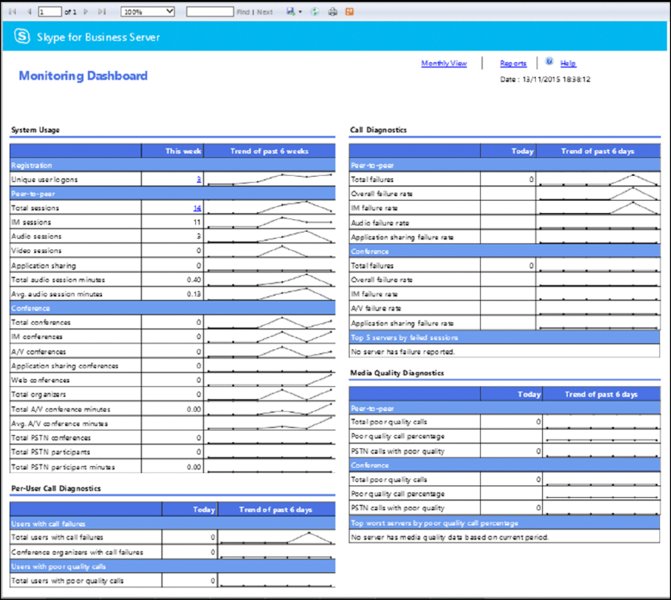
FIGURE 13.6 Weekly dashboard report
Reporting Provides the same types of reports; however, they can be customized based on date ranges or targeted to specific pools or locations.
The reports here can be loosely grouped into four categories.
- System Usage
- Per-User Call Diagnostics
- Call Reliability Diagnostics
- Media Quality Diagnostics
Each of the reports can be further expanded by clicking the built-in hyperlinks in the report to drill further into the details behind the numbers. Figure 13.7 shows the Reporting page.
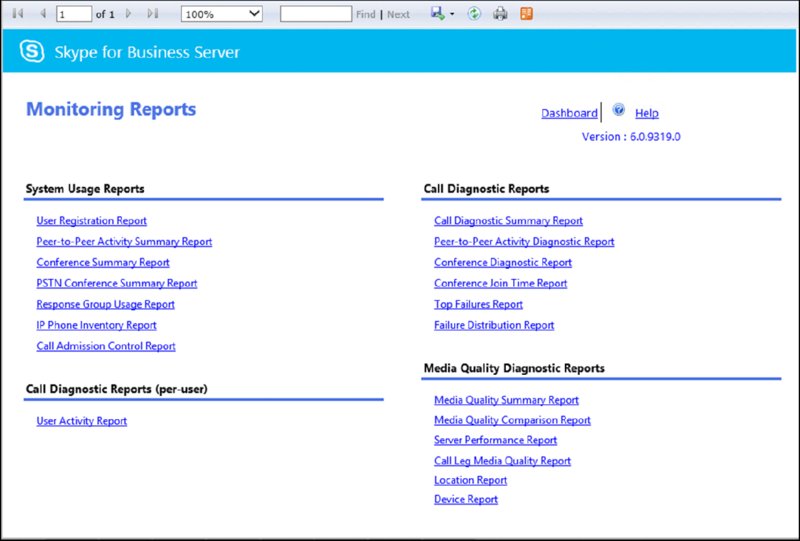
FIGURE 13.7 Reporting home page
System Usage Reports
Within this section, you will find reports used for trend-based analysis, showing the number of connections and typical system usage.
User Registration Report This report provides an at-a-glance view of user login information broken into the following categories:
- Total Logons
- Internal Logons
- External Logons
- Unique Logon Users
- Unique Active Users
By default, this returns both tabular and graphical format broken down on a daily total for all pools; however, this breakdown and pool selection can be modified if required.
Peer-To-Peer Activity Summary Report The Activity Summary Report provides the total breakdown of sessions (the default is daily) for the following communications types:
- Total Peer-To-Peer Sessions
- Total Peer-To-Peer IM Sessions
- Total Peer-To-Peer IM Messages
- Total Peer-To-Peer Audio Sessions
- Total Peer-To-Peer Audio Minutes
- Average Peer-To-Peer Audio Session Minutes
- Total Peer-To-Peer Video Sessions
- Total Peer-To-Peer Video Minutes
- Average Peer-To-Peer Video Session Minutes
- Total Peer-To-Peer File Transfer Sessions
- Total Peer-To-Peer Application Sharing Sessions
Figure 13.8 shows a sample section of this report, with a breakdown of peer-to-peer sessions: total, audio, and IM only on the top graph; with video, file transfer, and application sharing shown on the bottom graph. At this level, you’re simply looking at the trend, and as expected, there is minimal traffic over the weekend; however, the various modalities show different peaks.
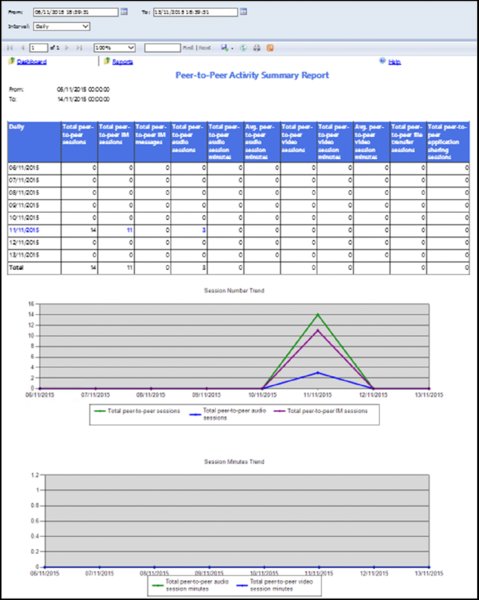
FIGURE 13.8 Peer-To-Peer Activity Summary Report sample
Conference Summary Report Similar to the Peer-To-Peer Activity Report, the Conference Summary Report provides an insight into the conferencing statistics, with the following data reported (default daily):
- Total Conferences
- Total Participants
- Avg. Participants per Conference
- Total A/V Conferences
- Total A/V Conference Minutes
- Total A/V Conference Participant Minutes
- Avg. A/V Conference Minutes
- Total Unique Conference Organizers
- Total Conference Messages
Within these reports, drilling into the detail also shows the conference type, either Audio/Video or Application Sharing.
Figure 13.9 shows a snapshot of the more detailed Conference Activity Report, which is reached via the Conference Summary Report when you select a specific day to view the conference breakdown. This detailed report goes on to break down the different conference types, connection types, and connection locations.
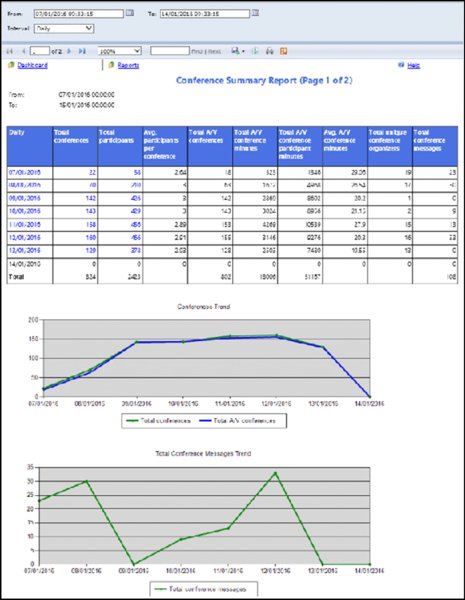
FIGURE 13.9 Conference Summary Report
PSTN Conference Summary Report The PSTN Conference Report provides a view of the conferences that includes PSTN dial-in participants and shows the following:
- Total PSTN Conferences
- Total Participants
- Total A/V Conference Minutes
- Total A/V Conference Participant Minutes
- Total PSTN Participants
- Total PSTN Participant Minutes
- Unique Conference Organizers
Response Group Usage Report This report provides a view of the number of calls being placed to the Response Group service and how they are being answered. The following fields are provided in the initial report:
- Received Calls
- Successful Calls
- Offered Calls
- Answered Calls
- Percentage of Abandoned Calls
- Average Call Minutes by Agent
- Transferred Calls
IP Phone Inventory Report This report provides a view of the deployed phone hardware devices in the environment, specifically these:
- Manufacturer
- Hardware Version
- MAC Address
- User URI
- User Agent
- Last Logon Time
- Last Logoff Time
- Last Activity
Call Admission Control Report This report (shown in Figure 13.10) provides a detailed view of how many calls are being rerouted or rejected based on the policy settings as well as a breakdown of the information per location.
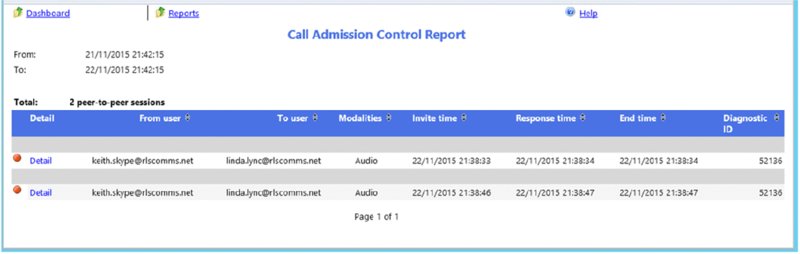
FIGURE 13.10 Call Admission Control Report
A Diagnostic value of 5 indicates that a call has been rerouted via the PSTN.
CALL DIAGNOSTICS REPORTS (PER-USER)
This report is targeted at help-desk staff, and it is used for analysis of activity based on a specific user. The following fields are provided:
- From User
- To User
- Modalities
- Response Time
- End Time
- Diagnostic ID
CALL RELIABILITY DIAGNOSTICS REPORTS
The diagnostics reports are most likely to be of interest to network and server administrators; these are the reports that tell you what is going wrong and what needs to be fixed. Within this section, you’ll see values such as Expected Failures and Unexpected Failures. Expected failures are items such as a caller hanging up or no answer. Unless there are a significant number of these events, they can typically be ignored. Unexpected failures are the ones that typically need to be investigated and corrected.
This is the section of reporting that has had the biggest change compared to Office Communications Server 2007 R2.
Call Diagnostics Summary Report This diagnostics report covers both peer-to-peer sessions and conferences. A breakdown is provided showing the following data:
- Total Sessions
- Failure Rate
- Session Count by Modality (IM, app share, audio, video, file transfer)
- Failure Rate by Modality
Peer-To-Peer Activity Diagnostic Report The Peer-To-Peer Diagnostics Report focuses only on the peer-to-peer aspect, and it provides a daily breakdown of sessions and failures further broken down by modality. The report shows the following data fields (summary and per modality):
- Date
- Success
- Expected Failures
- Unexpected Failures
- Total Sessions
Conference Diagnostic Report Unsurprisingly, the Conference Diagnostic Report provides the same view as the Peer-To-Peer Diagnostic Report, but for conferences.
Conference Join Time Report This report details how long (in milliseconds) it is taking users to join a conference.
Top Failures Report This report covers the top failures based on reported sessions, also providing the number of users impacted and the weekly trend of a particular failure over the previous eight weeks. Each specific failure item provides the following data in the failure information field:
- Request Type
- Response
- Diagnostic ID
- Category
- Component
- Reason
- Description
This information provides the administrator with a great starting point to begin troubleshooting. Figure 13.11 shows the failure information and trend volume graph for a specific failure item.
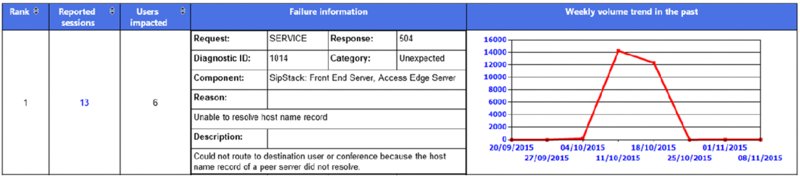
FIGURE 13.11 Top Failures Report
Based on this report, the admin would know that the gateway in question is suffering from a relatively steady number of failures before experiencing a sudden peak at the end of the week. This may correlate to a matching increase in call volume, suggesting that the actual failure rate is steady; however, the specific error shown in this case (Unexpected – 504 – Server Internal Error) suggests an issue that needs to be resolved by taking some action. Because it refers to a gateway, this may be faulty hardware or firmware. In this case, further investigation is needed on the gateway itself to determine the cause and resolution.
Failure Distribution Report The Failure Distribution Report provides an overview of the top 10 items on each of the following lists:
- Session Distribution by Top Diagnostic Reasons
- Session Distribution by Top Modalities
- Session Distribution by Top Pools
- Session Distribution by Top Sources
- Session Distribution by Top Components
- Session Distribution by Top From Users
- Session Distribution by Top To Users
- Session Distribution by Top From User Agents
Based on this section, the admin would know that the majority of failures are because of issues with at least one gateway. This is a summary section showing the total of each error type; however, each diagnostic reason is a hyperlink to further break down the issues, allowing specific gateways to be identified.
MEDIA QUALITY DIAGNOSTICS REPORTS
The final section on the reports home page deals with call quality and diagnostics. These reports provide good information on how the individual components such as servers, devices, and network locations are coping in the environment.
Media Quality Summary Report At a high level, the report is categorized into three sections.
- Audio Call Summary
- Video Call Summary
- Application Sharing Call Summary
Each section provides the quality view of the different endpoints, broken down by the following categories:
- UC Peer to Peer
- UC Conference Sessions
- PSTN Conference Sessions
- PSTN calls (non-bypass): UC Leg
- PSTN calls (non-bypass): Gateway Leg
- Other Call Types
Each of these categories is further broken down by specific software versions of the client or device.
For each combination entry, the following data is displayed:
- Endpoint Type
- Call Volume
- Poor Call Percentage
- Call Volume (Wireless Call)
- Call Volume (VPN Call)
- Call Volume (External Call)
- Round Trip (ms) (Audio Only)
- Degradation (MOS) (Audio Only)
- Packet Loss (Audio Only)
- Jitter (ms) (Audio and App Sharing Only)
- Healer Concealed Ratio (Audio Only)
- Healer Stretched Ratio (Audio Only)
- Healer Compressed Ratio (Audio Only)
- Outbound Packet Loss (Video Only)
- Inbound Packet Loss (Video Only)
- Frozen Frame % (Video Only)
- Outbound Avg. Frame Rate (Video Only)
- Inbound Avg. Frame Rate (Video Only)
- Inbound Low Frame Rate % (Video Only)
- Client Health % (Video Only)
- Avg. Relative One Way (App Sharing Only)
- Avg. RDP Tile Processing Latency (App Sharing Only)
- Total Spoiled Tile % (App Sharing Only)
Media Quality Comparison Report The Media Quality Comparison Report provides a view to the number of calls on a per-day basis over the following items:
- Call Volume
- Degradation (MOS)
- Poor Call Percentage
- Round Trip (ms)
- Packet Loss
- Jitter (ms)
- Healer Concealed Ratio
- Healer Stretched Ratio
- Healer Compressed Ratio
Server Performance Report The Server Performance Report provides insight into the performance of the individual server roles and gateways. It provides data similar to that of the Media Quality Summary Report (and is similarly broken into sections for audio/video/app sharing).
- Server
- Call Volume
- Poor Call Percentage
- Round Trip (ms) (Audio Only)
- Degradation (MOS) (Audio Only)
- Packet Loss (Audio Only)
- Jitter (ms) (Audio And App Sharing Only)
- Healer Concealed Ratio (Audio Only)
- Healer Stretched Ratio (Audio Only)
- Healer Compressed Ratio (Audio Only)
- Outbound Packet Loss (Video Only)
- Inbound Packet Loss (Video Only)
- Frozen Frame % (Video Only)
- Outbound Avg. Frame Rate (Video Only)
- Inbound Avg. Frame Rate (Video Only)
- Inbound Low Frame Rate % (Video Only)
- Client Health % (Video Only)
- Avg. Relative One Way (App Sharing Only)
- Avg. RDP Tile Processing Latency (App Sharing Only)
- Total Spoiled Tile % (App Sharing Only)
- Trend
In addition, an option to view the data trended for the previous week is provided for each server role or gateway.
Location Report Whereas the previous two reports look at the breakdown per endpoint, this report looks at the network viewpoint and shows per subnet (caller and callee).
The following data is provided:
- Caller Subnet
- Callee Subnet
- Call Volume
- Poor Call Percentage
- Round Trip (ms)
- Degradation (MOS)
- Packet Loss
- Jitter (ms)
- Healer Concealed Ratio
- Healer Stretched Ratio
- Healer Compressed Ratio
Device Report The Device Report looks at the specific hardware device model or individual drivers used by the operating system to provide a view on the data. This can provide a useful view of which noncertified devices are being used in the environment, or more likely which calls are being made using built-in devices.
The following view is provided of the data:
- Capture Device
- Render Device
- Call Volume
- Poor Call Percentage
- Unique Users
- Ratio of Voice Switch Time
- Ratio of Microphone Not Functioning
- Ratio of Speaker Not Functioning
- Call With Voice Switch (%)
- Echo in Microphone (%)
- Echo Send (%)
- Calls With Echo (%)
Figure 13.12 shows a sample section from this report.
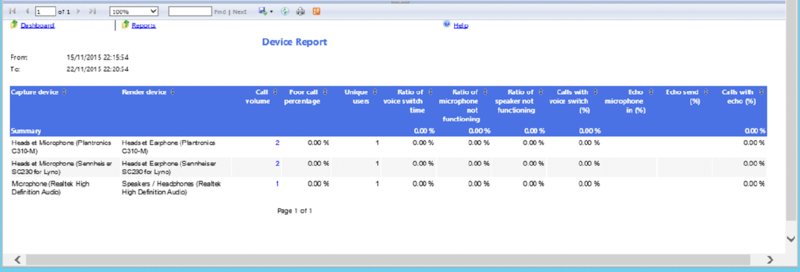
FIGURE 13.12 Device Report
THE CALL DETAIL REPORT
As mentioned, many of these reports link through to other reports, each of which reduces the scope and provides more detailed data resulting in the Call Detail Report, which provides a full breakdown of all the interaction and statistics of the call.
There is no direct method to access this report because it deals with a single call only and, therefore, the data must be filtered in some method first. The quickest route to get call details is to use the User Activity Report to filter on a specific user and then to select the detail of a specific call.
We will discuss the usefulness of this report in Chapter 15, “Troubleshooting.” Figure 13.13 shows an example section (note that the “Call Information” section is closed in the screenshot). This report is also known as the Peer-To-Peer Session Detail Report.
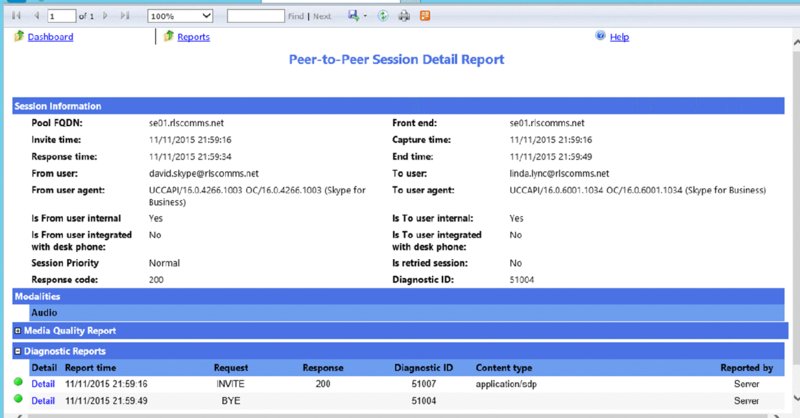
FIGURE 13.13 Peer-To-Peer Session Detail Report
This report contains almost 200 fields of information, broken down into the following sections:
Call Information Here you will see information regarding the users (or PSTN numbers) involved in the call, the start time, and the duration along with client hardware and software version information.
Media Line (Main Audio)—MediaLine Information The Media Line information section deals with the network identifiers such as network address information, internal/external connectivity, connection speeds, and whether any bandwidth controls are in place due to Call Admission Control.
Media Line (Main Audio)—Caller/Callee Device and Signal Metrics Both caller and callee have separate sections here, providing device identifiers (including device driver versions), signal send and receive information, and any hardware (microphone/speaker) issues detected.
Media Line (Main Audio)—Caller/Callee Client Event Again, this is repeated for both caller and callee, and this section provides reporting on the percentage of issues detected around the device hardware and signal.
Media Line (Main Audio)—Audio Stream (Caller ➢ Callee)/(Callee ➢ Caller) This section deals with the specific audio stream in one direction. The following section provides the same data in the other direction. Here you see information regarding the codec used and network impacts (packet loss, jitter, and so on).
Typically, this is the most viewed section because it provides the summary impact due to the underlying network conditions.
Media Line (Main Audio)—Video Stream (Caller ➢ Callee)/(Callee ➢ Caller) The final two sections provide the same information as the preceding except in dealing with the video stream. This is included only for calls that have a video aspect.
A massive amount of information is captured with every call. Some of the fields will be self-explanatory, but you will need more information to understand some of the other fields. In these cases, tooltips are provided, but not all fields have tooltips because they are presumed to be familiar.
Also, to help you understand which values are potentially causing problems, color coding is enabled on the reports. Yellow indicates a warning, and red indicates a high risk of problems.
CUSTOMIZING REPORTS
While the number of reports has increased dramatically with each version since the launch of Office Communications Server 2007, they still fall short of the requirements of many customers.
The database schemas for both QoE and CDR databases are detailed in the Skype for Business help file and can also be viewed on TechNet. You can view the QoE schemas at the following location:
http://technet.microsoft.com/en-us/library/gg398687.aspx
You can view the CDR schemas here:
http://technet.microsoft.com/en-us/library/gg398570.aspx
Provided the correct permissions are assigned to a user, it is relatively easy to connect to those databases via ODBC and retrieve the data you’ll need to provide customized reports. You can also use SQL Server (any version) Report Builder to generate reports that can be added to the web page, enabling easy generation and a single storage/execution location for reports.
Monitoring Service with the Management Pack
The other aspect of monitoring is server or service monitoring, which is needed so that system administrators can alert their users when aspects of the service fail (or begin to fail). Management packs provide a prepackaged set of rules and alert thresholds you can use to quickly set up and monitor the Skype for Business environment. The Skype for Business Monitoring Management Pack is available to download from the following location:
https://www.microsoft.com/en-us/download/details.aspx?id=47364
The management pack configuration should be tailored to each individual environment (baselined) to ensure that these thresholds do not produce inappropriate alerts. The last thing any administrator wants is to be paged at 1 a.m. for a problem that could wait until morning!
A good example of this scenario is in an Enterprise Edition pool with four Front End servers. If one server fails, the actual Skype for Business services (registrar, routing, Address Book, conferencing, and so on) provided by the pool will continue to operate, and ideally have been scaled to cope with a single server failure, so the impact will be minimal (quite possibly negligible) to the users. The server could wait until morning to be repaired.
Detailed steps on how to configure SCOM are beyond the scope of this book; however, assuming SCOM has been installed and configured with the management pack deployed to discover the Skype for Business servers, the next few steps will show how to change thresholds on alerts from the default. It should be noted that the Lync Server 2010 management pack leveraged the CMS to retrieve the topology, but with Skype for Business (and Lync Server 2013) a slightly different approach is used. The SCOM agents discover themselves and report their existence to the SCOM server. This simplifies the discovery and administration of the environment for SCOM.
From within the System Center Operations Manager (SCOM) 2012 console, select the Authoring tab, and within the management pack objects, select Object Discoveries, change the scope (using the button on the toolbar), and select View All Targets. Enter Skype in the Look For box to filter for Skype for Business objects. Figure 13.14 shows the results.
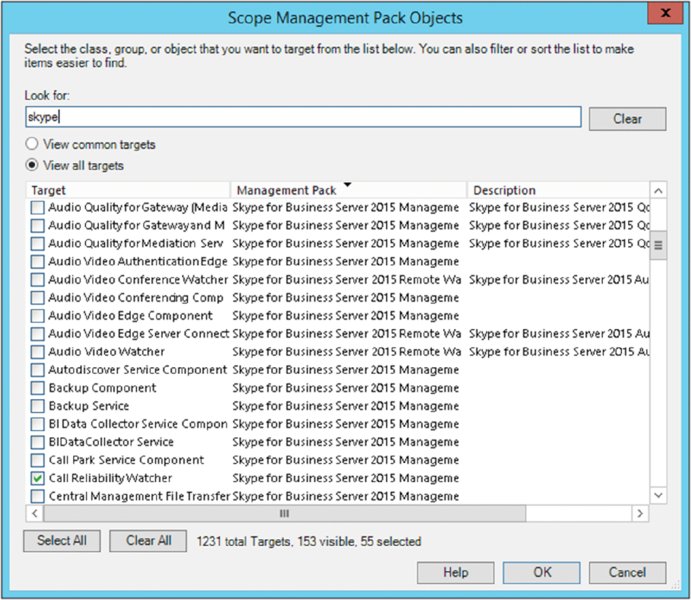
FIGURE 13.14 Changing the scope within SCOM to show Skype for Business objects
In this example, you will change a scope item, so selecting Audio Quality For Gateway (Mediation Server Bypass) and clicking OK will take you back to the Object Discoveries view, this time including the QoE Discovery entry under the selected type: Audio Quality For Gateway (Mediation Server Bypass).
Right-click QoE Discovery and select Overrides ➢ Override The Object Discovery ➢ For All Objects Of Class: QoE Monitoring. See Figure 13.15.
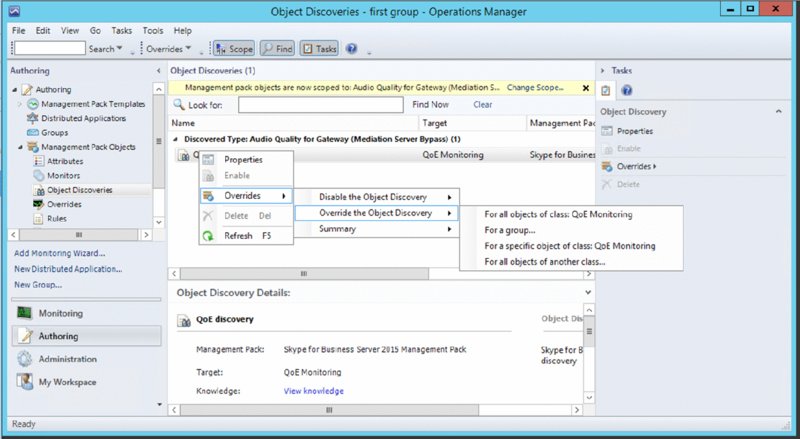
FIGURE 13.15 Enable overrides on Skype for Business–monitored values in SCOM.
The Override Properties page then appears; the Name column indicates the items queried from the database, and the description is provided in the Details window. Selecting an item in the Override column will enable the specific row to be modified at the necessary value, and clicking OK will apply the change.
The management pack raises alerts at different levels, ensuring the correct response based on the impact. The alerts raised provide relevant information to help identify the causes and help troubleshoot, ideally resulting in a faster recovery time. In some cases, there will be links directly to the CDR or QoE record itself.
The management pack will leverage the information from the Central Management Store to determine the topology, which will help you accurately assign the rules to the server roles with limited administrative interaction. So, while Agent Discovery is used for the servers to report back, the CMS is still checked to ensure that the correct capability is assigned on each server—it’s just no longer used to find the servers themselves.
End-to-end verification is provided through the use of synthetic transactions, which can test almost the complete range of functionality required from a client (including simulation of PSTN calling).
These synthetic transactions can be configured to run periodically (it is recommended to have dedicated accounts configured for this), and a failure can be used to generate a high-priority alert, which is automatically resolved if the command is successful on the next attempt. Synthetic transactions can be run without integration with SCOM; however, for full automated alerting and reporting, SCOM is required. Table 13.3 shows the full list of all synthetic transactions.
TABLE 13.3 Synthetic transactions
| SYNTHETIC TRANSACTION CMDLET | DESCRIPTION |
Test-CsAddressBookService* |
Tests the functionality of the Address Book service. This can be used to simulate an individual user. |
Test-CsAddressBookWebQuery* |
Similar to the Test-CsAddressBookService, except it tests the web query functionality. |
Test-CsASConference |
Tests application sharing using a pair of users. |
Test-CsAudioConferencingProvider |
Tests a connection to a third-party audio conference provider. |
Test-CsAVConference* |
Tests audio/video conference functionality using a pair of users. |
Test-CsAVEdgeConnectivity* |
Verifies connectivity using the AV edge component. |
Test-CsCertificateConfiguration |
Returns information on the certificates in use. |
Test-CsClientAuthentication |
Confirms whether a user can log on when using the Skype for Business–provided user certificate. |
Test-CsComputer |
Verifies that services are running, Active Directory groups have been configured correctly, and the firewall ports have been opened. |
Test-CsDatabase |
Tests configuration of the databases. |
Test-CsDataConference* |
Verifies user participation within a data collaboration conference session. |
Test-CsDialPlan |
Tests a phone number against a dial plan, returning the normalization rule, which will be applied, and the results of that normalization. |
Test-CsExStorageConnectivity |
Verifies that the Lync Server Storage Service is working on a Front End server. |
Test-CsExStorageNotification |
Verifies that the Lync Server Storage Service can subscribe to the Exchange Server 2013 notification service. |
Test-CsExUMConnectivity* |
Tests connectivity to Exchange UM. |
Test-CsExUMVoiceMail |
Verifies connectivity and that a voice mail message was left. |
Test-CsFederatedPartner |
Confirms the status of federation with an external domain. |
Test-CsGroupExpansion |
Confirms the functionality of the group expansion capability on the pool. |
Test-CsGroupIM* |
Tests the ability of two users to carry out an IM conference. |
Test-CsIM* |
Tests the ability of two users to carry out a peer-to-peer IM. |
Test-CsInterTrunkRouting |
Verifies routing and PSTN usage via a specific SIP trunk. |
Test-CsKerberosAccountAssignment |
Verifies that the assigned Kerberos account is working correctly. |
Test-CsLisCivicAddress |
Verifies address information against the Master Street Address Guide held by the E911 provider. This is the only test cmdlet that is not a synthetic test. It is capable of updating the LIS database. |
Test-CsLisConfiguration |
Confirms the address configuration when given a specific subnet (or other location identifier). |
Test-CsLocationPolicy |
Determines which location policy will be used. |
Test-CsMcxConference |
Tests three-user participation in a conference via the Mobility Service. |
Test-CsMcxP2PIM* |
Tests a peer-to-peer IM via the Mobility Service. |
Test-CsMcxPushNotification |
Tests that the push notification (Apple and Microsoft) service is working. |
Test-CsOUPermission |
Verifies that the permissions have been applied correctly within the Active Directory OU. |
Test-CsP2PAV* |
Tests audio/video functionality using a pair of users in peer-to-peer mode (rather than conferencing). |
Test-PersistentChatMessage* |
Verifies that a message between two users using the Persistent Chat service has been sent and received. |
Test-CsPhoneBootstrap |
Verifies that the environment is configured to allow 2010 Phone Edition devices to connect and that a user can log on. |
Test-CsPresence* |
Confirms that a user can log on and publish presence information as well as receive presence updates from another user. |
Test-CsPstnOutboundCall |
Tests the ability of a user to make a PSTN call. A call will actually be placed and must be answered for this test to succeed. |
Test-CsPstnPeerToPeerCall* |
Similar to Test-CsPstnPeerToPeerCall, except the cmdlet places a call to another user via the gateway and will answer the call on behalf of the user. |
Test-CsRegistration* |
Confirms whether a user can log on. |
Test-CsReplica |
Verifies the status of replica service on the local computer. |
Test-CsSetupPermission |
Confirms that Active Directory has been configured to allow Skype for Business to be installed. |
Test-CsTopology |
Allows testing of the validity of a server or service. |
Test-CsTrunkConfiguration |
Confirms the operation of the trunk configuration when presented with a phone number. |
Test-CsUcwaConference |
Tests connectivity through the web service to a conference for two users. |
Test-CsUnifiedContactStore* |
Verifies whether the Unified Contact Store can access a user’s contacts. |
Test-CsVoiceNormalizationRule |
Tests a phone number against a specific normalization rule and returns the resulting number after the rule has been applied. |
Test-CsVoicePolicy |
Tests a phone number against a specific voice policy and returns the determined route. |
Test-CsVoiceRoute |
Tests a phone number against a specific route pattern and returns success or fail based on whether the number is accepted by the route. |
Test-CsVoiceTestConfiguration |
Tests a combination of dial plan and policy to confirm that routing works as expected. |
Test-CsVoiceUser |
Confirms the route for a PSTN call from a specific user based on the voice configuration. |
Test-CsWatcherNodeConfiguration |
Verifies the watcher node configuration. |
Test-CsWebApp |
Verifies that authenticated users can use Web App to join a conference. |
Test-CsWebAppAnonymous |
Verifies that anonymous users can use the Web App to join a conference. |
Test-CsWebScheduler |
Tests whether a user can use the Web Scheduler to schedule an online meeting. |
Test-CsXmppIM* |
Tests sending of a message via an XMPP gateway. |
* Indicates items that can be used by SCOM for continuous synthetic transaction testing.
For component monitoring (via SCOM), the alerts are separated into Key Health Indicators and non–Key Health Indicators. A Key Health Indicator is a service-impacting issue (which is worth being paged about at 1 a.m.), and non–Key Health Indicators are those aspects that do not impact service, such as problems with components that have resiliency. These are automatically resolved if the service returns to health.
Chapter 15 provides more details (and examples) of running synthetic transactions from within PowerShell (without using SCOM integration).
Deploying Synthetic Transactions with SCOM
While running the synthetic transactions from the PowerShell environment is a relatively straightforward task, configuring automatic transaction execution and monitoring within SCOM is a multistep process.
You’ll need to define one or more watcher nodes. A watcher node is a server responsible for periodically executing synthetic transactions for a pool. If you have deployed multiple pools and want to have automatic synthetic transactions run on each of them, you will need one server per pool.
The server should have the following minimum specifications:
- Four-core processor 2.33GHz or higher
- 8GB RAM
- 1Gbps network adapter
- Windows Server 2008 R2 or Windows Server 2012
The additional software prerequisites for the watcher node are as follows:
- .NET Framework 4.5
- Windows Identity Foundation
- System Center Operations Manager (SCOM) Agent
- Skype for Business core installation files (
OCSCORE.msi) - Unified Communications Managed API
In addition to having a SCOM Agent installed, the Skype for Business core and Skype for Business Replica MSI files need to be installed onto the watcher node. The easiest way to do this is to run the Skype for Business Server setup.exe file with the /BootStrapLocalMgmt switch. Then verify the installation by opening the Skype for Business Management Shell and running the Get-CsWatcherNodeConfiguration cmdlet.
If this command is being run for the first time, no response is expected because nothing is yet configured for the watcher node. If a response is received, it typically indicates an error.
Occasionally, we have seen the command-line execution of setup.exe fail to enable the Skype for Business services upon completion—be sure to check!
Once the core components are installed, the Watchernode.msi executable needs to be run to install the components specific to the watcher node. This executable is available from the same download location as the management pack.
Watcher nodes can be installed both inside and outside the enterprise to verify a large number of aspects of a Skype for Business deployment.
A watcher node can use two types of authentication.
- Trusted server (using certificates)
- Credentials (using a username and password)
Because the watcher node is not directly part of the topology, a trusted application pool must be configured with the watcher node as a member server of the application pool. Once the pool is created, a trusted application service is created.
Both of these tasks can be performed using PowerShell or Topology Builder. There are no options to configure trusted applications in the Control Panel.
To create a new Trusted Application pool, first identify the site ID (SiteId) for the site to which the application pool will be associated. Figure 13.16 shows the output of Get-CsSite.
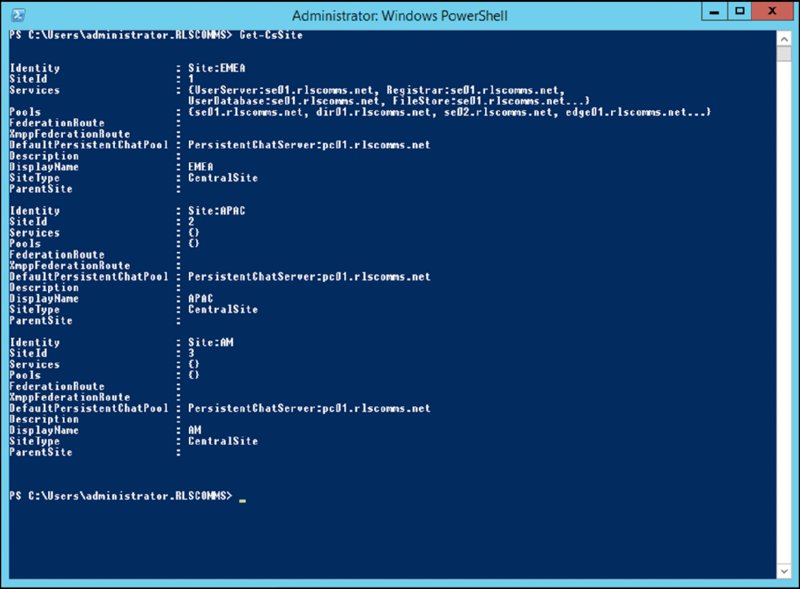
FIGURE 13.16 Output of Get-CsSite
With the site ID, run the following command (where the Identity parameter is the FQDN of the watcher node):
New-CsTrustedApplicationPool -Identity watcher01.rlscomms.net -Site 1
-Registrar se01.rlscomms.net-ThrottleAsServer $True
-TreatAsAuthenticated $True -OutboundOnly $False -RequiresReplication $True -ComputerFqdn watcher01.rlscomms.net
The response will be similar to this:
Identity             : 1-ExternalServer-11
Registrar            : Registrar:se01.rlscomms.net
FileStore            :
ThrottleAsServer     : True
TreatAsAuthenticated : True
OutboundOnly         : False
RequiresReplication  : True
AudioPortStart       :
AudioPortCount       : 0
AppSharingPortStart  :
AppSharingPortCount  : 0
VideoPortStart       :
VideoPortCount       : 0
Applications         : {}
DependantServiceList : {}
ServiceId            : 1-ExternalServer-11
SiteId               : Site:EMEA
PoolFqdn             : watcher01.rlscomms.net
Version              : 7
Role                 : TrustedApplicationPool
Get-CsPool can also be run to verify that the application pool is configured.
The trusted application service is created using the following command:
New-CsTrustedApplication -ApplicationId "STWatcher-01"
-TrustedApplicationPoolFqdn watcher01.rlscomms.net-Port 5061
The ApplicationId parameter can be any text entry. You can include the site name or ID so that it is easy to identify which application is dealing with which site. The Port parameter can be any unused port.
Figure 13.17 shows the result of this command.
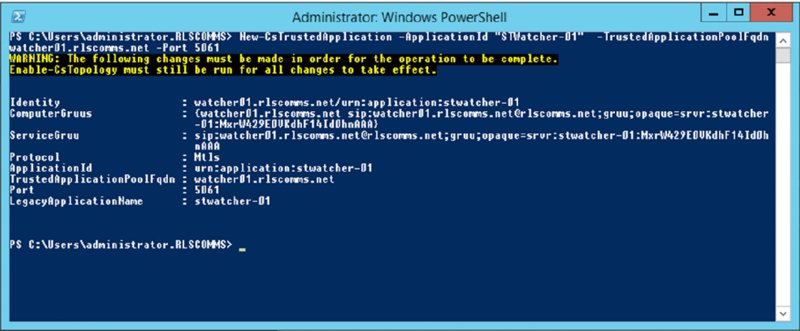
FIGURE 13.17 New-CsTrustedApplication
The Enable-CsTopology cmdlet needs to be run to apply these topology changes.
There is no output from this cmdlet, although status bars are displayed across the top of the PowerShell window.
To use certificate authentication, you’ll need to request a certificate for the watcher node. You can use the same certificate wizard used in the rest of the Skype for Business Server role setup processes, only this time you can start it by using the Skype for Business Server Deployment Wizard from the Start menu. Once it’s started, click Install Or Update Skype for Business Server System ➢ Request, Install, Or Assign Certificate and follow the now-familiar certificate wizard to request and assign a default certificate.
Next you’ll need to install the actual Watchernode.msi file, and because you’re using certificate authentication, you must use the following command:
Watchernode.msi Authentication=TrustedServerFor some reason, Microsoft has made this command case sensitive!
If you wanted to use credential authentication, the watcher node computer network service account should be added to the RTC Local Read-only Administrators group on the local computer. The command for credential authentication is as follows:
Watchernode.msi Authentication=NegotiateOnce the WatcherNode.msi executable has completed, you need to restart the server for it to take effect.
You’ll need to create and assign user accounts to the Health Monitoring Configuration entry, using the following command:
New-CsHealthMonitoringConfiguration -TargetFqdn se01.rlscomms.net
-FirstTestUserSipUri sip:[email protected]
-SecondTestUserSipUri sip:[email protected]
The output will be as shown here:
Identity                 : se01.rlscomms.net
FirstTestUserSipUri      : sip:[email protected]
FirstTestSamAccountName  :
SecondTestUserSipUri     : sip:[email protected]
SecondTestSamAccountName :
TargetFqdn               : se01.rlscomms.net
The health monitoring configuration is the stored configuration that is used for the synthetic transactions. Test-Cs* cmdlets that require user accounts will use accounts from this configuration, if available; otherwise, they will prompt for the account information. Obviously, for a noninteractive solution within SCOM, you’ll need to use this stored configuration.
Set-CsTestUserCredential can also be used to define multiple user credentials for testing. This requires the storing of the user passwords in the Credential Manager Store on the machine in which it is run, so it must be run on the watcher node itself.
For machines outside the corporate network, this method must be used (do not use actual “live” user accounts for this!):
Set-CsTestUserCredential -SipAddress "sip:[email protected]"
-UserName "rlscomms	est1_skype" -Password "Password1"
Set-CsTestUserCredential -SipAddress "sip:[email protected]"
-UserName "rlscomms	est2_skype" -Password "Password1"
Up to this point, you have configured the watcher node and the user accounts, but you have yet to define the watcher node configuration; you do this by using the New-CsWatcherNodeConfiguration cmdlet as shown here. Figure 13.18 shows the output.
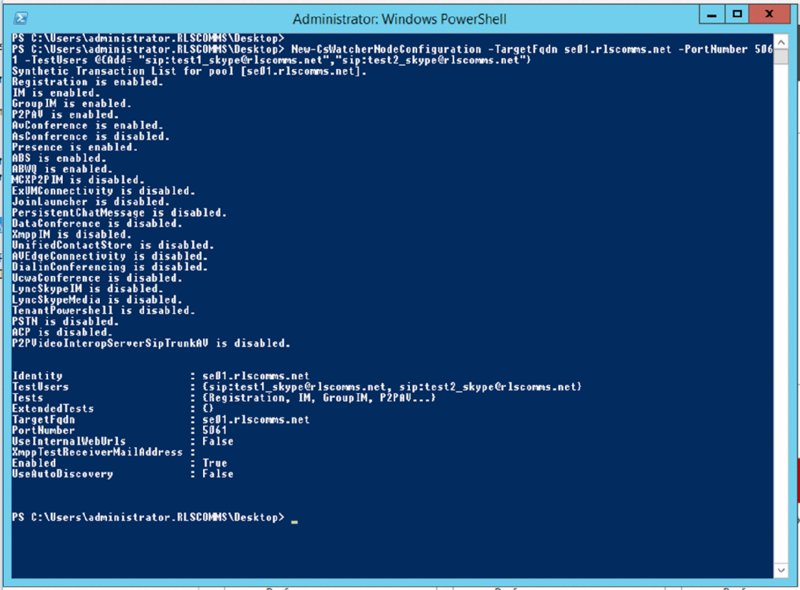
FIGURE 13.18 Defining the watch node configuration
New-CsWatcherNodeConfiguration –TargetFqdn se01.rlscomms.net
–PortNumber 5061 –TestUsers
@{Add= "sip:[email protected]","sip:[email protected]"}
You can see from the output two entries for defined tests.
TestsExtendedTests
These entries allow you to configure the tests for each watcher node; you may have certain functionality you want to test on a particular pool, for example. By default, the ExtendedTests entry is empty, and the Tests entry contains the following tests:
- Registration
- IM
- GroupIM
- P2PAV (peer-to-peer audio/video sessions)
- AvConference (audio/conferencing)
- Presence
- ABS (Address Book service)
- ABWQ (Address Book Web Query)
To create and enable an extended test, you must use the -ExtendedTests parameter, but first you must define the test and assign to a variable, as in the following example:
$extest = New-CsExtendedTest -TestUsers "sip:[email protected]",
"sip:[email protected]" -Name "PSTN Test" -TestType "PSTN"
New-CsWatcherNodeConfiguration -TargetFqdn "se01.rlscomms.net"
-PortNumber 5061 -TestUsers "sip:[email protected]",
"sip:[email protected]" -ExtendedTests @{Add=$x}
Figure 13.19 shows the synthetic transactions in operation. In this case, the Front End server has been shut down, so you can see the synthetic transaction failure alerts. When the servers come back online, they will automatically clear (when the next synthetic transaction is successful).
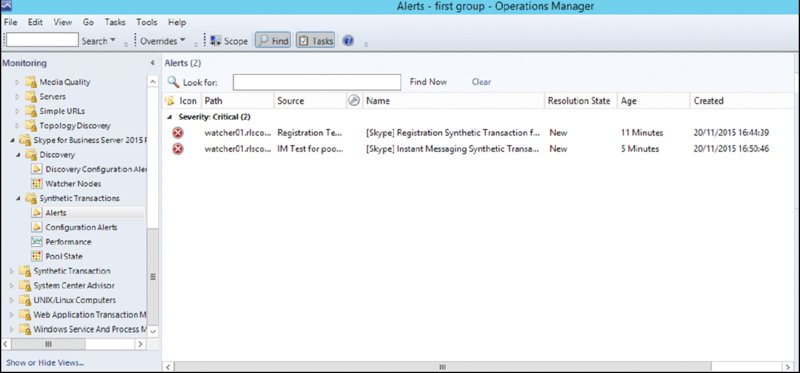
FIGURE 13.19 Synthetic transaction failure alerts
Useful information is contained within the Alert Details section, providing initial suggestions on the problem and where to begin troubleshooting.
Using Statistics Manager
Building on to the SCOM monitoring is a free download from Microsoft called Statistics Manager that enables real-time Key Health Indicator reporting via a web interface.
You can find the download here:
https://www.microsoft.com/en-us/download/details.aspx?id=49491 Three files are part of the package.
StatsManPerfAgent.msiStatsManPerfAgentListener.msiStatsManWebSite.msi
In addition, the installation requires a component called Redis as its prerequisite (version 2.8 or later). You can find it at this location:
https://github.com/MSOpenTech/redis/releases
Figure 13.20 shows the architecture of how these tie together.
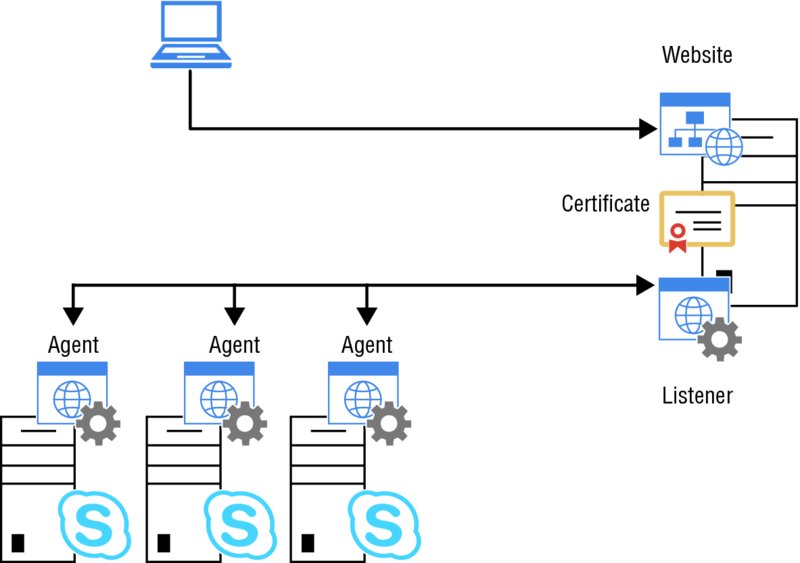
FIGURE 13.20 Statistics Manager
As you can see, you need a server to run this collection and reporting process, and the only prerequisite for this is that it is running Windows Server 2012 R2 or later. The installation process for Redis is straightforward; as usual, accept the EULA and define the installation directory. Figure 13.21 shows only configuration available in the installation, and the recommendation is to leave the default values.
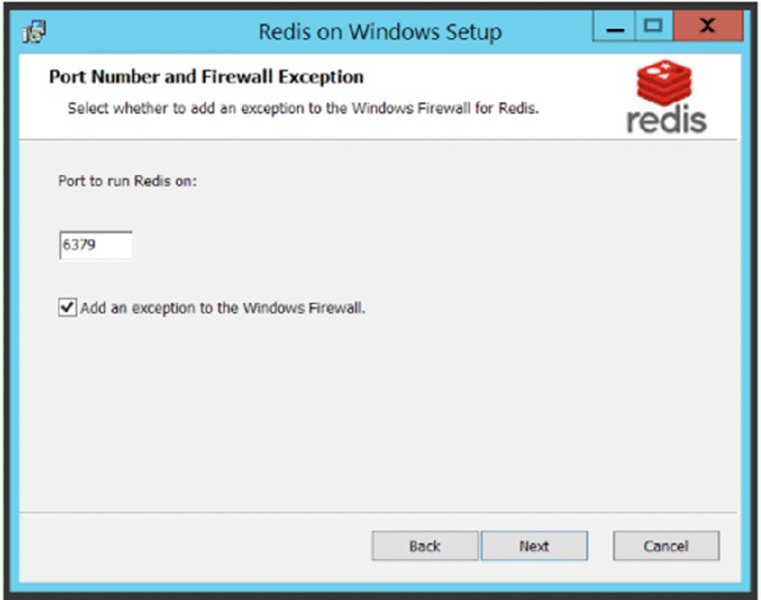
FIGURE 13.21 Redis installation
Once it’s installed, you will need to request a certificate. The certificate is used to encrypt the data transfer from the agents to the listener and can be used for the website if required. The agents and listener only use the certificate thumbprint, so there is no need for a “proper” certificate chain to be used; a self-signed one is fine. You can create one using the following PowerShell:
New-SelfSignedCertificate -DnsName StatsManListener -CertStoreLocation Cert: LocalMachineMyThe next step is to install the listener application, StatsManPerfAgentListener.msi.
As with the Redis app, there’s only one configuration page, as shown in Figure 13.22.
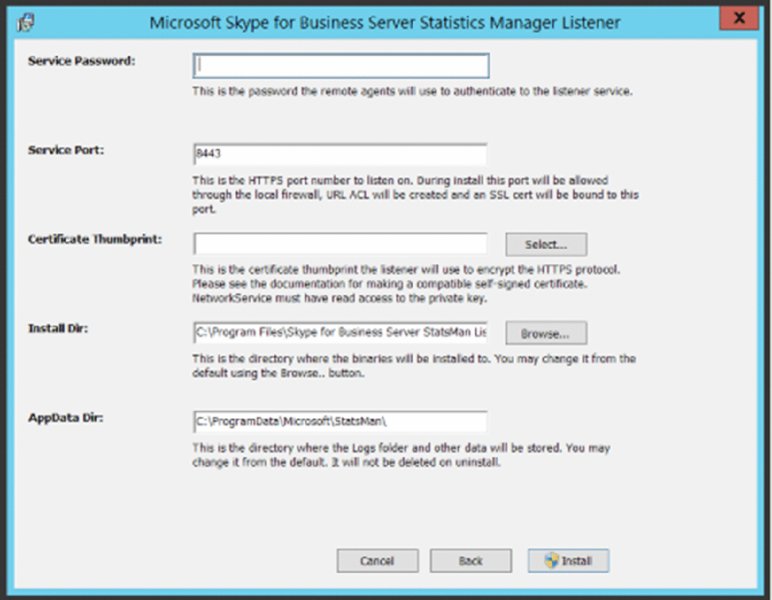
FIGURE 13.22 Configuring the listener
A few items need to be completed here. The service password is used as a preshared key between the agents and the listener. The Select button allows you to define which certificate thumbprint will be used for the encryption.
Once you have it installed, you can check the status by browsing to https: //localhost:8443/healthcheck on the listener server. A simple text page is returned including some of the text shown here:
HealthCheckRequestCount: 1
InvalidCredentialsCount: 0
InvalidHttpRequests: 0
MessageDecodeFailureCount: 0
MessageReceivedCount: 0
ReceivedBytesTotal: 0

CurrentMessagesReceivedPerSecond: 0
MessagesPerSecondTimeFrameMilliseconds: 79,770
MessagesReceivedPerSecondPeak: 0
ValuesWritten: 0
ValuesWrittenInternal: 0
CurrentValuesWrittenPerSecond: 0
ValuesWrittenPerSecondTimeFrameMilliseconds: 79,770
ValuesWrittenPerSecondPeak: 0
ValuesWrittenSampleStoreFailures: 0
ValuesWrittenPersistentStoreFailures: 0
ValuesWrittenUpdateStoreFailures: 0
ValuesFilteredFromAggregation: 0
CounterStoreWriterCount: 0
KnownServerCount: 1
CounterBucketCount: 0
CounterBucketLostDataCount: 0
BucketAddDataValueFailureCount: 0
TotalCounterBucketAggregationValues: 0
To ensure everything is working correctly, look for the following:
- If the
/healthcheckpage shows up, then the listener has been installed successfully. - If
KnownServerCount(shown in bold) is 1 or higher, then the connection to the Redis installation was successful. - Once agents have been installed, you can come back and check that the
ValuesWrittencounter is incrementing.
One step to be completed on the listener server is to import the server role configuration; this is taken from a topology pool export.
Get-CsPool | Export-CliXml -Path poolinfo.xmlOn the listener server, navigate to C:Program FilesSkype for Business Server StatsMan Listener and execute the following:
.Updates-StatManServerInfo.ps1 -CsPoolFile poolinfo.xmlNext up is to install the Statistics Manager website using StatsManWebSite.msi. Another straightforward installation process, Figure 13.23 shows the only configuration options available.
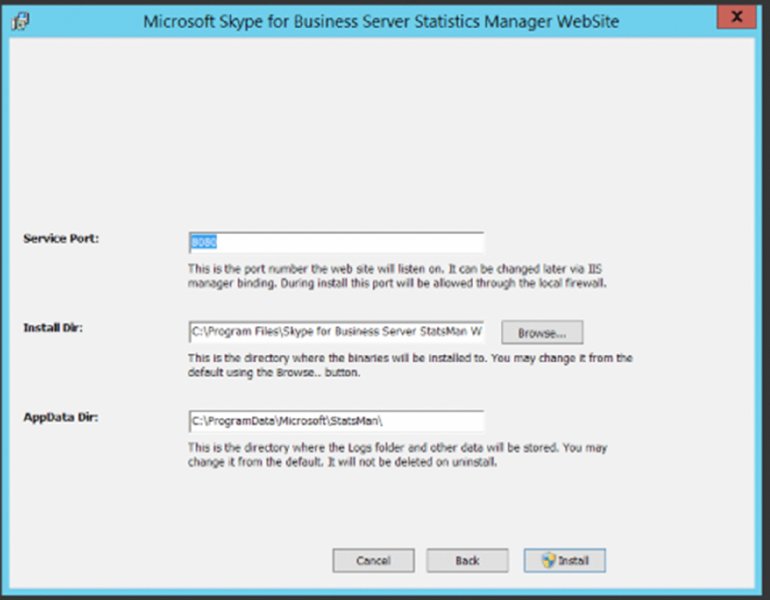
FIGURE 13.23 Configuring the website
The default web port used is 8080, and if needed, you can change this later using IIS Manager. Security is provided via a local security group called StatsManWebSiteUsers, and you can add accounts to this group as needed.
Once that’s configured, you’ll see a screen similar to Figure 13.24.
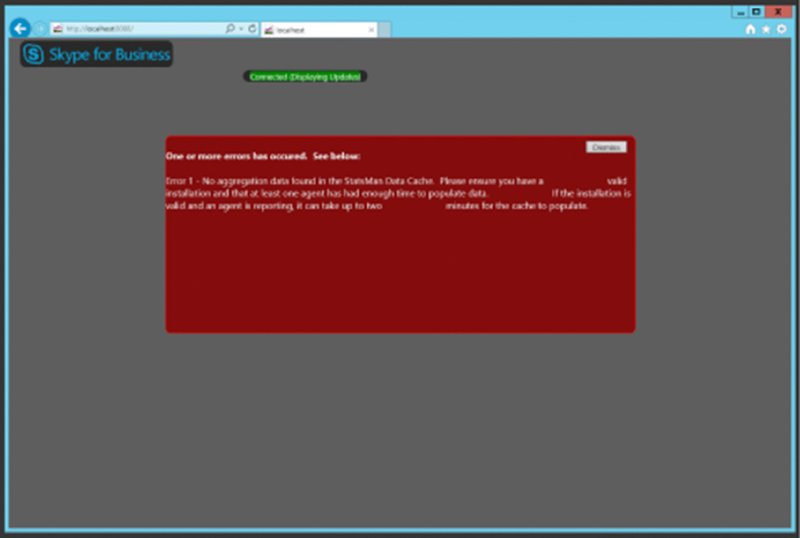
FIGURE 13.24 Viewing the website
Once the website is up and running, it’s time to install agents, using the StatsManPerfAgent.msi file. Similar to the listener configuration (Figure 13.22), there are prompts for the password and the certificate thumbprint, as well as the usual EULA to accept. Once configured, the agent will run and start to feedback data; it can take up to 15 minutes before data starts to be displayed.
Repeat this agent installation on each Skype for Business Server machine.
Once agents are installed, browse to the /heathcheck page to verify, and then once data is being returned, browse to the main website page to view and browse the stats. See Figure 13.25 for a view of the KHI summary.
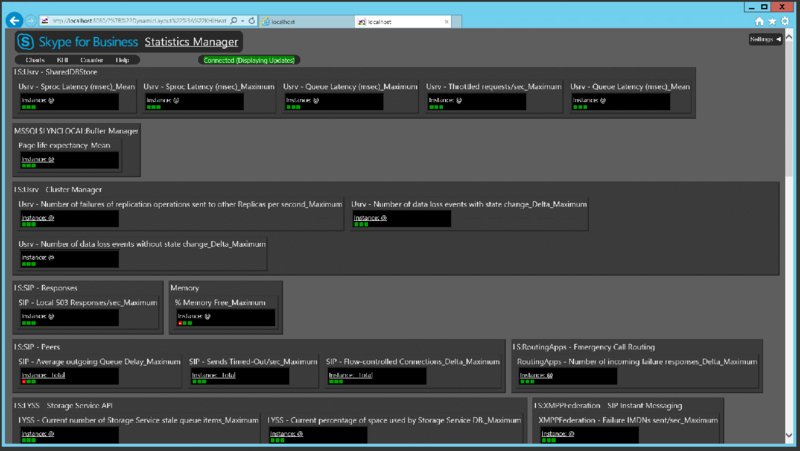
FIGURE 13.25 Viewing the KHI summary website (with data)
The Bottom Line
Understand the architecture for the Archiving and Monitoring roles. Although related to different aspects of the data, the Archiving and Monitoring services are similar in function, and they have similar back-end requirements. This allows them to be easily colocated and share the same database server or instance.
Master It What are the options available for enabling Archiving?
Provide reporting on the data available from the Archiving and Monitoring roles. Skype for Business Server 2015 provides a monitoring reports pack containing more than 50 reports, which focus on the QoE data. Non-Microsoft vendors provide additional report capability for the other databases, and of course, you can always write your own reports.
Master It What options are available for creating customized reports?
Use the capabilities in the System Center Operations Manager management pack to report on the availability of the Skype for Business Server service. With the implementation of the Skype for Business Server 2015 Monitoring Management Pack for System Center Operations Manager, administrators have a consolidated approach and location for collating and monitoring system (and service) uptime.
Master It Which synthetic transactions will confirm the status of the Address Book service?