Chapter 15
Troubleshooting
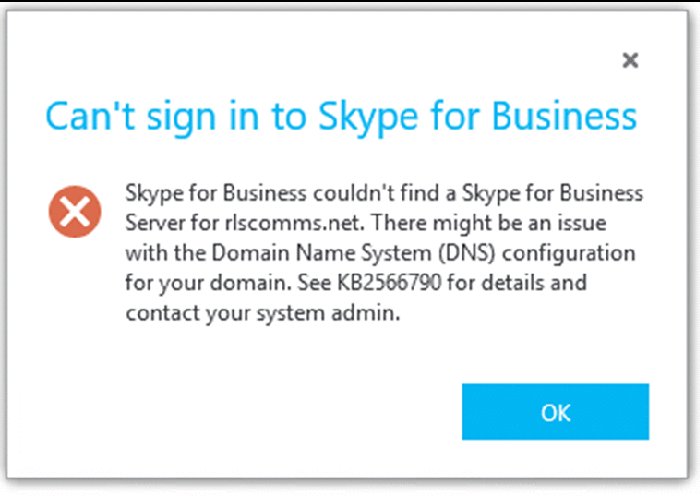
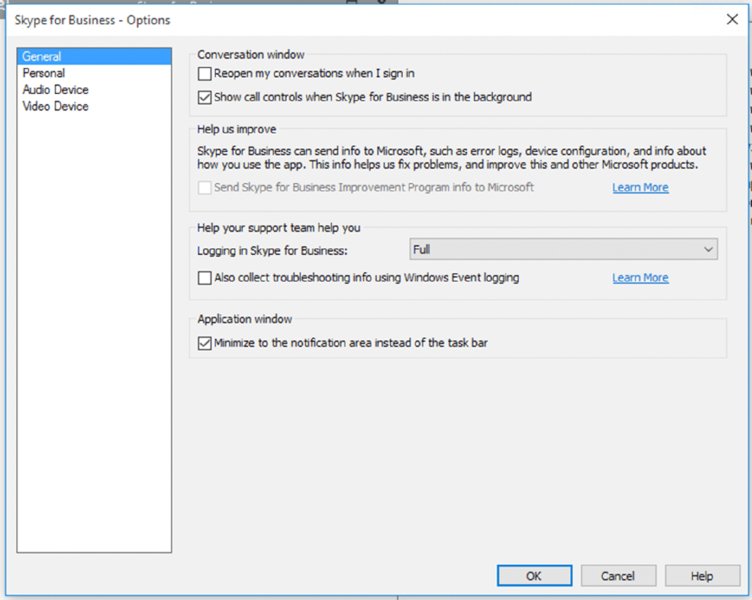
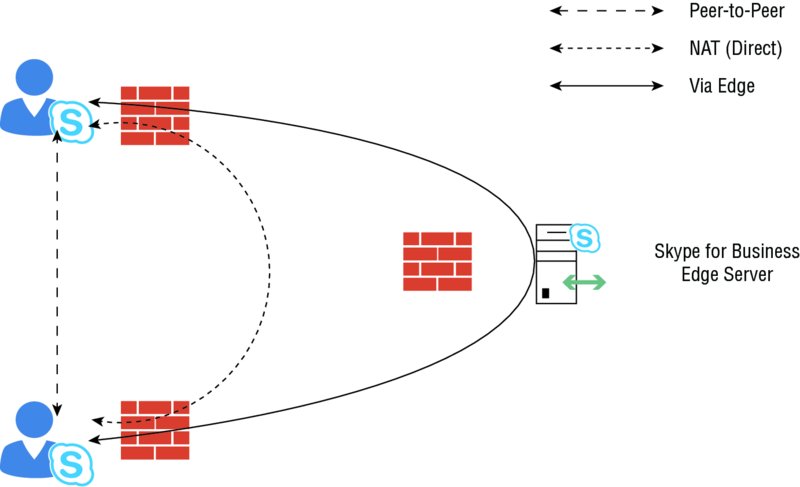
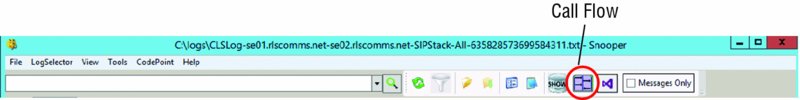
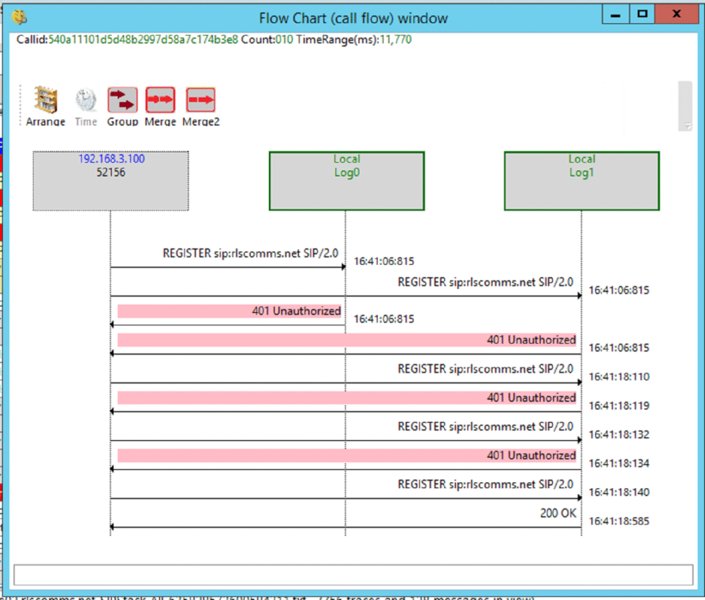
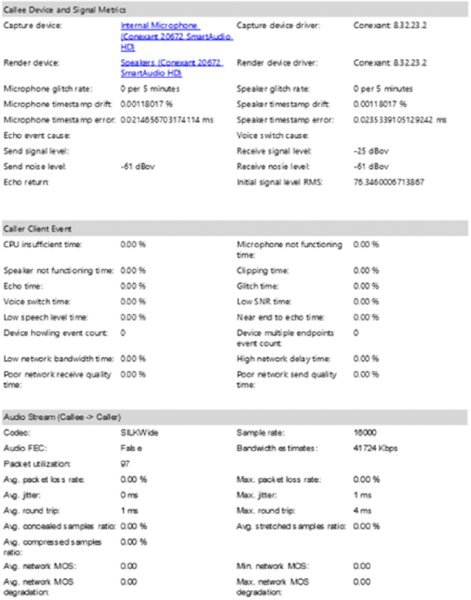
In an ideal world, every system would work perfectly as soon as it was installed and would continue to work until decommissioned. As we all know, this is never the case, and quite often the simple things (typically, the ones assumed to be correct) are what cause us problems. In this chapter, you will explore the tools available to troubleshoot Skype for Business. There are some differences between Skype for Business Server 2015 and its predecessor Lync Server, but you still need to make sure the simple things are correct before you can progress to the complex areas. With the many integration points that Skype for Business provides with third-party hardware (gateways, devices, and so on), as well as its strong integration points with the underlying infrastructure, there are many areas to check when it comes to troubleshooting. In this chapter, you will learn to Let’s say you receive a call from a user saying something is broken (can’t log in, can’t make calls, or the like). Where do you start? First, always ask the usual questions. When working in the support department, you’ll find that no one ever admits to making a change that breaks something; however, as administrators, we all know it happens! When you’re troubleshooting, always check to see whether an administrative change could’ve caused the break. Second, you need to establish the scope of the problem. Is it related to a single user, is it related to a single location, or is the whole system down for everybody? The larger-scale impact issues tend to be easiest to troubleshoot, but they also tend to be the ones with the greatest amount of pressure. When 10,000 users are without phone service, the problem can quickly be escalated to the top. When it comes to networking investigation, the usual suspects typically include the following tools: Simply put, if a user can’t log in, something is wrong with their connection to the server (assuming the account is enabled and not locked or there is a simple typo). Using automatic login on an internal network, the Skype for Business client will attempt to discover the address of a pool (and therefore registrar) in the following order: The Phone Edition client will use the following methods: The Phone Edition device prefers to use Option 120 (in conjunction with Option 43 for certificate services) to allow the phone to be directed to a Skype for Business (or Lync) server rather than a legacy OCS 2007 or OCS 2007 R2 server, which does not provide certificate (or PIN) authentication. Using the Skype for Business client, you can modify the connection type to be manual (see Figure 15.1) and enter the FQDN address of the pool to see whether that connection is working. Using this test, you can confirm that the issue is within the DNS resolution of the automatic server discovery or the redirect from another pool. Figure 15.1 Configuring a manual server connection To confirm the connectivity to a server, you can use ping; however, many network administrators will block ping on the firewall, especially when you’re trying to communicate with the servers in the DMZ. To confirm communications on a specific port, you must use Telnet and provide the server (or pool) name and the port. For example, to confirm SIP connectivity via a hardware load balancer, use this command: The result, rather confusingly, is a blank window. However, this shows that the Telnet client has successfully connected to the server. If there is a problem, the client will indicate that it cannot connect, and although the error may not be particularly descriptive, you should be able to determine whether it was a DNS issue (if you used the FQDN) or a network connectivity issue (routing or firewall). The potential DNS issue can be determined simply by repeating the test using the IP address in place of the FQDN. Another useful tool to test this, and that can give a more meaningful output, is PortQry. This tool is available from www.microsoft.com/en-us/download/details.aspx?id=17148 and is currently in version 2. In Figure 15.2, you will see an example usage and output. PortQry also has the ability to work using UDP, whereas Telnet is limited to TCP only. Figure 15.2 PortQry output If the client is not able to find the automatic DNS records, you’ll get the error pop-up shown in Figure 15.3. Figure 15.3 DNS error Using the client logs (enabled as shown in Figure 15.4), you can see the following entries, which list the failed DNS resolution for some of the automatic lookup addresses: Figure 15.4 Enabling client logs and the following entries: The client logs provide extremely detailed information in terms of what is going on at the client end. You’ll see a lot more of them in this chapter. Once you have the name resolution, routing, and firewall problems out of the way, the next part of the connectivity path is the certificate on the server. With the improvements since the Lync Server 2010 Certificate Wizard (and even more so for the internal pool servers in Skype for Business Server 2015), the task of configuring the certificates became a lot easier; however, changes can still be made and the certificates still might not be updated, which could lead to connectivity issues. To test for the correct certificate configuration, you can use the following URL (similar to the successful Telnet connection, you can expect a blank screen, but this time white): Figure 15.5 shows the result when the certificate is correctly configured (dialog in background) and incorrectly configured (foremost dialog). Also notice the Skype icons on the address bar for the successful connection. Figure 15.5 Confirming the correct certificate You can repeat this process to confirm each of the expected subject alternative names (SANs) in the certificate simply by replacing the <poolname> entry with each of the SAN entries. Now that you’ve established the basics for client connectivity to the servers, the next step is to confirm connectivity between clients when establishing a call. IM connectivity always flows through the server, whereas the clients must negotiate peer-to-peer connectivity between themselves. Where direct connectivity is not available, clients must connect via NAT or the Edge server. Figure 15.6 shows the connectivity options for a client, depending on the path available between them. Figure 15.6 Client connectivity options The client logs capture the IP addresses and ports negotiated (known as candidates) during the call initiation (audio, video, or desktop sharing). This Internet connectivity exchange (ICE) is shown here: Each line beginning with Let’s look at a sample candidate entry: Broken down, it consists of the following elements: The information shown is actually a legacy version of ICE, and you’ll find it only in the Skype for Business 2015 client (the Lync 2013 client with the update); it’s there to provide legacy compatibility with OCS clients. With the Skype for Business 2015 client you will also get the newest version of ICE, and in the Skype for Business 2016 client only this new version is provided (therefore there is no OCS compatibility available). This new version is shown next: Broken down, a sample entry in the latest format looks like this: It breaks down as follows: The clients both exchange a candidate (and codec) list and will try each address in order of preference. The logs will also show the address list provided by the remote client. Once you have this information, you can ensure manually that the clients can connect. Once compatibility is confirmed via the IP address, port, and protocol selection, the remaining task is to establish a common codec. The previous listings include this codec map ( Phone devices don’t have the same requirements for connectivity as desktop clients, specifically the need for DHCP configuration. To enable certificate-based authentication (making sure the phone can connect with no Active Directory available), you must make sure the phone connects to the certificate-provisioning website on a Skype for Business pool. This is provided via DHCP Option 43. In addition, unless DHCP Option 120 is also configured (you need to provide the SIP registrar information), the phone will display an error to the user while it is performing a DNS query on the SRV records (although once the DNS records are discovered, it will connect as normal). The After you’ve verified that name resolution, routing, and the firewalls are working and all appears to be fine, the next step is to better understand the actual traffic being sent and received on the network. The following tools are often used for network sniffing: These tools intercept and provide a breakdown of the network traffic, including the protocol and meaning of the packets being transmitted or received. Figure 15.7 shows Microsoft Message Analyzer examining generic network traffic, grouped by process name. Figure 15.7 Microsoft Message Analyzer in action Immediately, from the open section in Figure 15.6, you can see the process ( Although Message Analyzer provides protocol parsers for SIP, it is normally much easier to enable logging on the server or client and import the log file into Certificate traffic analysis will indicate the names being provided by the certificate, ensuring that you can match those names with the ones you expect. It is really important in certificate analysis that you capture the initial handshake for the SSL session you are trying to decrypt. If you don’t, all the useful data will be listed as application data in the network trace. By contrast, with the hardware load balancers, a common misconfiguration is the timeout values; here, you can capture a Keep in mind these tips from the field when you’re using network monitoring tools. Use aliases for naming the IP addresses so you can better track the flow. Use colors to highlight interesting trace information so when it is streaming in real time, you can better track what information you are looking for. Now that we’ve covered the methods of troubleshooting connectivity and introduced the snippets of the log files, we’ll cover tracing. Both the server and the client provide a method to access what is happening “under the covers” by enabling logging. Logging enables the server and client to write detailed information to a text file to provide a means for an administrator or support engineer to understand what is occurring at any given time. The server provides a means to enable subsets of components to log; on a busy server, there is too much information to simply log it all and then parse it. Next, you’ll see how to enable and manage individual server components. The client doesn’t have as much information to log because it is dealing with only a single user’s interactions, and therefore, everything is either Light, Full, or disabled. Figure 15.4, earlier in the chapter, shows where you enable logging on the client; it can also be enabled via policy. The log files are stored at the location and are named These log files use circular logging, so there will always be a minimum of two files (occasionally there may be more—normally this would occur only when sustained traffic is being logged and not enough time has passed to close down the first file). Once the second is full, the first will be overwritten, and once the first is full, the second will be overwritten, and so on. As mentioned, these are text-based log files and can be opened and viewed with any text viewer (such as Under this directory you will also notice an Event Trace Log (ETL) file. This is a binary file that cannot be read by Refer to the following location for more information: Lync Server 2013 introduced a new concept called centralized logging. It is designed to allow you to trace across multiple servers at one time, making it far easier to locate and troubleshoot a problem to resolve it. Previously, you had to run a trace individually and manually on every node you thought was involved in the communications flow as well as select the right components and flags to trace on. In Skype for Business, each server runs a new service called Skype for Business Server Centralized Logging Service Agent, as shown in Figure 15.8. Figure 15.8 Skype for Business Server Centralized Logging Service Agent You can also monitor the Skype for Business Server Centralized Logging Service Agent via Task Manager under There are global policies configured by default that control the behavior of this agent. These policies can be modified via the PowerShell cmdlet Figure 15.9 The In Figure 15.9, you will see a list of scenarios that are configured, but more important, you’ll see what is enabled. A scenario called AlwaysOn is enabled by default. This in itself is a major leap forward in terms of troubleshooting because now there is the potential to capture the problem with this scenario. Although it does not monitor every component or flag, this scenario should allow you to reduce the time to resolution because you may not have to try to re-create an issue, which can sometimes be a challenge. The central logging service can be controlled by the following range of cmdlets: Here a brief description of each of the cmdlets: Figure 15.10 shows the typical results from running one of these cmdlets. Figure 15.10 Output from the Although the PowerShell cmdlets allow for detailed granular control, they can be cumbersome to remember the parameters needed and scenarios to cover. As part of the Skype for Business Server 2015 Debugging Tools download, you can install the GUI for the Centralized Logging Service. You can find the download here: https://www.microsoft.com/en-us/download/details.aspx?id=47263 Once it’s installed on the server, you can run the Figure 15.11 Clearly, it is much easier to navigate because all the details are provided and you can simply click to get started. You can define new scenarios and search logs from the other tabs shown. So, once you’ve got logs, what next? Well, you need to analyze them, and while this is possible via In a previous section, you viewed the log file snippets as text. The log file is a text-based file, but it can quickly grow quite large. Snooper is the tool that makes interpreting the logs extremely easy. Figure 15.12 shows Snooper with a file loaded. Figure 15.12 The Snooper Trace tab Immediately upon loading a file, Snooper will display the Trace tab (as shown in Figure 15.12) and provide an additional Messages tab (shown in Figure 15.13). If the file is too large (more than 25MB), a prompt will appear asking if you want to load traces, messages, or both. Figure 15.13 The Snooper Messages tab A feature in Snooper provides the ability to switch between multiple logs with relative ease. Selecting LogSelector from the top menu (see Figure 15.13) will provide you with easy access to the logs you have opened, shown in Figure 15.14. Figure 15.14 The Log Selector window As you can imagine, this can be useful when switching between multiple client logs or even multiple server logs. As you will see, errors will be highlighted in red, allowing a quick and easy identification process. You may not always be interested in the errors on the Trace tab because they typically show the result of the problem rather than the cause. On the client, the component view shows Unified Communications Client Platform (UCCP) API; however, server logs provide many different components (288 to be precise). Many of these traces are typically of more use to Microsoft Product Support Services (PSS) than to the administrator. The Messages tab is more useful to the administrator. Here, you can see the SIP flow of the client. Selecting a single message not only displays the associated content on the right but also highlights all associated messages. For example, selecting a SIP However, where Snooper really comes into its own is the search capabilities, quickly allowing you to find the relevant parts of the log file that you are interested in. You can manually add entries into the search bar if you know the criteria to search for (simply type into the search bar)—typically, this starts with an error message or a username (or number) related to the problem. The simple Search menu (shown in Figure 15.15) allows you to quickly build a search string from the text within the message to narrow down the content in the log file. This becomes more relevant when you are dealing with server-generated log files rather than log files from the client. Figure 15.15 Searching with Snooper Selecting a text string and then choosing Search will simply replace the current search criteria with the selection. Obviously, being able to understand the expected process (that is, a SIP call flow) makes the troubleshooting easier because you know roughly what to expect and can interpret deviations from this expected flow to troubleshoot. In the latest version of Snooper, there is an option on the menu bar that can provide the call flow sequence (shown in Figure 15.16). This gives you the ability to understand the call flow even if you are a complete novice. Figure 15.16 Location of the Call Flow button When you click the Call Flow button, the call flow diagram window will appear. As you can see in Figure 15.17, you now receive a graphical representation of the call flow for the particular conversation you have selected. Figure 15.17 The call flow diagram window Pay close attention to the detail it can provide. For example, you will see the host IPs that are involved in the communication. You can also easily see the direction of the response. Figure 15.17 shows the initial signing process. Chapter 2, “Standards and Protocols,” provides an overview of the SIP call flow process. One more feature is worth mentioning in the context of tracing. Besides providing Snooper to help you narrow down a problem, this is something that was introduced as a significant step in Lync Server 2010 and continues with the latest error messages in Skype for Business 2015, by including descriptive diagnostic text with all the messages. Some of these messages are shown here: So far, we’ve covered only the server- and client-side logging of the Skype for Business application. In the following sections, we’ll cover some of the other areas where troubleshooting may be required, outside the central logging tool and the client logs. We’ll also touch on the performance counters available to provide a view into how the hardware is actually performing as well as the synthetic transaction capability to provide automated testing of the Skype for Business environment. Ideally, this would be integrated with System Center Operations Manager 2012, providing the administrators with monitoring and alerting. We’ll also talk again about the CDR report, this time in more detail, and you’ll see which parts are of particular interest in troubleshooting. Finally, we’ll show how to capture the client configuration information, which will help confirm that the client is actually connecting to the correct servers. While most of the web components have specific scenarios within the central logging tool for debugging, they are still web based, so IIS logs will also need to be investigated. There are two websites to consider, each with its own set of log files. (One website is for internal client connectivity, and one is for external client connectivity. There are separate websites because the security configurations are different on each, and indeed some capability—such as administration—is available only internally.) These log files will capture every web-based interaction; in a large deployment, they can grow in size quickly because every single client will make multiple web queries upon login (for Address Book updates, client updates, and so on). Remember to turn IIS logging off after you have completed troubleshooting. These log files can grow extremely quickly and cause other issues from the space they consume. The Control Panel is a Silverlight application, so any issues involving connectivity and loading this page are going to fall under IIS also. Often we have found that companies using a web proxy forget to configure it to exclude the pool’s administration pages/websites. In the event of problems with devices (assuming the device has connected), there is a Send Logs option within the device menu, which will force the device to upload its log file to the web server to the following location: Use the PowerShell cmdlet These logs are in Windows CE log file format and require the use of the https://www.microsoft.com/windowsembedded/en-us/developers.aspx Windows servers come with a tool called Figure 15.18 The following counters are typically used to indicate generic server problems: As shown in Figure 15.16, you can view multiple counters at the same time, allowing for correlation of conditions. For example, if both network and disk activity increased simultaneously, it could indicate that a file is being copied across the network to (or from) the server. Most applications will install application-specific counters; Skype for Business Server 2015 is no different and installs several thousand! (Specific counters will vary based on which actual roles are installed on a server.) Listed here are some of the more common counter categories and specific objects within those categories: These were originally detailed in a blog entry regarding server health determination for OCS, at the following location: The counters and points in the blog are still relevant to Lync. Each of the counter categories (for example, LS:SIP – Peers or LS:SIP – Responses) has a number of specific counters (for example, Flow Controlled Connections) associated with it. In most cases, they will provide rates of message flow—for example, success per second—and can be used to determine the rate of successful connections, or more likely in the case of troubleshooting, the rates (and count) of failures can be interesting. SQL Server also installs counters, and because SQL Express is installed on every server role, these allow further in-depth visibility of the databases. (SQL-specific counters are beyond the scope of this book.) Microsoft has identified a number of performance counters that it classes as Key Health Indicators. They are specific counters that, if the thresholds are crossed, will lead to a significant degradation of service. You can download this list in spreadsheet format, detailing thresholds for each counter, from here: https://www.microsoft.com/en-us/download/details.aspx?id=46895 Introduced in Chapter 13, “Archiving and Monitoring,” the set of PowerShell cmdlets known as synthetic transactions are most useful when integrated with Microsoft System Center Operations Manager; however, they can be used effectively when troubleshooting because they simulate the activities carried out by the client. You can find the full list of cmdlets in Chapter 13. You’ll need only a few of them for troubleshooting in this chapter. Some of the cmdlets really are for one-time testing—for example, to test permissions prior to installation. The ones you are interested in, though, require a user ID as the parameter; this ensures that when a user reports a problem, an administrator can emulate all the correct policies that the user will be receiving so the test is an accurate reflection of the settings applied to the user. Before you can use the Once the health configurations are configured for the pool, you can use the synthetic transactions to help troubleshoot. For example, the command will return the following if there are no problems: Some of the will return the following: This is followed by lots of XML, which has been left out for brevity, and finally this: On the other hand, if the web server itself is not running, the same command will return the following: This response still provides the XML data; however, you can see that the error code gives a good indication of where the issue is located. Restarting the web service and allowing the Address Book to be generated (or using As mentioned in Chapter 13, the Call Detail Report provides an extremely detailed analysis of an individual call with almost 200 individual data points captured in an audio call alone! Some of these data points help to set the scene (network address information and client hardware and software versions, for example). However, the ones of particular interest in identifying a root cause of a problem are in the Media Line (Main Audio)—Device and Signal Metrics, Client Events, and Audio Stream sections. Each of these sections reports in a single direction for the call (such as caller to callee); however, the CDR report includes both directions, so you can compare what is sent and what is received. Figure 15.19 shows the three sections from the caller section of the report (intervening sections have been removed for brevity); each report will include the callee data as well. Figure 15.19 Using the CDR report The Device and Signal Metrics section of the report provides the hardware and software versions of the device in use, but more important from a troubleshooting perspective, it provides the Send and Receive sound levels. By comparing the caller Send values with the callee Receive values (and vice versa), you can determine how much (if any) signal loss there has been because of the transmission. Also included here is the amount of echo received by the microphone and the amount actually sent in the signal; this is a representation of how well (or badly) the echo cancellation in the device is working. This section deals with the hardware associated with the device (including the PC if you are using built-in or USB-connected headphone and speakers). Pay particular attention to the time values because they indicate how long the device has been malfunctioning; any value in the fields in this section indicates a problem with the call. Other sections of the report provide informational data, whereas any data in this section indicates a problem. You may need to refer to other sections to determine exactly what the problem is. The Audio Stream section covers the network impact to the call and provides information on the specific codec used for the call. This section will help to determine whether the network is causing any of the problems because this is where you can see information related to the packet loss, jitter, and round-trip time. Also included here is information on how much healing was carried out on the call. Finally, the MOS values show how much impact the network conditions have had on the call quality. You can determine the connected client configuration by holding down the left Ctrl key and right-clicking the Skype for Business icon in the system tray to bring up a menu from which you select the Configuration Information item. This will call up the screen shown in Figure 15.20. Figure 15.20 Configuration information The client will cache a significant set of information, ranging from configuration items and search query results to photos and voice mails. To ensure that the latest configuration information is being provided to the client and remove the possibility of stale cached information, you should delete the cache files in the following folder location: Confirm that the basics are in place from the infrastructure side. Skype for Business Server 2015 relies on a range of additional infrastructure to be able to provide its functionality—such as Active Directory, SQL, DNS, network, and so on. If any of these additional areas suffer interruptions or misconfigurations, it is extremely likely that Skype for Business will begin to demonstrate issues also. Master It An internal Skype for Business client is having difficulty connecting to its home pool when using automatic configuration. Describe the flow of DNS and connection attempts made for a client on the corporate network. Understand how to troubleshoot the client. The Skype for Business client provides a lot of information in the configuration section as well as the log files to aid with troubleshooting, and this information should not be overlooked. Master It Where are the client log files stored? Know how to enable troubleshooting on the server. The Skype for Business Server roles have individual components that require logging and also provide performance counter objects that can be monitored. By default, the logging scenario AlwaysOn is enabled on the servers. The default logging options and components can be configured to suit users’ needs. Master It How do you enable logging on Skype for Business Server? Understand and use the troubleshooting tools available. In addition to the built-in logging functionality of Skype for Business Server 2015, more tools can (and should) be downloaded and installed on each of the servers to provide a better range of data, which is ready to be captured in the event of a problem. Master It Which tool is recommended for analyzing SIP logs or message traces? And where can it be found?
Covering the Basics
NOTE
Nslookup.exe (don’t forget to configure to check for SRV records)Confirming a Network Connection
Lyncdiscoverinternal.<sip domain>Lyncdiscover.<sip domain>_sipinternaltls._tcp.<sip domain>sipinternal.<sip domain>sip.<sip domain>
_sipinternaltls._tcp.<sip domain>sipinternal.<sip domain>sip.<sip domain>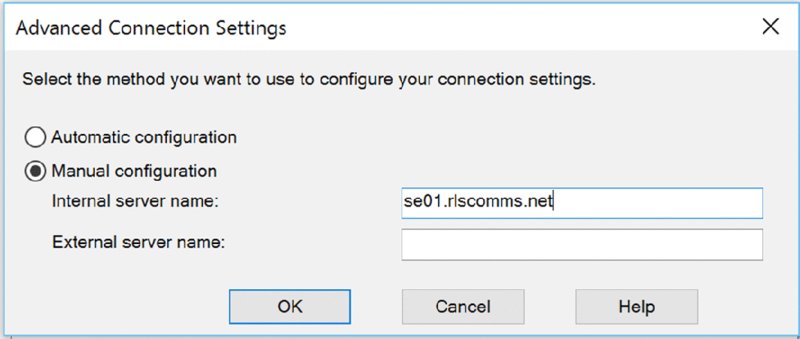
telnet <pool name> 5061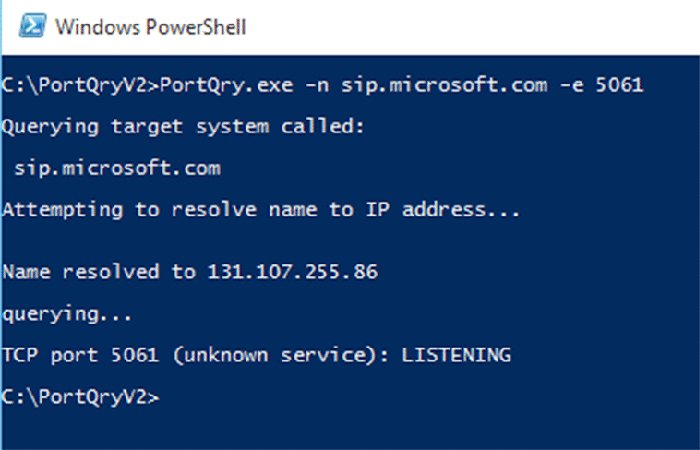
11/11/2015|10:34:37.182 1088:3F8 ERROR :: ResolveHostNameUsingGetAddrInfo  - getaddrinfo(sip.rlscomms.net) failed hr=0x80072AF9
11/11/2015|10:34:37.182 1088:3F8 WARN  :: ResolveHostName - getaddrinfo  failed for sip.rlscomms.net hr=0x80072AF9
11/11/2015|10:34:37.182 1088:3F8 ERROR :: ResolveHostNameUsingDnsQuery - DnsQuery(sip.rlscomms.net) failed error=9003
11/11/2015|10:34:37.182 1088:3F8 WARN  :: ResolveHostName - DNS lookup  failed for sip.rlscomms.net hr=0x80004005
11/11/2015|10:34:37.182 1088:3F8 ERROR :: ResolveHostName - Name resolution for sip.rlscomms.net failed<Lync-autodiscovery>
<Info><![CDATA[GetBestManagedCredentialByType
return the cred: 00000000, type:specific, userId:LAD
</Info>
<Info><![CDATA[Discovery request sent to URL
http://lyncdiscoverinternal.rlscomms.net?sipuri=
[email protected], txn (13C48918), task(13BF94F0)
</Info>
<Info><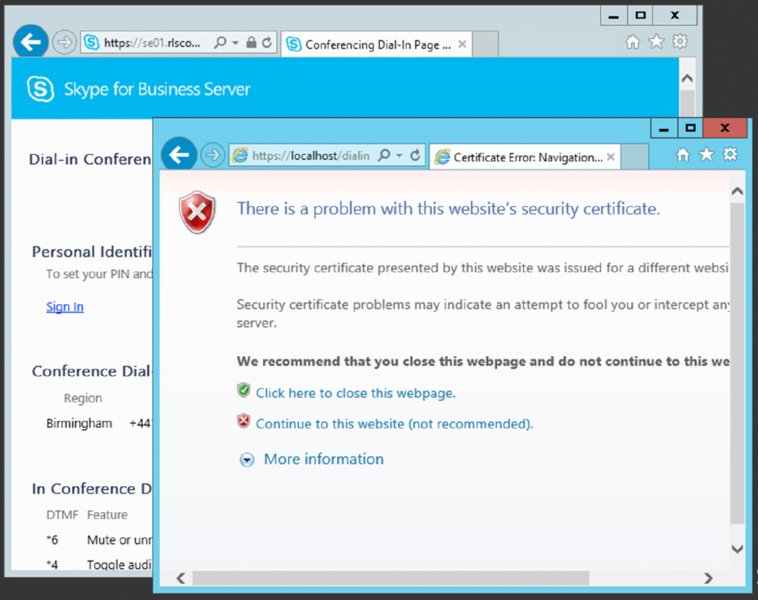
Checking for Audio/Video Peer-to-Peer Connectivity
v=0
o=- 0 0 IN IP4 192.168.3.98
s=session
c=IN IP4 192.168.3.98
b=CT:53980
t=0 0
m=audio 56498 RTP/AVP 114 9 112 111 0 8 116 115 4 97 13 118 101
a=candidate:I0j2VRG1VNQG4cWj248JT8iqlOD42gmKoa8xdt4quqo 1 w4WZzoBiHwS3VeihjFFTuw
UDP 0.830 192.168.1.177 71 50028
a=candidate:I0j2VRG1VNQG4cWj248JT8iqlOD42gmKoa8xdt4quqo 2 w4WZzoBiHwS3VeihjFFTuw
UDP 0.830 192.168.1.177 50029
a=candidate:PZWZ6iscBZZ9TjL4kOKnxvcZDP4wODZKIklqiA/YLek 1 fCq9RqLw2pcibQlONAJULQ
TCP 0.190 192.168.1.177 53882
a=candidate:PZWZ6iscBZZ9TjL4kOKnxvcZDP4wODZKIklqiA/YLek 2 fCq9RqLw2pcibQlONAJULQ
TCP 0.190 192.168.1.177 53882
a=candidate:3aT5M3vcWbnE4FzWub2fX5CjNq6oDM61ZlcRKb0u5rQ 1 N9yLzNb17mpUVbCqNC2lAQ
UDP 0.490 192.168.3.98 56498
a=candidate:3aT5M3vcWbnE4FzWub2fX5CjNq6oDM61ZlcRKb0u5rQ 2 N9yLzNb17mpUVbCqNC2lAQ
UDP 0.490 192.168.3.98 55800
a=candidate:H46GRbUExoCxH7kQHprA5E2uVHxBroGV6aTGb56IowU 1 X1veRGhvsDShUEB8ND7GGQ
TCP 0.250 192.168.254.4 50004
a=candidate:H46GRbUExoCxH7kQHprA5E2uVHxBroGV6aTGb56IowU 2 X1veRGhvsDShUEB8ND7GGQ
TCP 0.250 192.168.254.4 50004
a=cryptoscale:1 client AES_CM_128_HMAC_SHA1_80
inline:kDgLmPIv2ufDNctJasF0KIkFq5w/6iXpUDMeWrDW|2^31|1:1
a=crypto:2 AES_CM_128_HMAC_SHA1_80
inline:s40wuCQ33Rw6SysXZs5f7C66IxsF/GdQRqiqcD3M|2^31|1:1
a=crypto:3 AES_CM_128_HMAC_SHA1_80
inline:SljnK0kFx6RtiWHywiCIVavo1SxLE/ztysYrFhZb|2^31
a=maxptime:200
a=rtcp:55800
a=rtpmap:114 x-msrta/16000
a=fmtp:114 bitrate=29000
a=rtpmap:9 G722/8000
a=rtpmap:112 G7221/16000
a=fmtp:112 bitrate=24000
a=rtpmap:111 SIREN/16000
a=fmtp:111 bitrate=16000
a=rtpmap:0 PCMU/8000
a=rtpmap:8 PCMA/8000
a=rtpmap:116 AAL2-G726-32/8000
a=rtpmap:115 x-msrta/8000
a=fmtp:115 bitrate=11800
a=rtpmap:4 G723/8000
a=rtpmap:97 RED/8000
a=rtpmap:13 CN/8000
a=rtpmap:118 CN/16000
a=rtpmap:101 telephone-event/8000
a=fmtp:101 0-16a=candidate is an IP address/port/protocol combination on which the client can be reached, and the long, seemingly random text is the username/password combination, ensuring that this connection is secured. (This text string is exchanged via the SIP signaling path, which is already secured.)a=candidate:I0j2VRG1VNQG4cWj248JT8iqlOD42gmKoa8xdt4quqo 1 w4WZzoBiHwS3VeihjFFTuw
UDP 0.830 192.168.1.177 50028
a=candidate: is the session attribute.I0j2VRG1VNQG4cWj248JT8iqlOD42gmKoa8xdt4quqo is the username.1 specifies that RTP is to be used (2 = RTCP).w4WZzoBiHwS3VeihjFFTuw is the password.UDP is the protocol.0.830 is the weighting (a higher number is preferred).192.168.1.177 is the IP address.50028 is the port number.v=0
o=- 0 1 IN IP4 192.168.3.98
s=session
c=IN IP4 192.168.3.98
b=CT:99980
t=0 0
a=x-devicecaps:audio:send,recv;video:send,recv
m=audio 28038 RTP/SAVP 114 9 112 111 0 8 116 115 97 13 118 101
a=x-ssrc-range:3287526401-3287526401
a=rtcp-fb:* x-message app send:dsh recv:dsh
a=rtcp-rsize
a=label:main-audio
a=x-source:main-audio
a=ice-ufrag:lkMR
a=ice-pwd:FNCRfT45UaOKa0iv0Vn6l4Mt
a=candidate:1 1 UDP 2130706431 192.168.3.98 28038 typ host
a=candidate:2 1 UDP 2130705919 192.168.1.177 31230 typ host
a=candidate:3 1 TCP-PASS 174455807 192.168.254.4 58074 typ relay raddr 192.168.3.98 rport 31737
a=candidate:4 1 UDP 184547839 192.168.254.4 53297 typ relay raddr 192.168.3.98 rport 11035
a=candidate:5 1 TCP-ACT 174847999 192.168.254.4 58074 typ relay raddr 192.168.3.98 rport 31737
a=candidate:6 1 TCP-ACT 1684796927 192.168.3.98 31737 typ srflx raddr 192.168.3.98 rport 31737
a=crypto:2 AES_CM_128_HMAC_SHA1_80 inline:wY44XYBqlFxW5w3qbPSLOGkBmdELxK1jx/7FlKZ3|2^31|1:1a=maxptime:200
a=rtpmap:114 x-msrta/16000
a=fmtp:114 bitrate=29000
a=rtpmap:9 G722/8000
a=rtpmap:112 G7221/16000
a=fmtp:112 bitrate=24000
a=rtpmap:111 SIREN/16000
a=fmtp:111 bitrate=16000
a=rtpmap:0 PCMU/8000
a=rtpmap:8 PCMA/8000
a=rtpmap:116 AAL2-G726-32/8000
a=rtpmap:115 x-msrta/8000
a=fmtp:115 bitrate=11800
a=rtpmap:97 RED/8000
a=rtpmap:13 CN/8000
a=rtpmap:118 CN/16000
a=rtpmap:101 telephone-event/8000
a=fmtp:101 0-16
a=rtcp-mux
a=ptime:20a=candidate:3 1 TCP-PASS 174455807 192.168.254.4 58074 typ relay raddr 192.168.3.98 rport 31737
a=candidate: is the session attribute.1 specifies that RTP is to be used (2 = RTCP).TCP-PASS is the protocol type (TCP-PASS = TCP Passive; TCP-ACT = TCP Active, UDP).174455807 is the weighting (a higher number is preferred).192.168.254.4 is the IP address.58074 is the port number.typ relay is the type of relay (direct = UDP only; relay = TCP-PASS, TCP-ACT, or UDP; srflx = self-reflective, TCP-ACT, or UDP).addr 192.168.3.98 is the remote IP address.rport 31737 is the remote port number.a=rtpmap:); the clients will negotiate this and will continue to negotiate throughout the duration of the call, ensuring that the codecs adapt to any change in the network conditions. Later in this chapter, you’ll see an excerpt from the media quality logs that shows the codec selection.Device Connectivity
dhcputil.exe tool (and DHCPConfigScript.bat file) provided in the C:Program FilesCommon FilesMicrosoft Skype for Business 2015 folder provides instructions for configuring a Microsoft-based DHCP server.Sniffing the Network
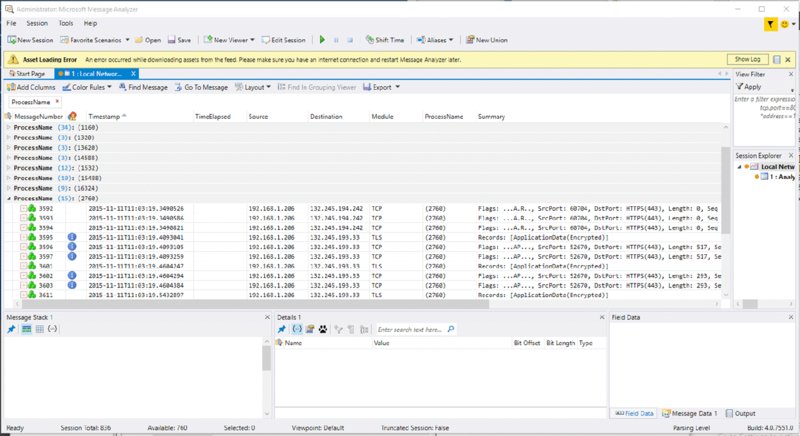
2760), and using something like Task Manager you can identify the ID used by the Skype for Business client (Lync.exe); so, you know you’re looking at the correct network traffic as well as the source and destination IP address information. This means you are connecting to the server (or device) that you should be. You can also see the specific protocol (in this case TCP) and ports in use.Snooper.exe for analysis. Where Message Analyzer comes into its own is in understanding the communications layer. There are two important scenarios.
TCP-RESET packet showing that the timeout is configured incorrectly. TCP-RESET will cause the active session to reset and a new one to establish, which can confuse the troubleshooting process. When searching for TCP-RESET sessions, focus and limit your search to the TCP port. Doing this makes it far easier to locate an actual conversation.Using Logging to Identify Problems
%USERPROFILE%appdatalocalmicrosoftoffice<office version>lyncTracingLync-uccapi-0.UCCAPILOG; the 0 in the filename will increase based on the number of log files available (such as Lync-uccapi-1.UCCAPILOG).notepad.exe); however, you’ll see later in this chapter how a resource kit tool called Snooper.exe makes reading and interpreting these log files much easier.notepad.exe. These files are generally used by Microsoft support engineers to help provide further information to diagnose issues. To examine these files, you can use OCSLogger.exe from a Lync Server 2010 deployment.Using Centralized Logging
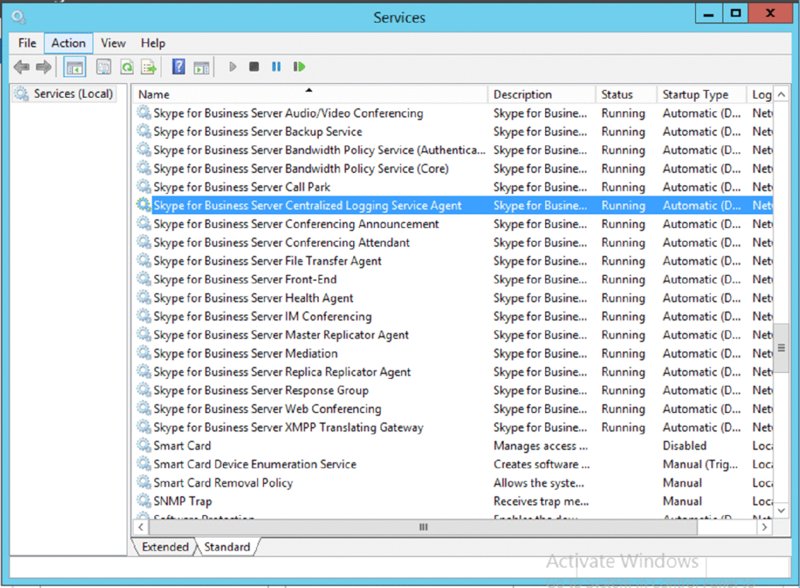
NOTE
ClsAgent.exe.Get-CsClsConfiguration (see Figure 15.9). Note that previously this command was Get-CsCentralizedLoggingConfiguration.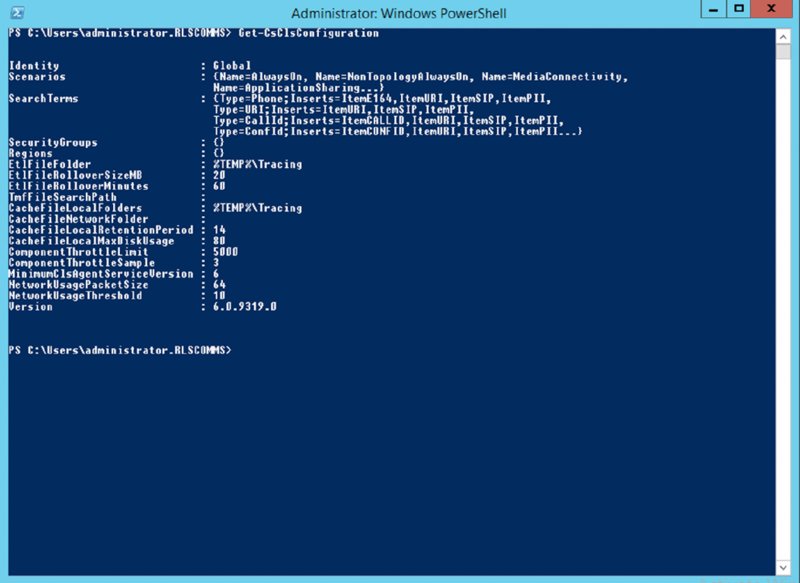
Get-CsClsConfiguration cmdlet
Show-CsClsLoggingStart-CsClsLoggingStop-CsClsLoggingSync-CsClsLoggingUpdate-CsClsLoggingShow-CsClsLogging This will query the status of every pool in the environment and report on the state of the Centralized Logging Service (Cls) Logging Agent.Start-CsClsLogging This will prompt for which scenario to apply and try to start the process on all servers in the environment by default, and it can be targeted to specific pools and also for a specific duration if needed.Stop-CsClsLogging This will prompt for which scenario to stop and try to start the process on all servers in the environment by default, and it can be targeted to specific pools if needed.Sync-CsClsLogging This cmdlet will flush the centralized logging cache on the pool specified or all by default.Update-CsClsLogging This cmdlet allows for modification of the duration of scenarios running on pools, as specified by the Start-CsClsLogging cmdlet.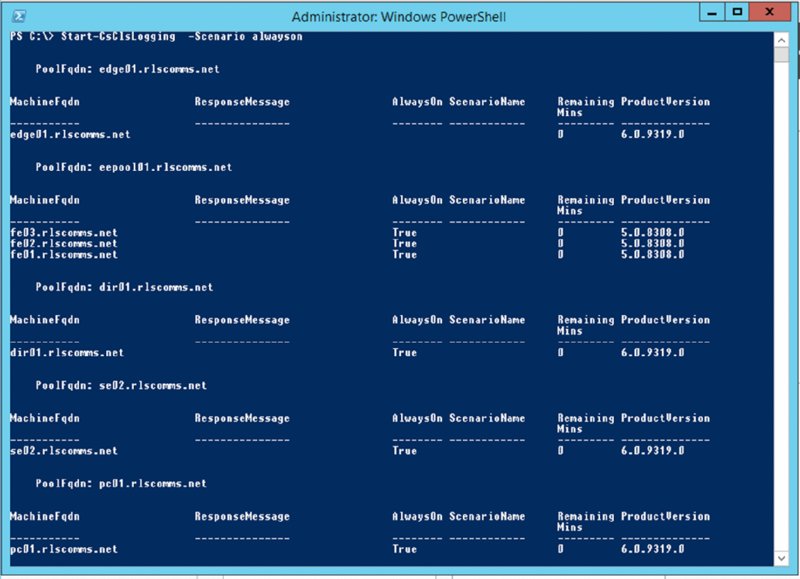
Start-CsClsLogging cmdletMaking Logging Easier
ClsLogger.Exe application to see a screen as in Figure 15.11.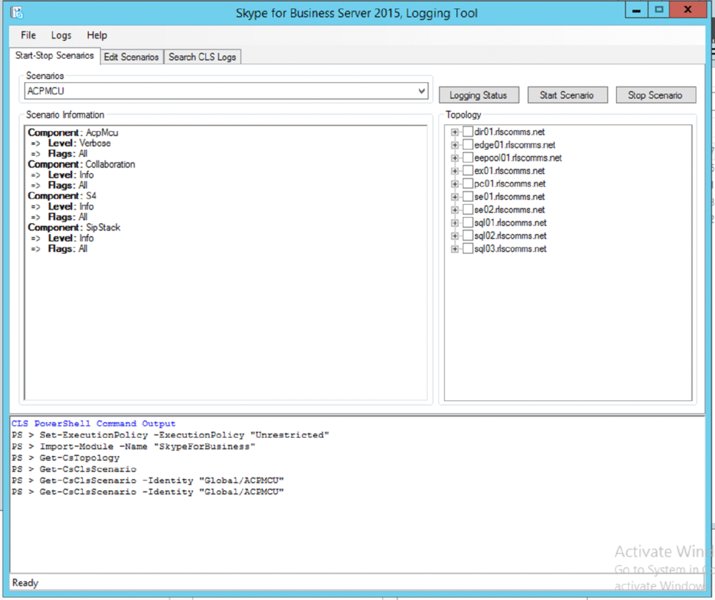
ClsLogger.exe startup screenNotepad.exe, it is much easier to use Snooper.exe, which is also installed as part of the Debugging Tools download.Using Snooper.exe
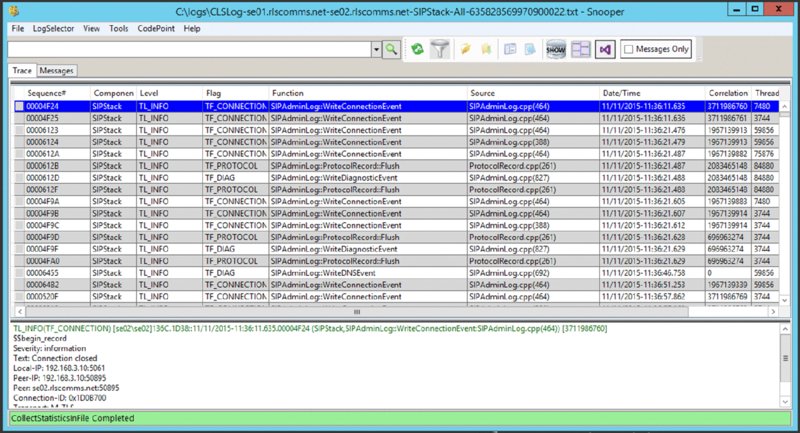
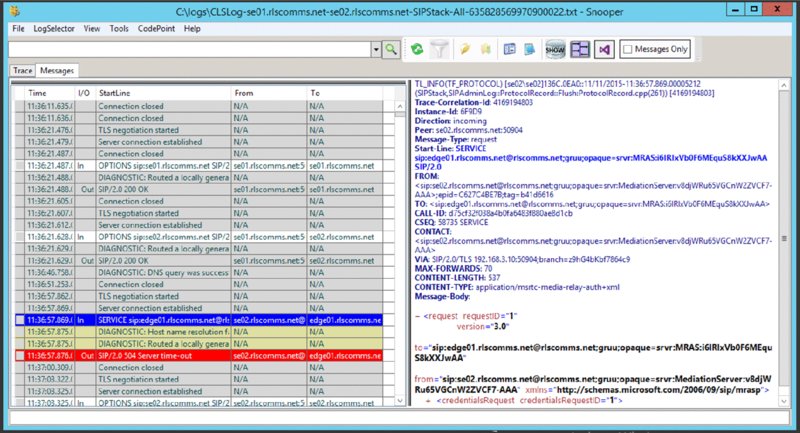
INVITE message will display the content directly associated with that particular message, but it will also highlight the relevant message thread, all the way through to the BYE message.
Diagnostic Message Text
13004; reason="Request was proxied to one or more registered endpoints"
13014; reason="The routing rules did not result in a final response and callee
 is not enabled for Unified Messaging"
51004; reason="Action initiated by user"
51007; reason="Callee media connectivity diagnosis info"
Advanced Troubleshooting Methods
Investigating Web Components
Control Panel
Device Troubleshooting
\servernameshare\%Pool WebServices Folder%DeviceUpdateLogsNOTE
Get-CsService to find the server name and file share you created in the topology.ReadLog.exe tool, which is part of Windows Embedded CE. You can download this tool from the following location:Performance Counters
PerfMon.exe, which can display a detailed view of counters within the server and any applications installed. Figure 15.18 shows PerfMon.exe in action.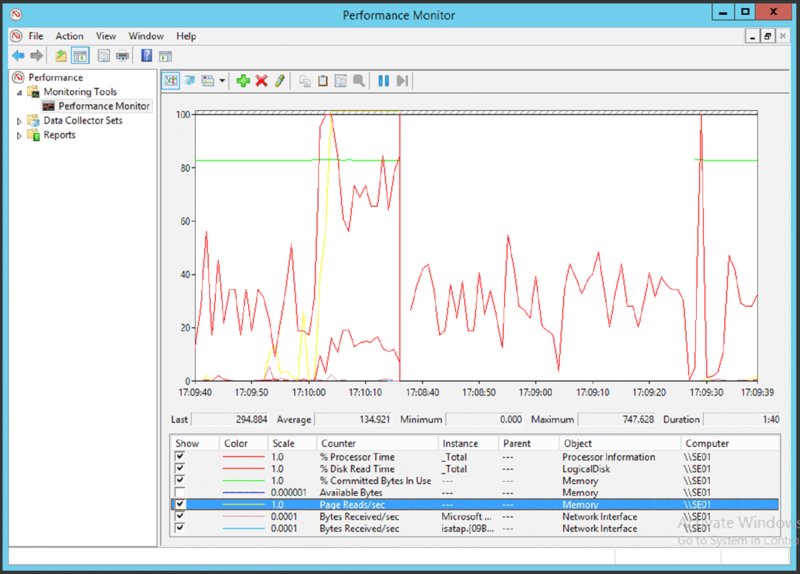
PerfMon.exe
Synthetic Transactions
Test-Cs cmdlets that are based on user ID, you need to configure a health configuration. This consists of two test user accounts, typically disabled but enabled for Skype for Business, that the Test-Cs cmdlets will use for their accounts to simulate traffic.New-CsHealthMonitoringConfiguration -TargetFqdn se01.rlscomms.net
-FirstTestUserSipUri sip:[email protected]
-SecondTestUserSipUri sip:[email protected]
Identity : se01.rlscomms.net
FirstTestUserSipUri : sip:[email protected]
FirstTestSamAccountName :
FirstTestUserSipUri : sip:[email protected]
FirstTestSamAccountName :
TargetFqdn : se01.rlscomms.netTest-CsIm -TargetFqdn se01.rlscomms.netTargetFqdn : se01.rlscomms.net
Result : Success
Latency : 00:00:20.0108302
Error :
Diagnosis :Test-Cs cmdlets require authentication and will produce a lot of screen data prior to the results. For example, before an Address Book is created (by default at 1:30 a.m. the morning after the pool has been installed), the commandTest-CsAddressBookWebQuery -TargetFqdn se01.rlscomms.netConnecting to web service : https://se01.rlscomms.net/webticket/webticketservce.svc
Using Machine certificate authentication
Successfully created connection proxy and website bindings
Requesting new web ticket
Sending Web-Ticket Request:Creating WebTicket security token request
TargetUri : https://se01.rlscomms.net/groupexpansion/service.svc
TargetFqdn : se01.rlscomms.net
Result : Failure
Latency : 00:00:00
Error : Address Book Web server request has failed with response code NoEntryFound.
Diagnosis :TargetUri : https://se01.rlscomms.net/groupexpansion/service.svc
TargetFqdn : se01.rlscomms.net
Result : Failure
Latency : 00:00:00
Error : ERROR - No response received for Web-Ticket service.
Diagnosis :Update-CsAddressBook) gives the following response to the Test-CsAddressBookWebQuery command:TargetUri : https://se01.rlscomms.net/groupexpansion/service.svc
TargetFqdn : se01.rlscomms.net
Result : Success
Latency : 00:00:20:5385645
Error :
Diagnosis :Monitoring Reports
Device and Signal Metrics
Caller Client Event
Audio Stream
Client Side
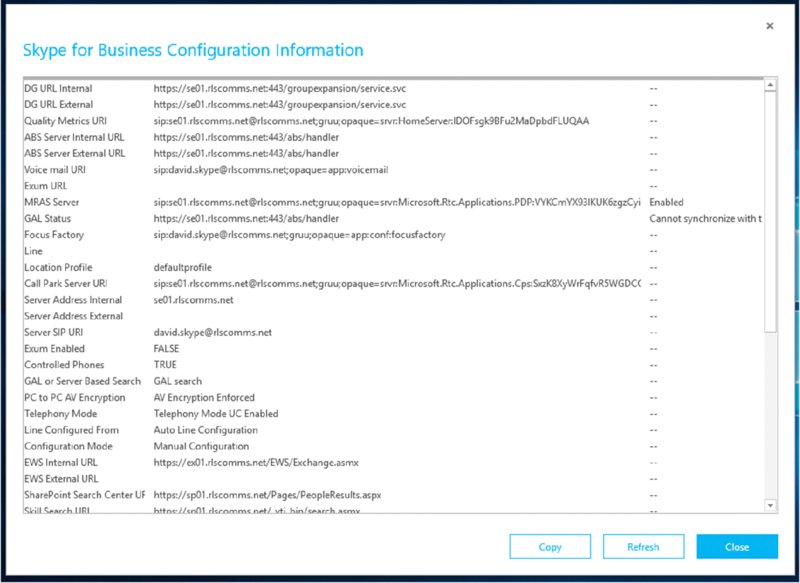
%USER PROFILE%AppDataLocalMicrosoftOffice<office version>Lyncsip_<sip address>The Bottom Line