
Understanding Performance Measurement Systems

Earlier, we mentioned that many companies use formal performance measurement systems. In this section, we shed additional light on such systems.
What is a formal performance measurement system?
A formal performance measurement (PM) system is a set of strategic objectives and performance metrics (including KPIs) applied throughout the entire enterprise. PM systems enable executives to see how business results generated in the company’s many different units combine to influence the enterprise’s overall results.
Thus, a PM system gives executives and managers a comprehensive, high-level view of their organization’s performance and an understanding of how the company’s different parts work together to produce business results.
In many companies that use a PM system, senior executives advocate adoption of the system and manage its implementation. But once the system has been established, all managers and employees in the organization contribute to and use it. But how? They define individual goals that support unit- and company-level goals, and they generate performance data that their supervisors then input into the system.
Why are performance measurement systems beneficial?
Performance measurement systems offer numerous benefits. Most important, they enable managers to define (and track performance on) metrics for every strategic objective set by their unit and company. By noting performance that falls short of targets (for example, “Our goal was to reduce order-processing errors 10 percent, but we only reduced them 5 percent”), managers can address the causes of the shortfall and work to continually improve performance.
They also show how performance in different parts of the company affects performance in other parts. For example, a company may discover that having the logistics staff achieve the objective, “Accelerate order-delivery time by 10 percent,” helps the customer service group meet its objective, “Increase customer satisfaction by 15 percent.” By seeing these interrelationships, companies can make more informed decisions. For instance, they can increase a budget, add new hires, or introduce a more efficient process to improve performance, instead of guessing which factors need to be addressed.
Types of performance measurement systems
There are many different types of performance measurement systems. Next, we examine several of the more commonly used types.
Dashboards or cockpits Possibly the simplest type of PM system, a dashboard or cockpit combines the company’s numerous metrics, targets, and performance data into one online or printed document (such as a spreadsheet) that’s prepared monthly, quarterly, or on some other schedule.
Figure 1 shows an example of a dashboard:
A dashboard
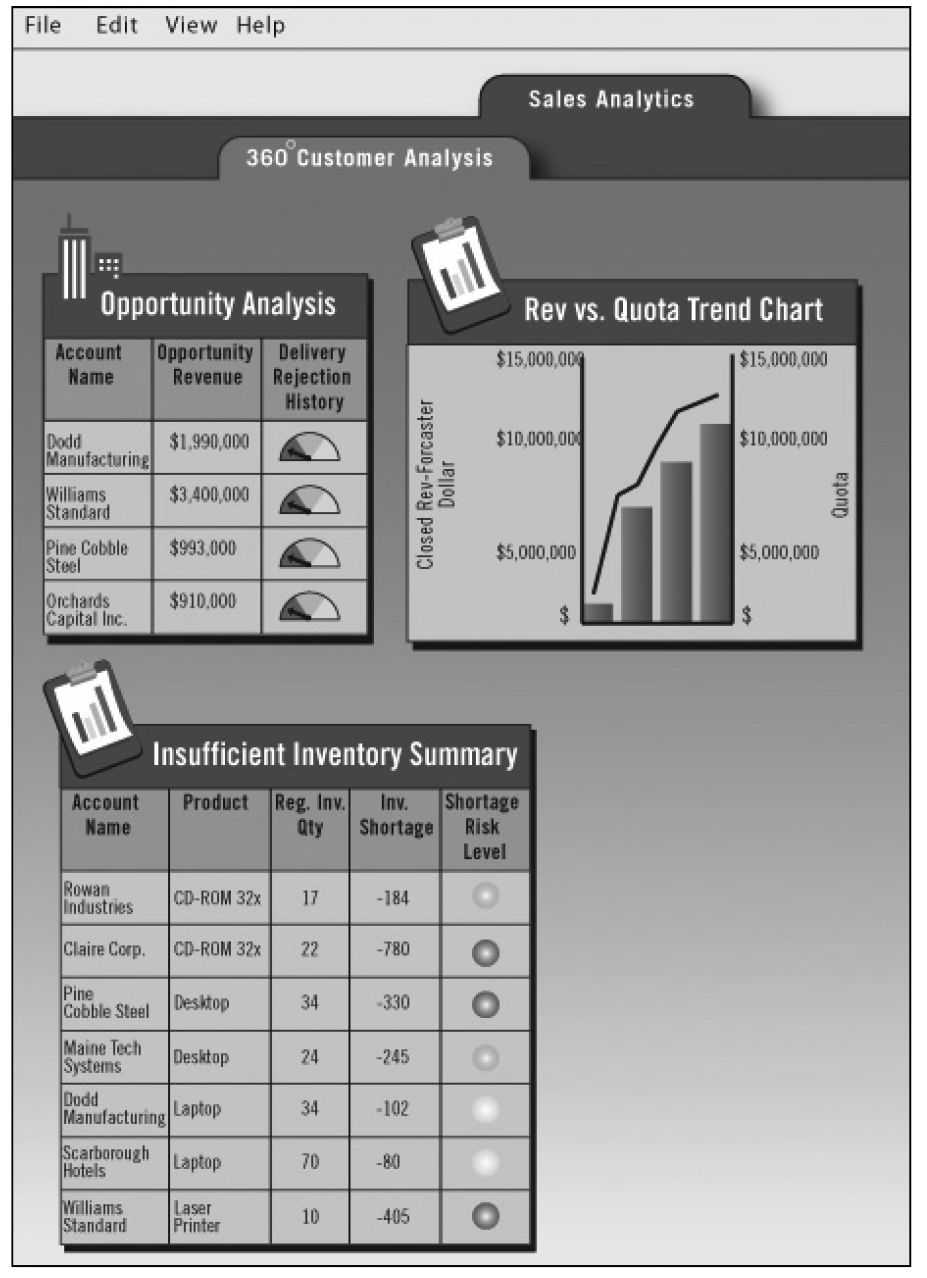
A dashboard enables executives and managers to easily digest the company’s aggregated performance data. In addition, many dashboards use a “traffic light” coding system to evaluate performance on each metric, enabling leaders to spot and address problems promptly. For example, red indicates performance that’s significantly below target; yellow, slightly below target; green, at or above target.
Although executives have traditionally used dashboards, many companies are now customizing their dashboards for managers at operational levels as well. For instance, at an airline, a manager in charge of stocking meals on board may see a different dashboard than the manager who oversees fuel purchasing. But each manager’s customized dashboard also shows which planes are flying where.
Quality-improvement systems Quality-improvement systems come in many different forms, including the following:
- Plan-Do-Check-Act. Popularized by total quality management (TQM) founder W. Edwards Deming, the Plan-Do-Check-Act framework helps managers establish a cycle of continuous improvement. The cycle comprises these steps: (1) Plan—Identify a performance problem and the processes affecting it; (2) Do—Explore potential solutions and implement one; (3) Check—Assess how well your solution worked; (4) Act—If your solution worked well, institutionalize it and look for another improvement opportunity. If it didn’t, return to step 1.
- Six Sigma. With roots tracing back to the 1920s, Six Sigma is a data- and measurement-driven approach that helps managers continually improve business processes through reduction of errors. Many companies that use Six Sigma apply it to all their business processes—manufacturing, product development, order fulfillment, customer service, and so forth.
- Baldrige National Quality Program. Established in 1987 by a congressional act, the Baldrige National Quality Program was developed by the United States’ National Institute of Standards and Technology. (The program is named after Malcolm Baldrige, who served as secretary of commerce from 1981 until 1987.) The Baldrige program defines criteria for high-quality business performance in numerous areas, such as leadership, strategic planning, customer focus, and knowledge management. The Baldrige framework has a European equivalent: the European Foundation for Quality Management. Every year, companies can apply for the Malcolm Baldrige Award, which recognizes organizations for achievement in specific categories: manufacturing, small business, education, and health care.
Balanced Scorecard Introduced in 1992 by Harvard Business School professor Robert Kaplan and David Norton, the head of a management consulting firm, the Balanced Scorecard (BSC) system recognizes that financial performance is just one part of the larger picture of organizational performance. The system seeks to balance a company’s financial “perspective” with three nonfinancial “perspectives”: customer, internal processes, and workforce learning and development. Companies that implement the BSC methodology develop and use two powerful tools.
The first tool is a strategy map—a one-page document that graphically depicts executives’ theory of the organization’s strategy and the cause-and-effect relationships among objectives in the four scorecard perspectives. The map shows the strategic objectives of each perspective and how they will affect performance on objectives in other perspectives. Many companies develop a corporate-level strategy map as well as strategy maps for each division, unit, and department. These lower-level maps contain objectives supporting the high-level map.
The second tool is the scorecard, which contains the metrics, targets, and actual performance data for each objective on the strategy map. Companies have a corporate-level scorecard that links down to lower-level business and support-unit scorecards. Organizations often automate their scorecards with special software: when unit managers input data into their scorecards, the data is automatically aggregated into the high-level scorecard to show overall company performance. Software also allows managers to distribute and analyze reports easily.
Adopted by corporations, not-for-profit organizations, and public-sector entities (including government agencies, municipalities, and military forces), the BSC has become widely used for strategy execution.
Which system does your company use? If you don’t know whether your organization has adopted a PM system or which system it uses, how do you find out? The quickest way is to ask your manager. In addition, many organizations publish articles about their PM system in company newsletters and refer to it in their annual reports and other publications. In some organizations, an internal performance measurement team provides training on the system to existing employees and new hires.
Look to all these sources for information if necessary. And listen for mention of a particular PM system while attending CEO speeches and all-staff meetings.
Making performance measurement a regular part of your job: three steps Whether or not your organization has adopted a companywide performance measurement system, you can generate important benefits for your business by making performance measurement a regular part of your job. How? When you assess your group’s results and uncover the causes behind troubling changes in your results, you can engineer the interventions needed for your group to improve its performance and thus help the company generate better overall results.
How might you use measurement to better manage your group’s performance? You first need to understand the performance measurement process. This process consists of three steps, each of which we’ll explore in detail in the sections that follow. Here’s a brief description of the steps:
In step 1, deciding what to measure, you:
- Define your objectives—for example, “Increase customer satisfaction,” “Decrease on-the-job accidents,” or “Cut expenses.”
- Define critical success factors (CSFs)—the component parts of successfully achieved objectives, in other words, the actions that must be taken collectively to achieve a given objective. For instance, CSFs for the objective “Increase customer satisfaction” might include “Reduce sales staff turnover” and “Improve on-time delivery performance.”
- Define performance metrics—the measures you’ll use to assess whether you’re accomplishing your CSFs. Examples include “Average length of salesperson tenure in department,” “Number of sales staff departures per quarter,” and “Percentage of orders delivered within +/–six hours of promised delivery time.”
In step 2, gathering performance data, you:
- Set targets for each metric—for instance, “An 8 percent to 10 percent reduction in sales-staff turnover during the second half of our fiscal year” and “98 percent of orders delivered on time.”
- Collect performance data. For example, count the number of sales staff who left the company during the final six months of the company’s fiscal year, or record the delivery time of all orders during the past quarter.
In step 3, interpreting performance data, you:
- Analyze performance data. To illustrate, monitor the number of sales-staff departures that occur each quarter and determine whether you’re on track to reduce turnover by 8 percent to 10 percent as planned. In analyzing the data, you’ll want to examine the documented reasons for sales-staff departures (such as dismissals, transfers to other departments, acceptance of similar positions at a competitor, or retirements).
- Test your measurement system. For instance, ask whether any metrics should be changed to more accurately represent the objective you’re trying to achieve, or whether targets have been set at appropriate levels.
Let’s now take a look at step 1, deciding what to measure.