
Step 2: Gathering Performance Data

In the second step of the performance measurement process, you gather and check the reliability of data on the metrics you’ve identified. Start this phase by setting targets for each metric you’ve defined.
Setting targets
Targets represent the performance you want to see on each of your metrics. Table 4 gives examples.
Setting targets is a bit of an art. For example, you want to set targets that inspire people to deliver exceptional performance. But you don’t want to set targets so high that your direct reports assume they can’t reach them—and so don’t bother trying. In addition, you have to figure out what constitutes reasonable targets.
Examples of targets
| Performance metric | Target |
|---|---|
| “Number of employees who complete training course with passing grade by end of quarter” | “All employees complete training course with an end-of-course test score of 80 or above out of a possible 100 by end of quarter” |
| “Percentage of existing products updated with new features midway through the fiscal year” | “85% of existing products updated” |
| “Customer satisfaction index” | “Achieve 85% of customers who are very satisfied or extremely satisfied, which represents a 15% increase in customer satisfaction by year end” |
For instance, if you’re aiming for a defect rate of 100 parts per million (PPM) in a process your group performs, but industry defect rates for a similar process currently range from 400 to 1,000 PPM, your target maybe unrealistic.
Tips for setting performance targets
- Establish a three-point range of targets for your metrics. These three types of targets can work together to shape your group’s future performance. For example, a minimum target of “12 percent error rate” can feel more manageable to employees and help them gain the positive results and confidence to meet your moderate (“9 percent error rate”) and even “stretch” (“4 percent error rate”) targets.
- Involve your employees. Your direct reports are closest to the action and in the best position to provide information on what’s possible in their work. Involve them in setting targets; you’ll gain their buy-in as they feel a sense of ownership in the process.
- Consider trends to establish a target baseline. If past data exists for performance on a particular metric, examine that data for trends that can serve as a baseline for setting targets for future performance. For example, suppose you want to set a target for employee turnover over the coming six months, and turnover rates for your group have climbed slowly from 2 percent to 7 percent over the previous two years. In this case, a target of reducing turnover from 7 percent to 4 percent in the next six months may make sense and be realistic.
- Get your boss’s input. Ask your boss for ideas about what level of performance on each metric might best enable your group to achieve its objectives. Your boss may have some helpful suggestions based on his or her experience and understanding of unit and company goals.
- Use SWOT analysis. Consider your group’s internal strengths and weaknesses, as well as its external opportunities and threats. Ask yourself what targets would enable your group to build on its strengths and leverage opportunities, as well as minimize weaknesses and threats. For instance, if your group is particularly knowledgeable about your company’s products, perhaps the ambitious target of “25 percent increase in customer loyalty by quarter end” is perfectly realistic and achievable.
- Gather feedback from customers and other stakeholders. Expectations from these groups might yield insights you can use to set targets. For example, by asking customers what constitutes great performance in their minds, you can generate targets that will meet or even exceed their performance requirements.
- Consider industry averages. Numerous credible agencies monitor performance of specific industries; for example, J.D. Power & Associates tracks many industries. Review these performance ratings, and decide whether they can inform your targets. For instance, if error rates in an industrywide manufacturing process that your company uses range from 5 percent to 10 percent, those figures may serve as a reasonable target for your error-rate metrics.
- Identify initiatives. While considering targets, ask yourself what new projects or change efforts may be required to support achieving your targets. For example, to meet a target of “100 percent on-time delivery of orders,” will your employees need a new software application to track fulfillment processes? Will they need training on the new system?
Using benchmarking and baselines
How do you deal with the challenge of setting targets? Benchmarking can help. Use information from trade associations, industry publications, the Internet, and outside sources to benchmark, or compare your performance data and metrics with those of other companies. Some are very well known—such as the J.D. Power rankings. Also consider internal benchmarking sources—such as performance data from other groups that carry out similar processes or that have goals similar to yours. Then set targets that seem reasonable in light of the benchmarking information you’ve gathered.
Baselines, or starting points, can also help. If you’re setting targets for a performance metric on which your group or company has already gathered actual data, it can be helpful to use that data to establish a baseline. Many managers use the current period’s results or a yearly average to set their targets. For example, if your group’s sales have increased an average of 5 percent every quarter over the past two years, you might consider setting a target sales increase of 6 percent or 8 percent per quarter for the coming year.
For metrics on which no data exists, you might research an industry average and use that as your baseline.
Note: Using past data to set a baseline for your targets can be tricky. After all, how do you decide which number should serve as your reference point? For example, suppose you want to use sales from the fourth quarter of last year as your baseline. How confident can you be that the fourth-quarter figure represents a useful average of your group’s performance? If there were unusual circumstances during that quarter (such as a large number of unfilled sales positions), the figure may not be a good reference point, because sales would be lower than usual.
For these reasons, it’s important to carefully evaluate the historical data you’re considering using as your target baseline. Look at how the data for a particular period compares with the data from preceding evaluation periods to see whether there has been an abrupt change from the previous performance. If there has been, you’ll want to investigate the reasons for the change by asking your boss and peer managers for insights. And you may want to consider using a different period’s data to inform your target.
Determining a target range
Many managers set a three-point (minimum, moderate, and “stretch”) range for certain targets. For example, for the performance metric “Increase sales,” the minimum target might be “$500,000 sales per quarter”; the moderate target, “$800,000 sales per quarter”; the “stretch” target, “$1 million sales per quarter.”
This approach offers several advantages. Minimum targets can feel more manageable to employees and help them see what progress they need to make in order to reach the moderate and stretch goals. Though minimum targets aren’t truly subpar, managers don’t want employees to stop at achieving these targets. The “real” goal is usually the moderate point in the target range.
The “stretch” point in a target range represents the most ambitious target of all. In determining stretch targets, you need to achieve the delicate balance between challenging your employees and being realistic. A stretch target is intended to “raise the bar” enough to get your employees’ competitive juices flowing or to stoke their desire for achievement. And it usually requires significant effort to achieve. But it also must be set at a level at which your direct reports have the skills, knowledge, and company resources (equipment, processes, workspace, time) required to meet the target.
Stretch point n 1: the point in a target range representing the most ambitious target of all
To set stretch targets, make sure you’re familiar with your employees’ capacities and abilities. How have they reacted in the past when presented with ambitious challenges? Ask yourself how much of a stretch will motivate them to outdo themselves without becoming overwhelmed or demoralized. Also consider whether stretch targets carry the risk of encouraging negative or unethical behavior, such as “gaming” the system to achieve the desired performance. Finally, show your employees how achieving the stretch target on one metric will lead to outstanding performance on another and generate valuable rewards. For example, “If we increase customer loyalty by 10 percent, that will translate into a 15 percent jump in profitability. And that means a boost in your bonus compensation.”
Collecting and communicating data
After setting targets, you and/or your direct reports need to begin gathering performance data so you can compare actual performance with your target performance. Data can come from a number of sources. For instance, you may ask people in your department who lead call-center teams to track the number of phone calls customers must make before representatives resolve their complaints or questions.
You may also depend on people in other groups or units to gather data on your performance metrics. Many companies identify “metric owners,” who have specific knowledge that enables them to collect valid data on a performance metric. To illustrate, perhaps someone in the HR department will supply data on the number of employees in your group who have attended safetytraining courses and passed the end-of-course test. Or the finance manager can give you interim profitability numbers.
How’m I doing?
—Ed Koch, former mayor of New York City
If your company has a formal performance measurement system in place, senior managers or a dedicated unit may have created data-gathering forms for you and other managers to use. These may be hard-copy documents, such as memos that you fill in by hand and submit to a PA system administrator. Or they may consist of electronic forms—spreadsheets or Web-based data-entry forms that you fill in online and e-mail to the PA system administrator.
Automated data-gathering systems, often linked to a company’s data warehouse or enterprise resource planning system, offer numerous benefits. They handle huge volumes of data easily and can generate reports showing the data in different formats (such as pie charts, tables, or graphs). In addition, they can aggregate data from different units or groups into one number. For instance, the system may show “Division sales,” while also enabling managers to drill down to see sales generated by each region and salesperson within the division. They also help you analyze cause and effect by enabling you to “slice and dice” data in different ways.
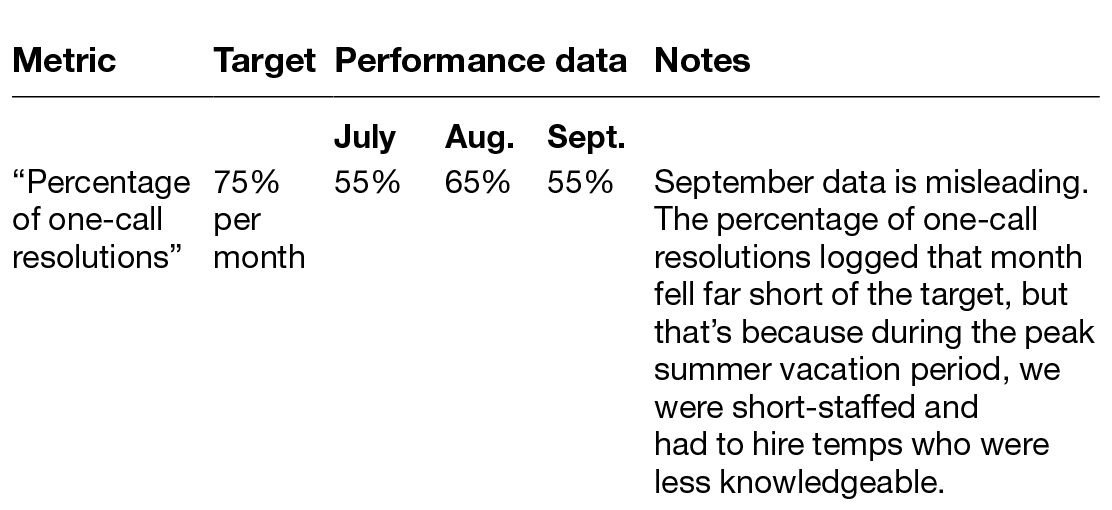
If your organization doesn’t use a formal performance measurement system, you may need to develop data-gathering forms yourself. In this case, simplicity and ease of use are critical to getting the data you need. Develop a consistent form that enables you and other metric owners to provide information easily, conveniently, and quickly, and that accommodates short notes regarding the data. Table 5 gives an example of a simple, easy-to-use data-gathering form for the metric “Percentage of one-call resolutions”:
Data-gathering form
Steps for communicating performance data to your group
- Review your group’s performance data. Gather all the reports, forms, and other documents in which your group’s performance data is recorded for the period in question. Review the data, looking for places where actual performance differs from the targets you set.
- Craft a story about what’s happening. Based on what you’re seeing in your group’s performance data, develop a narrative describing what’s happening with performance. Highlight interrelationships between metrics, and note possible explanations for why actual performance is differing from targeted performance—for example, “We’re having trouble reaching our targeted 3 percent error rate, and that’s negatively affecting customer satisfaction and costs. New hires and order-processing software may have played a part in raising the error rate these past two months.” Seek others’ ideas about the underlying causes of performance problems. Peer managers, your boss, and some of your employees may have valuable insights into what’s going on.
- Create charts and graphs. Where possible, translate numerical information into simple charts and graphs that capture trends. For example, a line graph showing an increase in error rate over the past six months can prove far more compelling than a list of numbers. Also, snapshot views are handy for senior managers. Thus, if you will be sharing performance results with them, they will appreciate receiving information in such a succinct way.
- Select the appropriate degree of detail. Consider what your employees need to know about the group’s performance in order to make improvements. Decide whether the story you’ve crafted and the charts and graphs you’ve prepared contain the right degree of detail to make your point. Too much detail, and your employees may become confused or lose interest. Too little detail, and they may not grasp the importance of a performance problem.
- Communicate difficult facts constructively. Even if your narrative, your charts and graphs, and the details you’ve gathered about your group’s performance present a discouraging picture, it’s important to communicate the truth about performance to your employees. However, in communicating the information, strive to do so constructively. That is, don’t single out individuals as the cause behind poor group performance. Instead, look for the problematic processes and systems behind the shortfalls and explore ideas for addressing them.
- Create opportunities for review and discussion. Set up meetings and review sessions with your group to specifically discuss performance results and changes made to address them. Together, explore what has worked well and what hasn’t. Encourage your employees to adopt a mind-set of continual, collective improvement.