Tools for Measuring Performance
MEASURING PERFORMANCE
Worksheet for Understanding Key Performance Indicators
Use this worksheet to identify and understand your company’s and unit’s key performance indicators (KPIs).
- What are your company’s high-level goals? Consider the type of organization you work for, its mission, and its strategy. For example, if your company is global, perhaps a high-level goal is to expand sales in international markets. If your organization is a social service nonprofit, maybe a goal is to reduce the ratio of administrative costs to total donations received. If you’re not sure of your company’s high-level goals, ask your boss for clarification.
- What measures does your company use to assess how well it’s achieving its high-level goals? These measures are the company’s key performance indicators. Examples may include “Percentage of income deriving from international markets,” “Total administrative costs as a percentage of donations received,” “Return on investment,” “Economic value added,” and “Break-even time.” If you’re not sure which KPIs your company uses, ask your boss for advice. Most companies have three or four KPIs.
- Of your company’s key performance indicators, which are input KPIs? Which are process KPIs? And which are output KPIs? Input KPIs might include investments in research and development, funding for employee training, quality of raw materials, and other assets and resources used to generate business results. Process KPIs might encompass order delivery time, time to fill vacant positions, product repair cycle time, and other efficiency-related measurements. Output KPIs might include revenues, return on investment, economic value added, break-even time, revenues, number of new customers, and other results of business activities.
- What KPIs has your unit defined? Each unit has different KPIs tailored to its function within the company. For instance, the customer service department probably tracks the number of customers served during a given time period. The product development unit likely assesses the number of new offerings introduced and the ratio of new to existing products. And the human resources unit probably measures workforce skill levels, hiring efficiency, and other human capital–related activities.
- Which of your unit’s KPIs are input? Process? Output? See the examples in question 3 for reminders.
- In what ways do your unit’s KPIs relate to and support your company’s KPIs? For example, suppose you work for a global consumer goods company that has a KPI “Percentage of income deriving from international markets,” and you lead a group in the adult apparel unit. In this case, your unit’s KPIs might include “Number of satellite offices established in Europe,” “Total sales for Europe, Middle East/Africa, and Asia,” and other KPIs related to your company’s goals.
MEASURING PERFORMANCE
Worksheet for Understanding Your Company’s Performance Measurement System
Use this worksheet to identify and understand the performance measurement approach your company uses.
- What aspects of business performance does your company measure? For example, does it measure improvements in all business processes (manufacturing, product development, order fulfillment, customer service), or just some—and if so, which ones? Does it assess the effectiveness of solutions to problems? Does it look beyond financial indicators to assess nonfinancial “perspectives” on business performance such as workforce learning, process efficiency, and customer service? Does it track performance on criteria such as knowledge management, customer focus, leadership quality, and strategic planning? If you’re not sure, talk with someone in the unit or team responsible for measuring performance.
- What kinds of performance data does your unit routinely gather? And how is this data used to help form a picture of overall company performance? If you’re unsure, ask your boss for his or her insight.
- Has your company adopted a formal performance measurement (PM) system? If so, what is it? Common PM systems include a dashboard or cockpit, as well as quality-improvement systems such as Plan-Do-Check-Act, Six Sigma, and the Baldrige National Quality Program. The Balanced Scorecard is another widely used performance measurement system; many companies use it to understand the relationship among nonfinancial performance and financial results, and to better manage strategy execution. If you’re not sure whether your company uses a formal PM system or which system it uses, ask your supervisor for clarification.
- How is performance data from each unit in your company entered into the company’s PM system? Do unit managers collect data from group leaders such as yourself, aggregate the data on spreadsheets, and e-mail the documents to the PM system team? Is there an internal Web site that unit managers can use to input the aggregated performance data?
- What kinds of performance reports does your company’s PM system generate? Does the system produce monthly or quarterly company-level results broken down by unit? Are results coded in some way to indicate how they compare with performance targets? For example, do reports use a “traffic light” system—coding on-target or above-target performance as green and problem performance as yellow or red?
- How does your unit use the performance information generated by the company’s PM system? Who has access to the information? Do unit leaders such as your boss meet regularly with group leaders to discuss performance results?
MEASURING PERFORMANCE
Worksheet for Deciding Which Performance Aspects to Measure
Use this tool to define objectives for your group, identify critical success factors (CSFs) for each objective, and translate your CSFs into performance metrics. This tool is especially helpful if your company does not use a formal performance measurement system.
- What does your group need to achieve in order to contribute to your company’s performance? Consider ways in which your group can support your unit’s or company’s strategy, solve recurring business problems, serve customers better, and acquire needed skills or knowledge. Brainstorm as many ideas as you can.
- Of the needed achievements you listed in step 1, which do you consider most important? Why? Try to whittle your list down to about five to seven items. These become your group’s objectives.
- Look at each objective you listed in step 2. For each objective, identify the two or three actions that would best enable your group to accomplish that objective. These become your critical success factors (CSFs). For example, if one of your objectives is “Improve knowledge sharing,” your CSFs might include “Improve new-hire mentoring” and “Establish job-shadowing relationships.” Note your ideas in the table below. Ask your employees or colleagues for ideas, too—the people closest to each process or task can often provide helpful insights.
Objective Critical Success Factors - Look again at each CSF you listed in step 3. Express each CSF as one or more performance metrics. For instance, the CSF “Improve new-hire mentoring” could be translated into the performance metrics “Percentage of new hires this year who have mentors assigned by their start date” and “New hires’ knowledge of company policies and job responsibilities.” List each CSF and its corresponding performance metric(s) in the table below.
Objective 1: Critical Success Factor Corresponding Performance Metric(s) Objective 2: Critical Success Factor Corresponding Performance Metric(s) Objective 3: Critical Success Factor Corresponding Performance Metric(s) Objective 4: Critical Success Factor Corresponding Performance Metric(s) Objective 5: Critical Success Factor Corresponding Performance Metric(s) Objective 6: Critical Success Factor Corresponding Performance Metric(s) Objective 7: Critical Success Factor Corresponding Performance Metric(s) - Document your ideas about how you’ll gather the data required to track the performance metrics you’ve defined in step 4. For each metric, list ideas for gathering the data in the table below.
Metric Possible Data Sources Example: Example: “Number of employees who pass training with an end-of-course score of 80 out of 100” HR department or consultancy that provided the training
MEASURING PERFORMANCE
Worksheet for Setting Performance Targets
Use this tool to set performance targets for the metrics that you’ve created for your group or that your boss has defined for your group based on the company’s formal performance measurement system.
- In the first column of the table below, list the performance metrics established for your group.
- In the second column, write a range of possible targets.
- In the third column, note your rationale for the target ranges you’re proposing. Possible influences on your choice of target may include benchmarks (such as targets considered reasonable by other companies in your industry) as well as historical data that can serve as a baseline for your target.
| Metric | Possible Targets | Rationale |
|---|---|---|
| Example: | Example: | Example: |
| Percentage increase in customer satisfaction by year end | Minimum: 5% | 10% is a bit aggressive but may stimulate my group’s competitive spirit. We have the systems, skills, and commitment in place to push for this stretch target. Also, over the past year, customer satisfaction picked up during the third and fourth quarters. I think we’ve got some momentum going that we can use to achieve these increases. |
| Moderate: 8% | ||
| Stretch: 10% increase in customer satisfaction by year end | ||
MEASURING PERFORMANCE
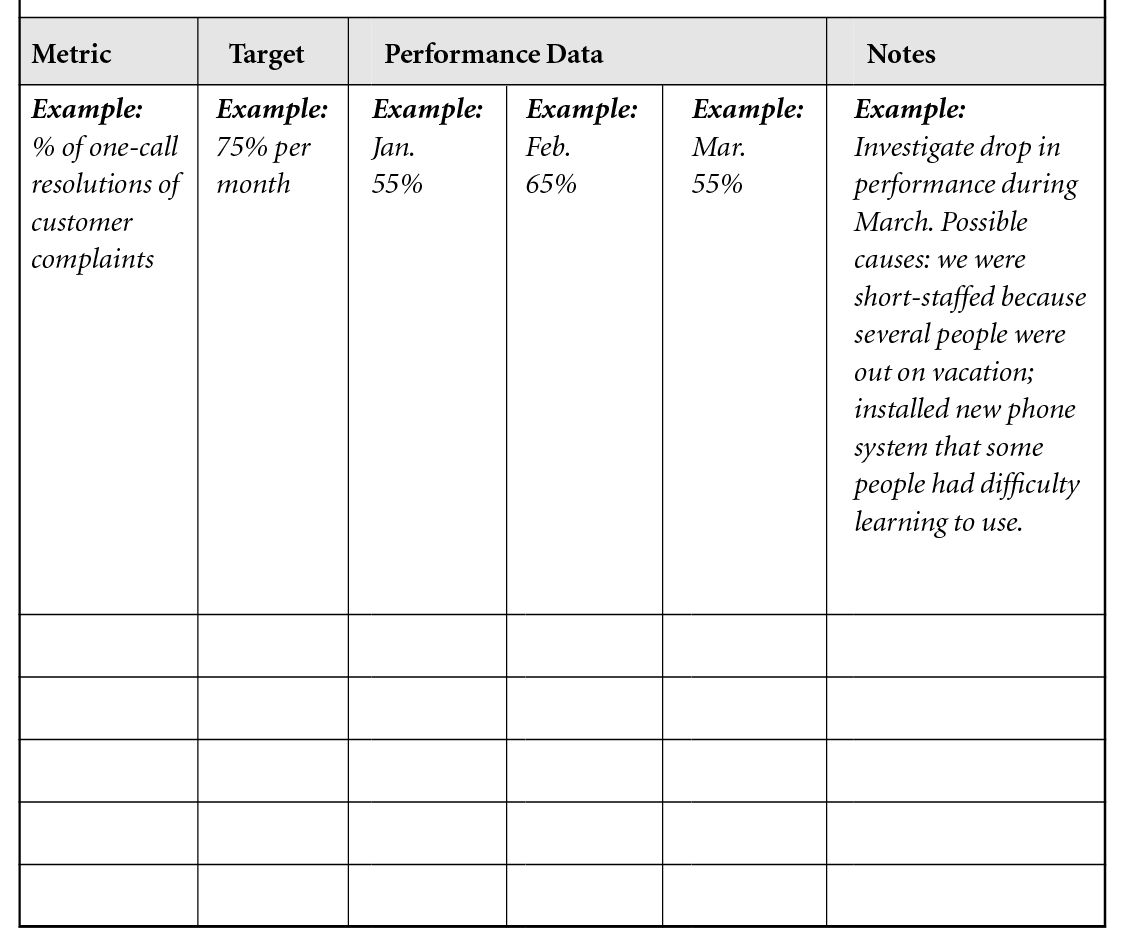
Worksheet for Tracking Performance Results
Use this tool to track your group’s performance results over several evaluation periods and to document thoughts about how to interpret and respond to the results.
- In the first column in the table below, list the performance metrics established for your group.
- In the second column, record the target you’ve set for each metric.
- In the next three columns, record the actual performance for each metric over each evaluation period.
- In the final column, record your thoughts about what the performance data seems to be indicating and how you might best respond to the data.