
Step 3: Interpreting Performance Data

In the next step of the performance measurement process, you analyze the data you’ve gathered on your performance metrics and determine its implications. Interpreting performance data is a complex discipline in itself. In many companies, a unit staffed by experts trained in statistical analysis, correlation and regression analysis, and other data-interpretation approaches and tools performs this activity.
But in the interest of gaining an overview of the entire performance measurement process, it’s helpful to know a bit about how performance data is evaluated and what you and others might look for when interpreting results.
Comparing targeted and actual performance
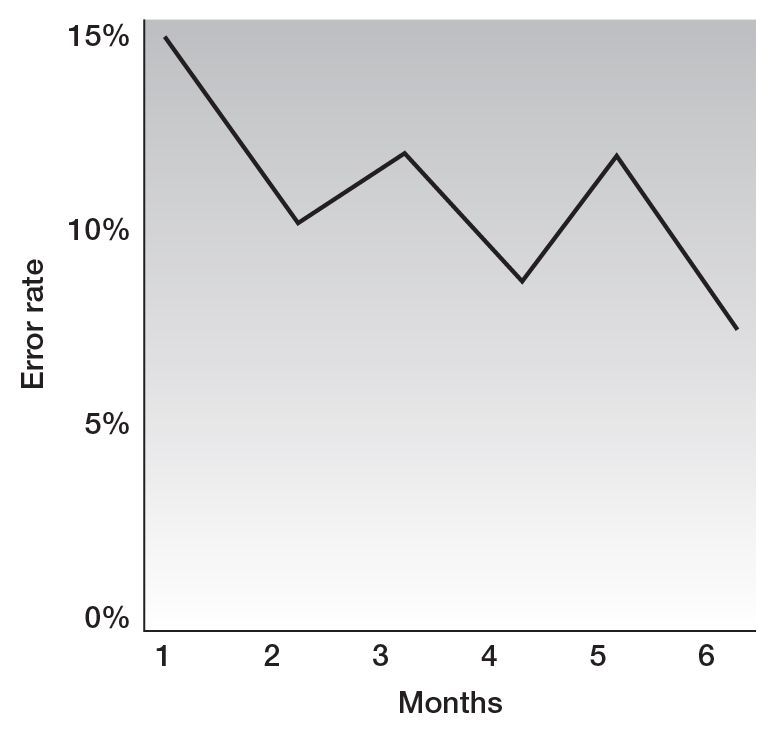
You’ve been gathering data on your performance metrics for some time. What should you do with the data? What do the numbers mean? A good first step is to compare your data with the targets you set for each metric. For example, suppose you set the target, “5 percent maximum product manufacturing error rate,” to be reached at the end of six months. You’ve tracked actual error rates over the past six months and recorded the rates (see figure 2).
Clearly, the error rate has fluctuated over the period in question, with a general downward trend. And the rate at the end of the six months is not as low as the 5 percent you set as your target. How should you respond? You might draw several conclusions:
Track of actual error rates
- “We didn’t reach our target, so we should overhaul our error-reduction efforts. Perhaps we need a new initiative focused on sharpening shop-floor staff training in using the manufacturing equipment.”
- “The trend is generally downward. Even if we didn’t reach our target by the end of the six months, we seem to be heading in the right direction. Let’s see what happens over the next few months, and decide whether we need to reexamine our error-reduction efforts.”
- “The target was too aggressive. We don’t have the capacity to reduce errors as much as we had hoped. Let’s revise
the target to make it less aggressive—say, a 9 percent error rate.”
What Would YOU Do?
On Target with Target Setting?
ALLEN LEADS a product development group in the electronics unit of Hainsworth & Smith, a large consumer goods company. Top management has asked leaders in each business unit to form a special team charged with defining new performance metrics for their unit. Allen’s boss has asked him to participate in the electronics unit’s team. This team also includes representatives from other functions within the unit, such as manufacturing, operations, finance, and IT. All teams will share their ideas with an executive steering committee, which will then combine the ideas to build the most appropriate companywide performance measurement system.
Hainsworth & Smith’s strategy centers on building a global reputation as a company on the leading edge of technology. Several members of the team meet with managers throughout the unit to get their thoughts about the electronics unit’s role in executing this strategy.
The team then develops several objectives for the unit that support this strategy, including “Boost rate of successful innovations introduced,” “Develop more innovative products for mobile use,” and
“Speed products to market.” The team then defines a few CSFs for each objective and translates the CSFs into performance metrics. Members share the list of metrics with the steering committee, which approves them as a good starting point. They then turn to setting targets for each metric. Members discuss several possibilities. For example, perhaps setting only aggressive targets would stimulate employees’ competitive spirit. Or maybe it’s more important to maintain employees’ confidence by setting flexible targets that can be lowered if they prove unachievable. Allen and the others are struggling with the target-setting process.
What would YOU do? The mentor will suggest a solution in What You COULD Do.
- “Perhaps the data isn’t reliable. How do we know we can trust these rates?”
Given all these possible interpretations, how do you select the best response to what you’re seeing in your data?
Deciding how to respond
Savvy managers consider the following four practices for deciding how to respond to performance data:
- Look for trends that can help you identify the bigger picture of how performance is changing over time, as reflected in the data you’re gathering. If your actual performance is trending in the desired direction, you may not need to intervene.
- Consider the inherent variability in the process being measured, so you keep your perspective. You don’t want to overreact to a variation in performance measures that is due to normal fluctuations. For example, sales on a particular line of products may vary across seasons. Some companies set ranges of normal variation for such metrics and respond only when actual performance is outside that range.
- Think about what’s causing any variations in the data that can shed light on the forces beneath variations. Ask yourself what events or forces might underlie the variations you’re seeing in your performance data. For instance, suppose you see a major jump in error rates during month three of your data-tracking period. You’d want to investigate what was going on during that time that might have affected the error rate. Was a new piece of manufacturing equipment introduced at that time, and did the production staff have difficulty using it? Maybe the shop floor took on several new hires that month, and they hadn’t yet mastered use of the equipment. In each of these cases, you might decide to hold off taking drastic action.
- Ask whether your targets or metrics need to be changed, so you can determine if you need to reconsider your targets or metrics. Sometimes, when you see an abrupt change in your performance data, it’s a signal that you need to reconsider your targets or metrics. Such signals can occur if your organization has changed an important process. An abrupt change in error rate may, for example, result from an employee scheduling change. Perhaps after starting your measurement program, you stopped the practice of allowing employees to vary their shifts, assigning each person a permanent shift. That could cause error rates to drop and then stabilize, suggesting that you can reasonably set lower targets for that metric.
Here’s another example. Suppose that over the past twelve months, you’ve been tracking the number of weeks it takes to fill vacant positions in your group, with the goal of bringing new hires on board faster. At month six, the number of weeks decreases sharply—and stays at roughly the same level during months seven through twelve. When you investigate, you discover that your company’s HR department overhauled its recruiting processes during month six by installing an online job-posting and job-application module in its human resource information system. This new technology has vastly accelerated the hiring process, so that many new hires can now take days instead of weeks. Suddenly, your metric “Number of weeks” has less meaning than it did before. If you still want to accelerate the hiring process, you might change your metric to “Number of days.” Or you may decide that the new technology has helped you improve the hiring process sufficiently, and you now want to measure some other aspect of your group’s performance.
Clearly, interpreting performance data can be complex and challenging. Your company may have a unit devoted to analyzing all performance data. If it doesn’t, and if you’re struggling to make sense of a particular set of data, seek help from your boss or from an expert in your company who specializes in statistical analysis.
What You COULD Do
Remember Allen and his team’s uncertainty about how to set targets for their unit’s performance metrics?
Here’s what the mentor suggests:
Though aggressive targets can inspire people to deliver exceptional performance, such targets on their own can demoralize people if they’re unrealistic. For example, if industry benchmarks show that product development times typically range from twenty-four to twenty-seven months, Allen wouldn’t want to set a target to launch new products in twelve months. Given the industry’s current best practice, employees would likely view a 50 percent reduction in product launch time as an unrealistic target. Any attempt to reach this target may be marked by discouragement and end in failure.
Moreover, Allen and his team should avoid lowering targets when actual performance falls short of the target. This approach misses the point of performance measurement. There will be times when a target will turn out to be too aggressive and unrealistic, and thus lowers merit. But more often, a better move is to identify and implement reasonable adjustments to processes, systems, and other aspects of a group’s activities to bring actual performance up to the desired levels.
Allen’s team should set a range of targets. This will help motivate employees by showing them the gains they need to achieve in order to boost performance dramatically. In a three-point target range, the “moderate” (midpoint) target represents performance that is slightly beyond what the group can achieve by continuing historical trends. It’s achievable if people work together and contribute new ideas about how to achieve the moderate point. The moderate target is augmented by two additional targets: a minimum expectation for improvement over current levels, and an aggressive “stretch” target that lies somewhat beyond what now seems achievable. Stretch targets, if achieved, would represent a dramatic improvement in performance in the eyes of customers and other stakeholders.