Design, Energy and Cost Analyses of Membrane Processes
Abstract
Energy consumption, product water costs and technology reliability are key parameters that determine the viability of a process. Both cost and energy for desalination, especially seawater RO, have fallen dramatically since the 1970s due to the development of higher permeability and higher performance membranes, lower operating pressure, use of energy recovery devices, more efficient pumps and well-established RO feed water treatment practices. In addition, membrane plants have proven reliable in the field with longer life and lower plant maintenance costs. Engineering analyses of typical commercialised and well-established membrane processes used for desalination and municipal and industrial water treatment are discussed as well as relevant data on energy consumption and water costs presented with special focus on seawater and brackish water desalination.
“How did the biggest financial train wreck in human history come about? Arguably, one contributor was a mathematical equation.”
—Ian Stewart (In Pursuit of the Unknown, 2012)
Since the 1990s, membrane-based separation processes integrated with traditional treatment systems have been successfully deployed in large desalination, wastewater and municipal water treatment plants [1–4]. More than a dozen large seawater RO (SWRO) plants with product water capacities greater than 200,000 m3/day have been commissioned in the last decade.
Energy consumption, product water costs and technology reliability are key parameters that determine the viability of a process. Both cost and energy for desalination especially SWRO have fallen dramatically since the 1970s due to the development of higher permeability membranes, lower operating pressure, use of energy recovery devices and more efficient pumps as well as good RO feed water treatment practice. In addition, membrane plants have proven reliable in the field with longer life and lower plant maintenance costs.
Since 1980, the specific energy consumption (SEC) of SWRO has dropped from 10 kWh/m3 to 3.0–5.0 kWh/m3 and product water cost from $2.00/m3 to about $0.75–1.25/m3 [3]. The energy and cost figures for brackish water RO (BWRO) at 70–75% recovery today are 0.5–1.0 kWh/m3 and $0.15–0.75/m3, respectively. The theoretical minimum energy of desalination for seawater at 35,000 mg/l (ppm) salt and at a typical recovery of 50% is 1.06 kWh/m3 [5]. The actual energy consumption, however, is higher; for example, recovering 50% of a 35 g/l feed will have a practical minimum energy of 1.56 kWh/m3. Further, more than 1 kWh/m3 energy is required for pre-treatment, post-treatment and pumping of feed water, product water and brine reject. Realistically, therefore, a minimum of 2.6 kWh/m3 is consumed in a SWRO plant. Current state-of-the-art SWRO plants consume 3–5 kWh/m3 of energy. The likelihood of reducing overall water cost and energy consumption of SWRO plants to < 2.2 kWh/m3 is unlikely due to several limiting factors such as membrane type and material, low product water recovery (PWR) (40–45%), concentration polarisation, fouling, membrane element hydrodynamics and RO system design [5,6].
Engineering analyses of typical commercialised and well-established membrane processes used for desalination and municipal and industrial water treatment are discussed and relevant data on energy consumption and water costs presented with special focus on seawater and brackish water desalination.
5.1 Membrane System Performance Correlations
The transport properties of a semi-permeable membrane are determined by the permeability of the membrane and by a driving force both of which impact energy requirements. The flux of the solvent is directly proportional to the applied pressure and is given by the equation at constant temperature:
where Jw is membrane water flux, A is membrane permeability coefficient, ΔP is hydraulic differential pressure across the membrane, and Δπ is osmotic pressure differential across the membrane. For liquids other than pure water the proportionality does not exist as shown in Figure 2.27 due to fouling and/or concentration polarisation.
The viability of a membrane process for potable water production depends on the energy consumption. The power input reflects the pressure energy required to pump water molecules through a size/charge selective membrane and is expressed as SEC in kWh/m3 of product water. The following relationships are used to calculate energy consumption:

![]()

Membrane performance correlations are given below. For additional correlations refer to Section 2.4.7.
5.1.1 RO/NF systems
The performance of RO and NF membrane processes is typically determined by two key parameters, recovery and rejection, defined as follows:


where Fp and Ff are product and feed flow rates, respectively and Cf and Cp are feed and product water salt concentration, respectively. The product water (permeate) flow rate increases 3% per °C rise in water temperature because of lower viscosity (lower energy requirement) based on the general relationship between flux and temperature:
where Js is the flux at standard temperature, Ts (e.g. 25°C) and Jm is the flux at process temperature, Tm.
The net driving pressure, NDP, across a RO/NF membrane is estimated from:
where NDP is the net driving pressure, bar; Pfeed is feed pressure; Pbrine is reject pressure; Pperm is permeate pressure; πavg conc. is average osmotic pressure on the feed side; πavg perm is osmotic pressure of the permeate. πavg conc. can be estimated from the log-mean average solids concentration, Cfeed avg:

where C is the concentration, moles/l; and Rec is PWR, %. The expression 1/(1 − Rec) is the concentration factor, i.e. if the recovery is 75%, the solute concentration in the membrane feed channel is four times.
The osmotic pressure, π, of a saline solution is calculated from:
where T is temperature, °K; Σmi is summation of molarity of all ionic and non-ionic dissolved solids, and R is a constant = 0.0821 l bar/K mol. For solutions with total dissolved solids (TDS) less than 5000 mg/l, π = (0.01) × (TDS).
The amount of product water (permeate) is generally dependent on (i) total area of membrane within each pressure vessel, (ii) membrane pressure supplied by the high-pressure pump(s), (iii) reject flow rate, and (iv) feed water quality, as discussed in Chapter 2.
5.1.2 UF/MF systems
Flux across UF/MF membranes is defined based on Darcy’s law as

where J is flux, lmh; Qp is the flow rate of filtrate (permeate), l/day; Am is membrane area, m2; TMP is trans-membrane pressure, bar; μ is solution viscosity, cp; and Rm is hydraulic resistance of the membrane, bar/lmh. cp.
where Pf is average feed pressure in the feed channel, bar; Pr is average pressure of the reject stream, bar; and Pp is average pressure in the permeate manifold, bar.
The expression for normalising flux for temperature is given in Equation (5.4).
PWR is the permeate (filtrate) flow as a percentage of feed flow defined in Equation (5.2). In the case of UF/MF, the relationship is modified to incorporate the filtrate used during backwashing:

where Qf is the feed flow rate over 24 h, m3/h and Qp is the net filtrate flow rate, m3/h where Qp is filtered water less filtrate used for backwash.
5.2 Energy and Cost Survey of Membrane Processes
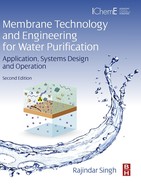
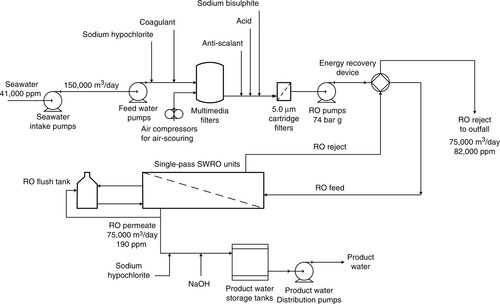
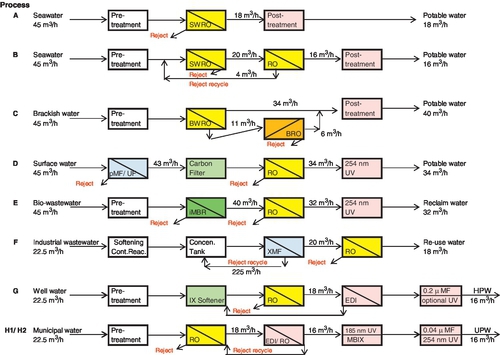
Membrane processes for this analysis include SWRO, BWRO, low-pressure RO (LPRO), brine recovery RO (BRO), pressurised MF/UF (pMF/UF), immersed membrane bioreactor (iMBR), cross-flow membrane filtration (XMF) and electrodeionisation (EDI). Membrane process characteristics for water treatment are detailed in Table 5.1. Typical process flow schematics of RO membrane plants are shown in Figures 5.1 and 5.2. RO/NF systems are typically multi-stage and single-pass or multi-stage and double-pass, as shown in Figures 2.21–2.23.
Table 5.1
Membrane processes water treatment chart
For our illustrative purposes we have assumed the plants are sized for feed water flow rates upto 1 million litres per day (MLD) at ambient temperature. Corresponding block flow diagrams with mass balances are shown in Figure 5.3. Pre-treatment and post-treatment technologies are discussed in detail in Chapters 2–4, but are also summarised in Table 5.1 and illustrated in Figures 5.1 and 5.2.
5.2.1 Energy consumption survey
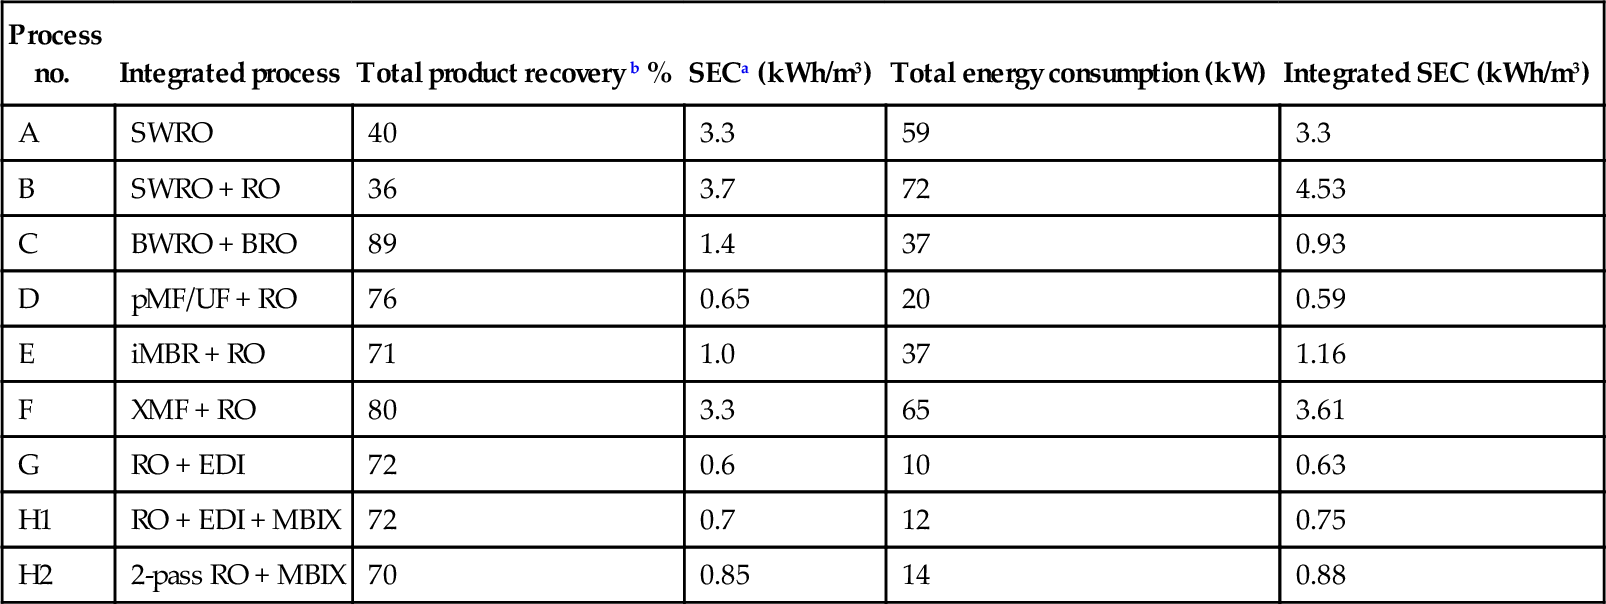
SEC data for various membrane plants based on published data are given in Table 5.2 [3,5,7–16]. The effect of temperature on performance and SEC is discussed in Section 5.2.2. Estimates of total energy consumption and the power required for each plant are given in Table 5.3. Total energy consumption for the plant includes power consumed by the membrane unit, pre-treatment, post-treatment, and pumping of feed water, product water and brine reject. Energy consumption for a SWRO unit is typically 70–80% of the total plant energy and 40–50% of the total plant energy for a non-seawater RO unit [5,7,9,12–14].
Table 5.2
Specific energy consumption of membrane plantsa
| Membrane process | Specific energy consumption (kWh/m3) | Typical applications |
| SWRO | 2.8–4.5 | Seawaterb desalination w/energy recovery |
| SWRO + RO | 3.5–5.0 | Two-pass seawaterb desalination w/energy recovery |
| BWRO | 0.5–1.0 | Brackish water desalination; TDS > 1500 ppm |
| BWRO + BRO | 0.9–1.4 | High recovery, i.e. primary RO + brine RO |
| RO | 0.3–0.7 | Feed water TDS < 1000 ppm |
| NF | < 0.5 | Water softening, organics removal; RO pre-treatment |
| Pressurised MF/UF | 0.1–0.2 | Surface water, wastewater, RO pre-filtration |
| Submerged MF/UF | 0.05–0.1 | Surface water, wastewater, RO pre-filtration |
| External MBR | 2.0–4.0 | Landfill leachate, industrial wastewater, RO pre-filtration |
| Immersed MBR | 0.3–0.9 | Municipal/industrial wastewater, RO pre-filtration |
| Cross-flow MF | 2.5–3.0 | High hardness, high silica wastewater; metals wastewater |
| EDI | 0.2–0.3 | RO permeate polishing, high-purity water |
a Includes energy consumption for the membrane unit, pre-treatment, post-treatment, and pumping of feed water, product water and brine disposal.
b Total dissolved solids ~ 34,000 ppm; Temperature = 25°C.
Table 5.3
Estimated energy consumption of integrated membrane plants in Figure 5.3.
| Process no. | Integrated process | Total product recovery b % | SECa (kWh/m3) | Total energy consumption (kW) | Integrated SEC (kWh/m3) |
| A | SWRO | 40 | 3.3 | 59 | 3.3 |
| B | SWRO + RO | 36 | 3.7 | 72 | 4.53 |
| C | BWRO + BRO | 89 | 1.4 | 37 | 0.93 |
| D | pMF/UF + RO | 76 | 0.65 | 20 | 0.59 |
| E | iMBR + RO | 71 | 1.0 | 37 | 1.16 |
| F | XMF + RO | 80 | 3.3 | 65 | 3.61 |
| G | RO + EDI | 72 | 0.6 | 10 | 0.63 |
| H1 | RO + EDI + MBIX | 72 | 0.7 | 12 | 0.75 |
| H2 | 2-pass RO + MBIX | 70 | 0.85 | 14 | 0.88 |
a Values based on data in Table 5.2.
b Product water recovery, %R: SWRO = 40%, BWRO = 75%, BRO = 55%, RO = 80%, pMF/UF = 95%, iMBR = 90%, XMF = 90%.
Process A – single-pass RO seawater desalination
The product water quality for a single-pass SWRO unit is typically 300–500 mg/l TDS, which is well below the World Health Organisation (WHO) drinking water limit of 1000 mg/l. The single-pass SWRO system is capable of producing 18 m3/h potable water operating at 40% recovery based on a feed water flow rate of 45 m3/h (see Figure 5.3). The total energy consumption is 59 kW given in Table 5.3 based on SEC of 3.3 kWh/m3 with energy recovery.
The SEC of SWRO has dropped from 10 kWh/m3 to typically < 4.0 kWh/m3 in the last 30 years [3,5,9,12–14] as a result of improvements in membranes, systems design and hardware. The process, however, is still energy intensive. Additional reductions of 10–20% may be achievable when operating with modified staged designs of membrane arrays [5,6,14] and/or operating in a combined heat and power mode [13].
The thermodynamic minimum energy independent of the desalination process is 1.06 kWh/m3 [5,7,13,14]. The lowest energy consumption achieved in pilot studies is 1.6 kWh/m3 [5,17]. The likelihood of reducing the energy consumption of commercial SWRO plants to < 2.0 kWh/m3 is, however, unlikely [5,13,14] because of a number of reasons; system design, low PWR (< 50%), high osmotic pressure and membrane concentration polarisation.
Process B – double-pass RO seawater desalination
A double-pass SWRO system is required to produce potable water with TDS less than 200 mg/l and to meet the WHO’s drinking water standard for boron of 1.0 mg/l. Boron concentration in seawater is usually between 4.0 and 6.0 mg/l, depending on the location (in contrast, typical river water has a boron concentration of 0.05–0.2 mg/l). Since the boron concentration in the permeate from a single-pass SWRO is generally > 0.8 mg/l, a second-pass RO is required with the feed water pH > 9.0. It is difficult to remove boron for the following reasons: boron exists as a weakly dissociated boric acid, H3BO3 at pH < 8.2, which is typically the pH of seawater, and the molecular size of boric acid is so small that it is difficult to remove by size exclusion. Boron rejection level is enhanced at the pH > 9.3 when the boron changes from boric acid to its salt resulting in high rejection by RO membranes that are generally negatively charged [18,19]. Rejection changes from approximately < 30% to > 90%:
As shown in Figure 5.3, the first-pass SWRO unit permeate flows to the second-pass RO unit at 20 m3/h operating at 45% recovery based on a feed water flow rate of 45 m3/h. The pH of second-pass RO feed is raised to > 9.0 with caustic soda. The second-pass RO unit produces 16 m3/h operating at 80% recovery (recoveries > 80% are typical for second-pass RO units). The second-pass RO reject flows to the SWRO inlet at 4 m3/h (with TDS substantially lower than the first-pass RO seawater feed). The total energy consumption is 72 kW based on SEC of 3.3 kWh/m3 for the SWRO unit with energy recovery and 0.4 kWh/m3 for the second-pass RO unit (Table 5.3). The integrated system SEC is 4.53 kWh/m3.
Process C – brackish water RO desalination
Typically, BWRO plants operate at 70–75% recovery so that 25–30% of feed water is wasted as concentrated brine. Product water recoveries greater than 80% are generally constrained by the solubility limits of sparingly soluble scale-forming compounds discussed earlier; as the feed/brine water gets concentrated in the channel above the membrane, e.g. by a factor of 4 at 75% recovery and 10 times at 90% recovery, the salt concentration also gets concentrated. The salt concentration is even higher at the membrane surface due to concentration polarisation, and must not be more than 20% higher than in the feed/brine channel. In the case of brackish waters, CaCO3 and gypsum (CaSO4 · 2H2O) are the most common scalants. Gypsum (solubility product, Ksp = 1.9 × 10− 4 at 25°C) is much more soluble than calcium carbonate (Ksp = 8.7 × 10− 9 at 25°C). Limiting salts can be identified from their Ksp values. The deposition of the scale-forming compounds can be limited to an extent by reducing the pH with acid and/or by the use of anti-scaling chemicals, which interrupt crystal growth at the nucleation stage.
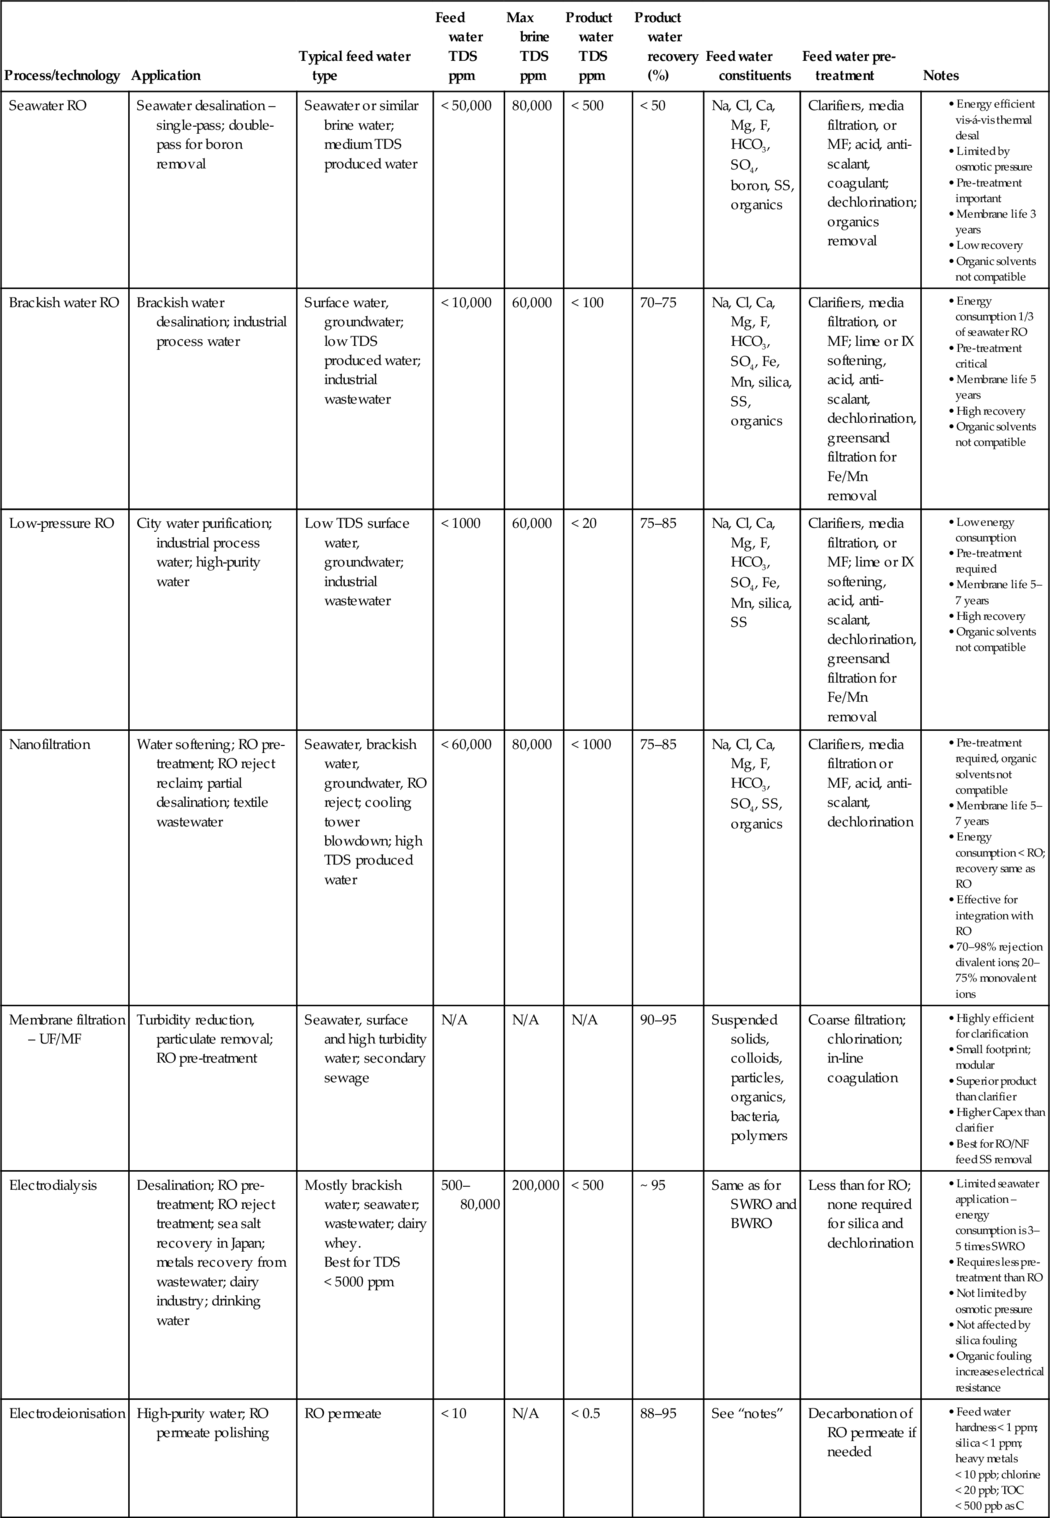
Because of high costs of disposing brine, and the need to reclaim and conserve water, primary RO (PRO) reject water can be purified using a brine RO (BRO) and/or NF system to recover additional potable water and reduce the volume of the brine stream, as shown in Figure 5.2. Such PRO + BRO systems can achieve overall product water recoveries of 87–96% for low to medium TDS (< 4000 mg/l) brackish waters [20].
In the configuration shown in Figure 5.3, low salinity brackish water (TDS ~ 3000 mg/l) flows to the BWRO system, which produces 34 m3/h potable water when operating at about 75% recovery based on a feed water flow rate of 45 m3/h. In order to increase the yield, the reject (TDS ~ 12,000 mg/l) flows to the BRO unit at 11 m3/h. The product water flow rate from the two RO units is 40 m3/h, resulting in an overall recovery of 89%. The total energy consumption is 37 kW (Table 5.3). The integrated system SEC is 0.93 kWh/m3.
Process D – surface water membrane filtration
Semi-dead end UF/MF membranes (effective pore size of the membrane is ≤ 0.1 μm) with intermittent backwash are being increasingly used for surface water and wastewater treatment for re-use, e.g. secondary or tertiary effluent is treated for industrial, non-potable and, in some cases, potable water reuse using UF/RO (or MF/RO) plus advanced oxidation techniques such as UV disinfection and hydrogen peroxide. The process is described in detail in Chapters 2 and 4 and several examples discussed in Chapter 3. Prominent examples of advanced reclamation plants include Water Factory 21 in California, NEWater Factory in Singapore and the Goreangab Reclamation plant in Namibia [2].
Wastewater reclamation for reuse by membrane filtration is more attractive than SWRO desalination due to much lower energy consumption and materials costs. For example the cost for producing RO product water from secondary effluent and seawater is estimated to be $0.30/m3 and $0.70/m3, respectively [9].
Depending on the quality of feed water, e.g. surface water or low TDS groundwater, MF or UF is sufficient for producing reuse quality water without RO or UV disinfection [15]. The pMF + RO system product water flow rate is 34 m3/h at an overall recovery of 76% when the MF and RO recoveries are 95% and 80%, respectively (MF/UF system recoveries of up to 99% are achievable when the reject is also recycled to the feed water inlet [15]). The total energy consumption is 20 kW based on SEC of 0.15 kWh/m3 for the pMF/UF unit and 0.4 kWh/m3 for the RO unit (Table 5.3). The integrated system SEC is 0.59 kWh/m3.
Process E – biological wastewater membrane bioreactor treatment
The integrated MBR + RO wastewater system produces 32 m3/h reuse water with the MBR unit operating at 89% recovery and the RO unit operating at 80% recovery. The total energy consumption is 37 kW based on SEC of 0.5 kWh/m3 for the iMBR unit and 0.4 kWh/m3 for the RO unit (Table 5.3). The integrated system SEC is 1.16 kWh/m3.
The configuration couples an MBR unit with an RO unit for wastewater treatment. Biological degradation of organic pollutants is carried out in the bioreactor by adapted microorganisms, and the microorganisms (biomass) are removed from the treated wastewater or mixed liquor (activated sludge) with MF/UF membranes. Since the effective pore size of the membrane is < 0.1 μm, the MBR effluent is highly clarified and substantially disinfected [11]. For municipal wastewater treatment, MBRs are very attractive as compared to conventional treatment due to a small footprint and high effluent quality required for water reuse or as pre-treatment for RO or NF processes. Further, in recent pilot tests at NEWater Factory in Singapore, it has been shown that MBR + RO produces water with a slightly superior quality product water for industrial use and at lower cost than the existing MF + RO system for treatment of secondary sewage mainly because MBRs eliminate the need for secondary and/or tertiary filtration [2,11].
Process F – industrial wastewater cross-flow membrane treatment
For wastewater streams high in metals, hardness (> 800 mg/l as CaCO3) and/or silica (> 60 mg/l), softening is required prior to recovering water by RO for reuse. For such streams, softening pre-treatment followed by clarification and filtration is used. The basis for softening is as follows: while temporary hardness (calcium and magnesium hardness due to carbonate) can be controlled by acidifying RO feed water, permanent hardness (due to sulphate) is relatively independent of the pH. When calcium sulphate and silica limit RO recovery, lime or caustic softening is necessary to achieve higher recovery. Softening (pH = 10.5–11 lowers hardness to 50 mg/l) and removes calcium as CaCO3, whereas SiO2 is partially sorbed by Mg(OH)2 (Ksp = 1.2 × 10− 11 at 25°C) floc and removed by co-precipitation with magnesium. Related applications are discussed in Chapter 3.
One process sometimes used for low flow rates (< 50 m3/h) is lime or caustic soda softening followed by cross-flow microfiltration (XMF) and RO polishing [21]. The MF membrane (pore size < 0.2 μm) is tubular with a diameter of 1.27 or 2.54 cm. Due to the large diameter of the tubes, the membranes can handle feeds with solid levels of up to 5% at a very high membrane flux (375–500 lmh). The XMF filtrate is of high quality with turbidity < 0.1 NTU and SDI < 3.0.
In the process configuration shown in Figure 5.3, wastewater flows to a contact reactor at 22.5 m3/h. The supernatant from the concentration tank flows to the XMF membrane array and is recirculated at 225 m3/h and 3–4 bar g with 10–15% recovery per recirculation/pass until 85–95% of the feed is recovered. In cross-flow MF/UF systems, operation at high velocity (shear rate) minimises solute cake build-up on the membrane surface and controls fouling. Ideally, the system should be operated at the critical flux region to reduce fouling as discussed in Chapters 1 and 2. The MF filtrate pH is lowered with acid to ~ 6.0 before it flows to the RO unit at 20 m3/h. Because of the high quality of filtrate – turbidity < 0.1 NTU, SDI < 3.0, hardness < 50 ppm, silica < 20 ppm – the RO unit can operate at 85–90% recovery without fouling/scaling.
Thus, the XMF-RO integrated system recovers 75–85% of wastewater for reuse. The SEC of XMF is, however, much higher than semi dead-end membrane filtration processes (Table 5.2) because of very high cross-flow recirculation rates. The total energy consumption is 65 kW based on SEC of 3.0 kWh/m3 for the XMF unit and 0.3 kWh/m3 for the RO unit (Table 5.3). The integrated system SEC is 3.61 kWh/m3.
Process G – high-purity water
The water treatment system is designed to supply 16 m3/h high-purity water (HPW) to a pharmaceutical plant. Typical treatment steps follow the sequence given below, not all of which are shown in Figure 5.3:

Pre-treated RO feed water combines with RO reject recycled water and flows to the RO skid through a 5.0 μm pore size (nominal) cartridge filter. The single-pass RO unit is a three-stage (1:1:1) array designed to produce purified water at an overall recovery of ~ 80%. The TFC RO membrane average rejection is 98% and permeate conductivity is < 10.0 μS/cm. The permeate is polished in an EDI unit. The product water conductivity is < 1.0 μS/cm. EDI product water flows through a 0.2 μm (absolute) cartridge final filter to the point-of-use at 16 m3/h, and the reject flows back to the holding tank. The total energy consumption is 10 kW based on an SEC value of 0.4 kWh/m3 for the RO unit and 0.25 kWh/m3 for the EDI unit [22]. The integrated system SEC is 0.63 kWh/m3 (Table 5.3).
Process H1 – ultrapure water
The purified water system is designed to supply 16 m3/h ultrapure water (UPW) to a semiconductor plant. Typical treatment steps follow the sequence given below, not all of which are shown in Figure 5.3:

Dechlorinated and softened water flows to the RO skid via a 5.0 μm (nominal pore size) cartridge filter. The RO unit is a three-stage (2:1:1) array designed for 80% recovery. The permeate conductivity is < 10 μS/cm. The TOC level in the RO permeate can vary between 50 and 500 ppb. Irradiation with 185 nm UV light is very effective in oxidising residual organic matter (TOC), thereby reducing the organic load on anion resins in the EDI unit. RO product water flows through a 185-nm rated ultraviolet (UV) unit and is degasified in a membrane contactor (MC). The MC removes any traces of dissolved gases from water with nitrogen flowing in the permeate side as sweep gas. Degassed water flows to an EDI unit. The EDI product water conductivity is < 1.0 μS/cm. The EDI product water is polished in a mixed-bed ion exchanger (MBIX), producing UPW with resistivity = 18.2 MΩ-cm. The MBIX effluent flows through a bacteria-reducing 254 nm UV unit to deactivate bacteria and destroy any traces of organic matter. The irradiated water flows through MF cartridges rated for 0.04 μm (absolute) to the water distribution loop. The total energy consumption is 12 kW based on the SEC of 0.4 kWh/m3 for RO and 0.25 kWh/m3 for EDI (Table 5.3). The integrated system SEC is 0.75 kWh/m3.
Process H2 – power plant water
Process H2 is an alternate to H1 for producing high-purity water for power plants with resistivity = 16.0 MΩ-cm. The energy consumption is slightly higher (Table 5.3), but the process is simpler as shown below. The RO system is two-pass; second-pass RO replaces EDI.

The illustrative examples summarise conceptual design and application of integrated membrane plants based on simple assumptions and typical performance data. The overall SEC of the two-pass SWRO system (Process B) was the highest while the SEC of the membrane filtration-RO integrated system (Process D) was the lowest with high-purity water systems (Process G and H) close behind. The cross-flow MF-RO system (Process F) was more energy intensive than single-pass SWRO, which is not unexpected because of the energy expended in recirculating the reject stream at very high flow rates, i.e. high shear rate to minimise cake build-up on the membrane surface. Because of high energy consumption, high Capex and a large footprint – low surface area tubular membranes – cross-flow MF systems are only used in limited wastewater treatment applications.
5.2.2 Temperature effect on energy consumption and membrane performance
Membrane productivity increases with feed water temperature albeit at a slight penalty in product water quality. A rule of thumb is that permeate flow rate increases 3% per °C rise in temperature as a result of reduced viscosity, e.g. the product water of a 100,000 m3/day desalination plant is 39% at 20°C and 43% at 28°C. Higher productivity, in turn, means fewer membrane elements to achieve the same product water flow rate, resulting in reduced Capex and Opex. Design and performance of SWRO and BWRO systems operating at 20 and 30°C is detailed below. For general details of membrane systems design refer to Section 2.4.
SWRO design
The seawater RO unit design was based on the following assumptions [8]:
• Feed water flow rate = 45 m3/h
• Feed water TDS = 34,262 mg/l
• Feed water temperature = 20 and 30°C
• Thin-film composite RO membrane; membrane life = 3 years
• PWR = 35%, 40%, 45% and 50%
• Product water flux constant for each temperature sub-set
• Pelton Wheel energy recovery turbine
The SWRO unit was modelled using Hydranautics Membrane Solutions Design software, version 8.8 (2004), based on a known seawater water analysis. The optimal spiral-wound membrane element was SWC5, which is one of the lowest energy consumption RO membrane elements for seawater. The design data are presented in Table 5.4. In all cases, the SWRO unit was a single-pass, single-stage membrane array (6:0; 7:0; 8:0), i.e. six, seven and eight parallel pressure vessels, similar to the one shown in Figure 3.33. Each pressure vessel contained six membrane elements. The RO pump, motor, and energy recovery turbine efficiency was assumed to be 80%, 90% and 88%, respectively.
Table 5.4
Seawater RO unit design parameters
| Case | Membrane typea/membrane arrayb | Feed temp. (°C) | Feed pressure (bar g) | Reject/brine pressure (bar g) | Product flow (m3/h) | PWRc (%) | Avg. flux. (l/m2/h) | Product TDSd (mg/l) | RO pump power (kW), (1) | Energy recov. (kW), (2) | Energy recov. (%) | RO motor energy (kW), (1) − (2) | Specific energy (kWh/m3) |
| A | SWC5 6:0 | 20 | 47.1 | 44.4 | 15.9 | 35 | 11.9 | 183 | 73.6 | 31.6 | 42.9 | 42 | 2.94 |
| B | SWC5 6:0 | 30 | 44.3 | 43 | 15.9 | 35 | 11.9 | 250 | 69.2 | 30.2 | 43.6 | 39 | 2.73 |
| C | SWC5 7:0 | 20 | 49.3 | 46.7 | 18.2 | 40 | 11.7 | 199 | 77 | 30.6 | 39.7 | 46.4 | 2.83 |
| D | SWC5 7:0 | 30 | 46.8 | 45.6 | 18.3 | 40 | 11.7 | 274 | 73.1 | 30.1 | 41.1 | 43 | 2.63 |
| E | SWC5 7:0 | 20 | 54 | 51.1 | 20.5 | 45 | 13.1 | 190 | 84.4 | 30.6 | 36.2 | 53.8 | 2.92 |
| F | SWC5 7:0 | 30 | 50.9 | 49.6 | 20.5 | 45 | 13.1 | 262 | 79.5 | 30.1 | 37.9 | 49.4 | 2.68 |
| G | SWC5 8:0 | 20 | 57.6 | 54.7 | 22.5 | 50 | 12.7 | 213 | 90 | 30.1 | 33.4 | 59.9 | 2.96 |
| H | SWC5 8:0 | 30 | 54.7 | 53.5 | 22.5 | 50 | 12.7 | 295 | 85.5 | 29.8 | 34.9 | 55.7 | 2.75 |
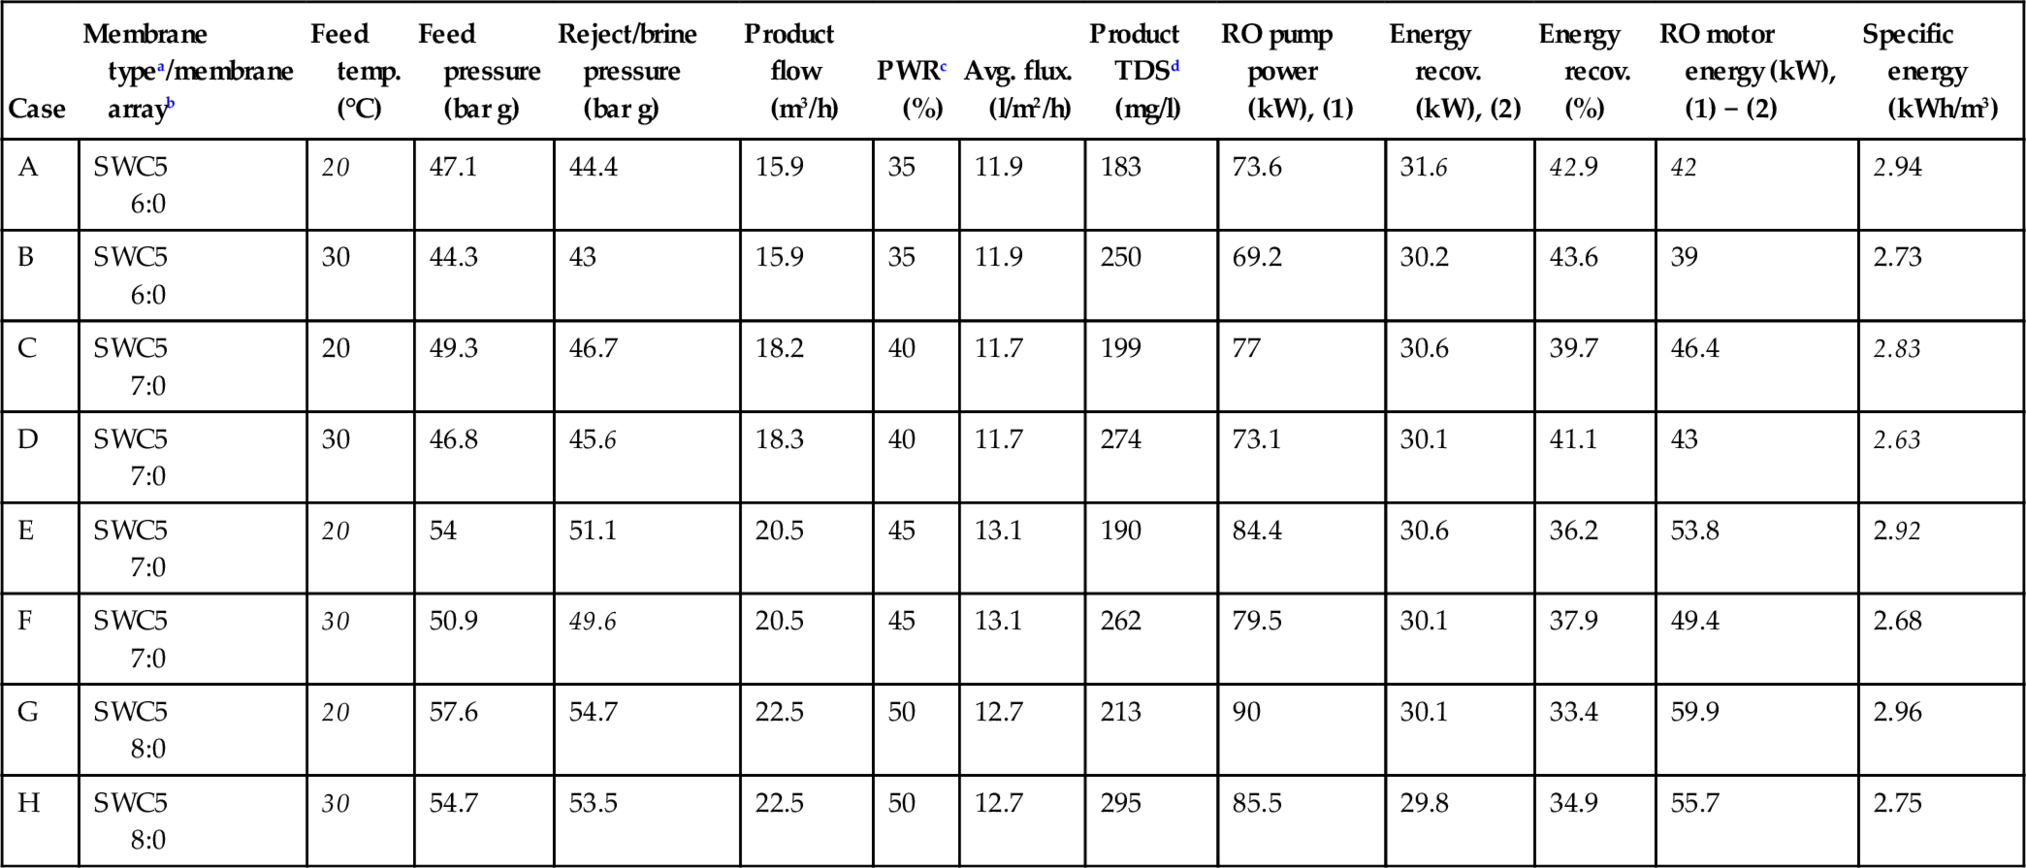
Notes: Feed water flow rate = 45 m3/h. Feed water TDS = 34,252 mg/l. Reject/brine osmotic pressure range = 38 (A) – 51 (H) bar. RO pump η = 80%. RO pump motor η = 90%. Energy recovery turbine η = 88%. Calculated specific energy for the SWRO unit only. Source: Singh [8].
a Hydranautics TFC membrane rating: 30.3 m3/day at 99.8% rejection. Membrane element surface area: 37.16 m2.
b One-stage array. Six spiral-wound modules/vessel.
c Product water recovery.
d Total dissolved solids.
The product water TDS increased with PWR due to higher concentration polarisation. There was a slight drop in TDS at 45% recovery possibly due to a slight increase in flux. The increase in product water TDS was nearly 38% when the feed water temperature increased from 20 to 30°C. The product water quality decreases slightly with rise in temperature due to higher osmotic pressure and because solute (ions) flow through the membrane has a higher activation energy than water flow (see Chapter 1).
The feed pressure and net energy required dropped by 6–7% while maintaining the same product water flux when the feed water temperature increased from 20 to 30°C. The feed pressure increased with recovery due to higher energy required to pump water through larger arrays, e.g. the number of pressure vessels increased from six at 35% recovery to eight at 50% recovery. The SEC for the RO unit varied between 2.63 and 2.96 kWh/m3. For SWRO plants, energy is 70–80% of total plant energy consumed [3,4,9]. Assuming a value of 75%, the plant SEC was in the range of 3.51–3.95 kWh/m3. The SEC was minimum for Case D when the recovery was 40% at 30°C. The optimum operating point most likely is between 40% and 45% recovery. Further, the efficiency of the Pelton Wheel energy recovery device used in the analysis is 88%. The SEC value would be slightly lower with more efficient isobaric ERD (η = 95%) [4,23].
BWRO design
The brackish water RO unit was based on the following assumptions [8]:
• Feed water flow rate = 45 m3/h
• Feed water TDS = 1656 and 3674 mg/l
• Feed water temperature = 20 and 30°C
• Thin-film composite RO membranes; membrane life = 3 years
• PWR = 70 and 75%
• Product water flux constant for each temperature sub-set
• No energy recovery device
• No brine recovery RO unit
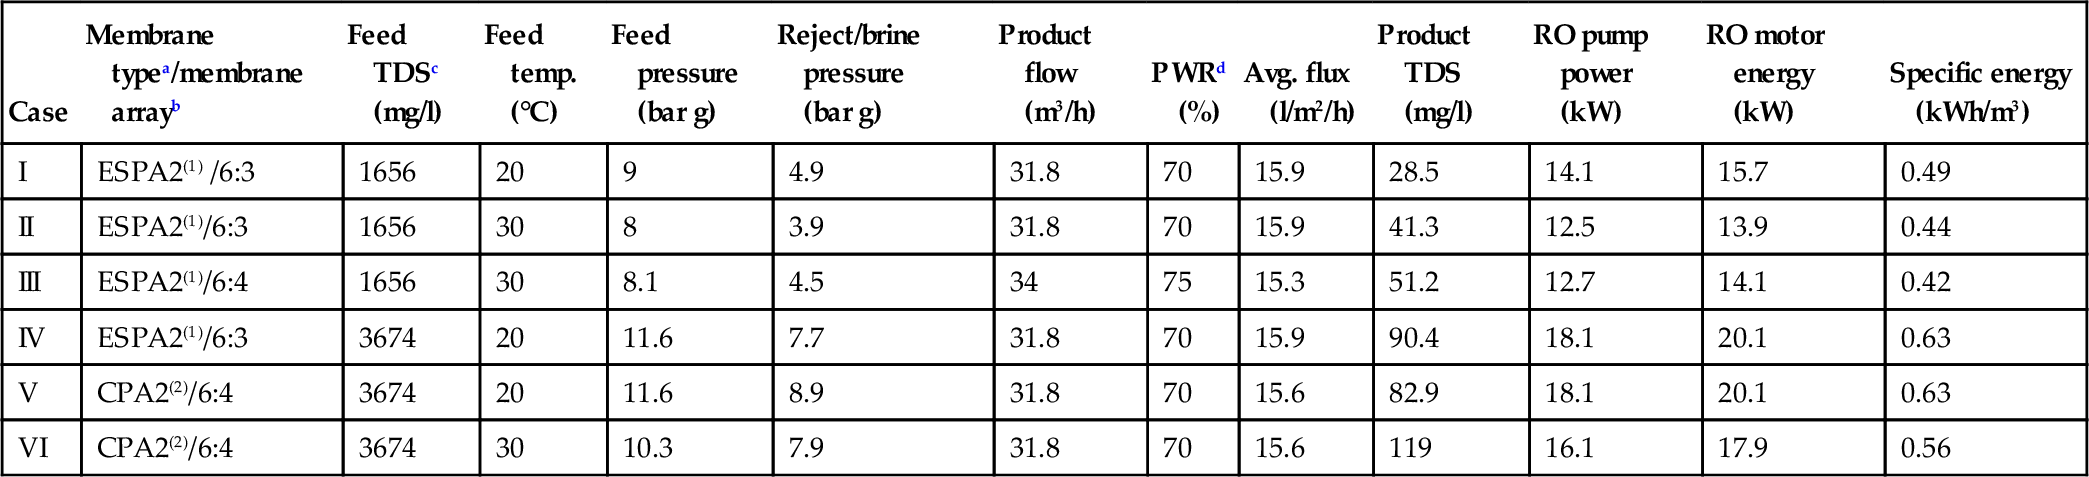
As in the case of SWRO, the BWRO unit was modelled using Hydranautics Membrane Solutions Design Software, version 8.8 (2004), based on a known brackish water analysis. The optimal spiral-wound membrane elements were ESPA2 (energy-saving polyamide) and CPA2 (standard pressure polyamide). The design data are presented in Table 5.5. In all cases, the BWRO unit was a single-pass, two-stage membrane array (6:3 or 6:4). The RO pump and motor efficiencies were assumed to be 80% and 90%, respectively.
Table 5.5
Brackish water RO unit design parameters
| Case | Membrane typea/membrane arrayb | Feed TDSc (mg/l) | Feed temp. (°C) | Feed pressure (bar g) | Reject/brine pressure (bar g) | Product flow (m3/h) | PWRd (%) | Avg. flux (l/m2/h) | Product TDS (mg/l) | RO pump power (kW) | RO motor energy (kW) | Specific energy (kWh/m3) |
| I | ESPA2(1) /6:3 | 1656 | 20 | 9 | 4.9 | 31.8 | 70 | 15.9 | 28.5 | 14.1 | 15.7 | 0.49 |
| II | ESPA2(1)/6:3 | 1656 | 30 | 8 | 3.9 | 31.8 | 70 | 15.9 | 41.3 | 12.5 | 13.9 | 0.44 |
| III | ESPA2(1)/6:4 | 1656 | 30 | 8.1 | 4.5 | 34 | 75 | 15.3 | 51.2 | 12.7 | 14.1 | 0.42 |
| IV | ESPA2(1)/6:3 | 3674 | 20 | 11.6 | 7.7 | 31.8 | 70 | 15.9 | 90.4 | 18.1 | 20.1 | 0.63 |
| V | CPA2(2)/6:4 | 3674 | 20 | 11.6 | 8.9 | 31.8 | 70 | 15.6 | 82.9 | 18.1 | 20.1 | 0.63 |
| VI | CPA2(2)/6:4 | 3674 | 30 | 10.3 | 7.9 | 31.8 | 70 | 15.6 | 119 | 16.1 | 17.9 | 0.56 |
Source: [8].
Notes: Feed water flow rate = 45 m3/h. Reject/brine osmotic pressure range = 3.1 (I)–7 (VI) bar. RO pump η = 80%. RO pump motor η = 90%. Calculated specific energy for the BWRO unit only.
a Hydranautics TFC membrane rating: (1) 34.1 m3/day at 99.6% rejection; (2) 37.9 m3/day at 99.7% rejection.
b Two-stage array. Six spiral-wound modules/vessel.
c Total dissolved solids.
d Product water recovery.
The product water TDS increased with PWR due to higher concentration polarisation. The increase in product water TDS was nearly 44% when the feed water temperature increased from 20 to 30°C. The feed pressure and net energy required dropped by 8–11% with an increase in feed water temperature while maintaining the same product water flux. The higher gain in pressure drop in the case of BWRO as compared to SWRO is a result of lower osmotic pressure in the brine reject stream. The SEC for the RO unit was lowest = 0.42 kWh/m3 for lower TDS brackish water (Case III) and lowest = 0.56 kWh/m3 for higher TDS brackish water (Case VI). For BWRO plants, energy is 40–50% of total plant energy consumed [3,4]. Assuming a figure of 45%, the plant SEC was 0.93 and 1.24 kWh/m3 for Cases III and VI, respectively.
Post-analysis
The analyses showed that raising the RO feed water temperature from 20 to 30°C reduced the RO plant energy usage by 7–11%. Reduction in the cost of energy through such several incremental innovative design and operation techniques is possible [5]. However, for operation at higher temperature to be meaningful, a source of waste heat is required [8]. Co-location of SWRO plants with conventional power plants for utilising power plant waste heat is one option – the cooling water is used as the SWRO plant feed water [4]. Warmer temperature results in reduced RO feed pressure and concomitant power cost savings. Increase in permeate flux of up to 60% was reported when feed water temperature was increased from 20 to 40°C possibly due to changes in membrane morphology and higher solvent flow [24]. However, at greater than 30°C range, higher membrane permeability is adversely affected by increased osmotic pressure and higher salt passage [25].
The data show that the energy consumption of the SWRO units was about five times higher than the BWRO units, which is consistent with other reported data [3]. This is further evident from the data in Table 5.6.
Table 5.6
RO system specification and estimated cost data for typical select cases
| Case | Feed water flow rate (m3/day) | Feed water TDS (ppm) | RO system | Feed pressure (bar g) | Product water flow rate (m3/day) | Product water recovery (%) | Case | RO Product water TDS (ppm) | Brine concentrate TDS (ppm), flow rate (m3/day) | RO unit energy consumption (kWh/m3)a | Capex ($) | Opex ($/m3)a | Comments |
| I | 1637 | 2500 | Primary RO: two-stage 7:4 array; 66 membrane elements | Primary RO = 14 | Primary RO = 1310 | Primary RO = 80 | I | Primary RO = 133 | TDS = 23,930, flow rate = 164 | Primary RO = 0.61 | 0.55 M | 0.724 | • Mid-level TDS brackish water |
| Brine RO: single-stage 2:0 array; 12 membrane elements | Brine RO = 19 | Brine RO = 163 Total = 1473 | Brine RO = 50 Overall = 90% | Brine RO = 568 Combined = 181 | Brine RO = 1.36 | • Brine RO for high recovery | |||||||
| II | 1992 | 7200 | Primary RO: two-stage 8:4 array; 72 membrane elements | Primary RO = 24 | Primary RO = 1495 | Primary RO = 75 | II | Primary RO = 336 | TDS = 68,821, flow rate = 202 | Primary RO = 1.13 | 0.75 M | 1.147 | • High TDS brackish water. Primary RO and brine RO. |
| Brine RO: single-stage 4:0 array; 24 membrane elements | Brine RO = 55 w/ reject recycle | Brine RO = 295 | Brine RO = 60 | Brine RO = 522 | Brine RO = 4.13 | • Higher BRO pressure | |||||||
| Total = 1790 | Overall = 90% | Combined = 367 | • Brine RO membrane: seawater | ||||||||||
| III | 2180 | 23,000 | Two-stage SWRO 7:4 array; 66 membrane elements | 72 | 1526 | 70 | III | 125 | TDS = 76,511, flow rate = 654 | 3.76 | 0.88 M | 1 | • Brackish-seawater mix feed water |
| IV | 10,360 | 40,200 | Single-stage SWRO 58:0 array; 348 membrane elements | 66 | 5180 | 50 | IV | 465 | TDS = 79,870, flow rate = 5180 | 4.79 | 4.0 M | 1.124 | • Seawater RO. Utilises energy recovery (ER) device. 50% product water recovery is higher than normal. |
| V | 10,360 | 40,200 | Single-stage SWRO 63:0 array; 378 membrane elements | 79 | 6216 | 60 | V | 535 | TDS = 99,720, flow rate = 4144 | 4.89 | 4.5 M | 0.96 | • Utilises energy recovery (ER) device. Higher recovery and feed pressure than Case IV. 60% product water recovery is extremely high, hence high energy consumption. |

a Product basis.
5.2.3 Capital and operating costs assessment
Water desalination costs
There is a broad variation in the cost of water produced by membrane processes due to the type of feed water, plant size and energy source. For example, the cost of SWRO desalted water is reported to be in the range of $0.53–$1.53/m3 [3], $0.525–$0.75/m3 [4,9], and $0.75–$1.25/m3 [26]. The cost of BWRO desalted water in the 1978 dollars was in the range of $0.33–$0.47/m3 [27]. It was in the range of $0.1–$1.00/m3 in 2007 dollars [3]. Both the source and salinity of brackish water are highly variable, unlike seawater. Also, the cost of brine concentrate disposal can be considerable for inland brackish water desalting plants today, which was not a serious issue in the 1970s. The O&M costs are also strongly affected by the price of electricity.
The capital cost of a seawater RO unit is between $600 and $800/m3/day while for brackish water RO unit it is between $250 and $400/m3/day [3]. The capital costs of entire seawater plants are five times higher than brackish water plants partly due to a more extensive pre-treatment system required as well as larger pumping and piping required to move larger volumes of feed water and RO concentrate (because of lower RO PWR). The capital cost of reclaim water membrane plants is typically one-half of seawater RO plants [9]. Typical breakdown of operating costs of SWRO plants by components is as follows [3,4]:
• Fixed costs, 36%
• Maintenance and spare parts, 6%
• Membrane replacement, 5%
• Labour, 4%
• Chemicals, 3%
Typical breakdown of operating costs of BWRO plants by components is as follows [3,27]:
• Fixed costs, 54%
• Maintenance and spare parts, 9%
• Membrane replacement, 7%
• Labour, 9%
• Chemicals, 10%
RO design for cost analyses
Capex and Opex of RO systems with feed water TDS from 2500 to 40,200 ppm and flow rates from 1640 to 10,360 m3/day were analysed for performance, capital and operating costs. The data are summarised in Table 5.6. The RO unit designs were modelled using Hydranautics Membrane Solutions Design software, version v. 2010. Pre-treatment included sodium hypochlorite dosing, multimedia filtration, carbon filtration and/or sodium bisulphate dosage, ion-exchange softening or anti-scalant dosing for scale control (see Table 5.1). RO feed water turbidity was < 0.2 and Silt Density Index ≤ 4. Membrane life was assumed to be 3 years. The primary RO skid included a 5.0 μm cartridge filter. The high-pressure RO pumps were multi-staged. An energy recovery device was a part of SWRO. All high-pressure piping was 316 L SS except duplex steel was used in Cases IV and V.
Cases I and II are based on “high recovery” brackish water RO, i.e. primary RO + brine RO (PRO + BRO). Cases III covers intermediate TDS (23,000 ppm) water. Cases IV and V are based on SWRO.
Desalination – Capex and Opex calculation basis
Capex:
• $250–400/m3/day for brackish water RO
• $600–1200/m3/day for seawater water RO
Opex:
• BWRO energy consumption ~ 1.0 kWh/m3 product
• SWRO energy consumption ~ 3.8 kWh/m3product
• Energy cost ~ $0.111/m3 (based on a typical energy cost of $0.12/kWh)
• Long-term spares/consumables/membrane replacement/maintenance/labour ~ $0.137/m3
• Installation: 15% of equipment cost ex-works
Primary RO (PRO) Opex basis ($/m3):
• Labor at $280/day (8-h shift). Labour cost doubled for Cases IV and V
• Chemicals = $0.033/m3
• Membrane replacement = $0.01/m3
• Miscellaneous = $0.077/m3
• Energy = $0.12/kWh
Brine RO (BRO) Opex basis ($/m3):
• Chemicals = $0.033/m3
• Membrane replacement = $0.01/m3
• Miscellaneous = $0.077/m3
• Energy = $0.12/kWh
RO cost calculation equation:
![]()
In summary, the data presented in Table 5.6 provide an overview of general cost estimates of RO modelled systems. In desalination, costs are sometimes difficult to compare across projects because they are rarely reported consistently and some cost parameters are often not reported. Further, project costs can vary significantly especially for water desalination, depending upon factors such as source water quality, plant size, cost and availability of power, project financing terms, permitting requirements, distribution lines, and brine concentrate or waste sludge disposal/transportation [3,26–28].
UF/MF water treatment cost figures
The design of a membrane filtration water treatment plant requires a clear selection of flux in order to achieve a stable cost-effective design to ensure that fouling can be controlled at an acceptable level [29]. Flux data and specifications for various MF/UF systems are provided in Table 3.13. The cost of reclaimed water from secondary and wastewater using integrated membrane systems (MF/UF + RO/NF) is in the range of $0.25–$0.40/m3 [9,28]. According to another study, the Capex for full-scale MF systems as pre-treatment for RO units in wastewater reclamation was $140–215/m3/day for a 10,000 m3/day plant with Opex approximately $0.10/m3 [30]. Process design of a cross-flow tubular UF plant for treating industrial wastewater was discussed in Chapter 2. Specifications for a tubular UF system are given in Table 2.12.
In one case study on seawater desalination in the Mediterranean Sea, the total cost of conventional pre-treatment SWRO system and membrane pre-treatment SWRO system was about the same, $0.90/m3 [3]. Even though membrane filtration pre-treatment is more expensive than conventional treatment, potential savings were a result of: (i) RO permeate flux increase of 25%, (ii) footprint and RO membrane replacement costs decrease of 33%, and (iii) chemical costs decrease of 45–65%.
5.2.4 Electrodialysis energy consumption and costs
Electrodialysis (ED) is mainly used for brackish water desalting and wastewater treatment with feed salinity less than 5000 mg/l. It is typically not used for desalting seawater because of high energy consumption. The theoretical energy consumption for normal seawater desalination is 1.05 kWh/m3, but the actual energy consumption range is 10–25 kWh/m3. For brackish water desalination (2000–10,000 mg/l) the theoretical energy consumption range is 0.05–0.33 kWh/m3, but the actual energy consumption is 0.4–4 kWh/m3 [31]. Based on the relative specific cost vs. salt concentration the economic cut-off point for ED vis-à-vis RO lies between 3500 and 7000 mg/l [32,33].
Energy consumption is strongly affected by salt concentration and cell voltage, Vcell. For example, the SEC at Vcell = 0.4 V and 1000 mg/l salt concentration is 0.18 kWh/m3 and 0.8 kWh/m3 at 4000 mg/l salt concentration. The relationship is linear. At Vcell = 0.2 V and 1000 mg/l salt concentration, SEC is 0.15 kWh/m3 and increases linearly to 0.45 kWh/m3 at 4000 mg/l salt concentration. However, operation at low cell voltages results in increase in capital investment [34]. A large fraction of total power is consumed by the pumps required to circulate feed and concentrate solutions through the stacks (see Figure 2.35). The pumping energy is estimated to be 0.5 kWh/m3 [35]. Nearly complete de-gassing of water substantially increases its electrical conductivity. This suggests that the use of de-gassed salt solution could increase the overall efficiency of the ED process by increasing the electrical conductivity of the ion depletion layers within the ED stack [7], especially in the case of dilute electrolyte solutions.
Even though RO is the dominant process for brackish water desalination as compared to ED, EDR is preferred to RO in certain applications [33]. Several examples where EDR was the preferred process are discussed below (see also Chapter 3):
1. The city of Suffolk in Virginia, USA deployed EDR instead of RO for treating well water with TDS ~ 700 mg/l. Both RO and ED are suitable for reducing high level of fluoride, 4.6 mg/l (4.0 mg/l max.) and reducing sodium to 50 mg/l for potable water. However, EDR was selected because the volume of brine concentrate discharge was an important consideration [36]. ED had a higher PWR, 94% vs. 85% for RO. For a plant size of 14,240 m3/day, the brine concentrate from the RO plant would have been 2136 m3/day vs. 855 m3/day for ED, i.e. 2.5 times more volume in the case of RO plant.
The ED plant consists of three units (GE/Ionics Aquamite 120) each rated for 4747 m3/day product water. Each unit contains eight parallel lines of membrane stacks with each line consisting of stacks in series. Three stages are required to reduce the fluoride level to 1.4 mg/l. The product water cost is $0.25/m3 based on the following costs: fixed = $0.132/m3, chemicals = $0.02/m3, EDR stack replacement = $0.23/m3, utilities = $0.21/m3 (at $0.05/kWh), maintenance = $0.17/m3, and professional services = $0.06/m3 [34].
2. EDR was selected over RO to treat river water in Barcelona, Spain (TDS = 2000 mg/l) containing high levels of bromide, which along with the dissolved organic matter, creates a precursor for chlorination disinfection byproducts called trihalomethanes (THMs). The Capex of the 200,000 m3/day EDR system and including a pre-treatment system was $79 M. The SEC was 0.8 kWh/m3 and the Opex was ~ $0.26/m3. The EDR system consists of nine modules of 32 lines and two stages. Six hundred cell pairs are assembled horizontally and in parallel between two electrodes. The PWR is 90% with salt reduction 60–80%. The system reduces bromides by 80% and achieves a THM formation potential of < 100 μg/l [34,36].
3. An EDR plant was installed for the treatment and reuse of tertiary water (TDS = 1250 mg/l) in San Diego, CA. The reclaimed water was needed for irrigation purposes. EDR was selected since its cost was 25% lower than MF-RO and it consumed less energy [37]. The pumping power consumption was ~ 0.264 kWh/m3 and the DC power requirement was 0.362 kWh/m3 at 55% salt rejection. The EDR plant consistently produced 347 m3/h at the product water TDS between 355 and 664 mg/l. The EDR system was designed for 85% water recovery without chemical treatment, whereas the RO system required acid dosing and a scale inhibitor to achieve the same recovery. In addition, the EDR stack tolerated continuous exposure to 0.5 ppm residual chlorine.
These examples show that for certain applications and feed waters (TDS = 700–2000 mg/l), EDR is superior to RO.
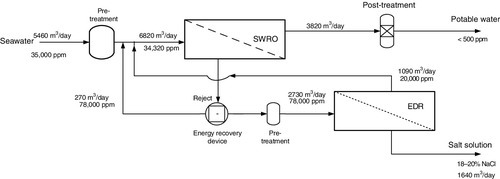
High salinity feed waters
An ED-RO integrated system for treating high salinity waters is shown in Figure 5.4. Scaling by sparingly soluble salts is controlled by pre-treatment and the ED reversal system (EDR) [33]. EDR uses a polarity reversal feature to prevent the accumulation of organic and inorganic foulants and prevent scaling, as discussed in Chapters 1 and 3. The SEC for concentrating RO reject (TDS ~ 70,000 mg/l) with ED to 200,000 mg/l is estimated to be 18.8 kWh/m3 (30% for pumping) with Vcell > 0.22 and current efficiency = 90%.
5.2.5 Energy-saving options
The efficiency of seawater desalination plants is low, 10–25% as compared with the efficiency of other major industrial plants [7]. For example, the efficiency of cogeneration power generating plants is 50%. The efficiency of small desalination plants such as used on ships is in the low range. The energy consumption of the wind-powered 140,000 m3/day SWRO plant in Perth is 3.56 kWh/m3 [38]. Using the same feed and outlet conditions, the minimum work consumed is 0.951 kWh/m3. Hence, the second law efficiency of the plant is about 26.7% [7]. The SWRO plant efficiency would increase if the plant energy consumption of 2.2 kWh/m3 is achieved [5]. Alternate SWRO plant and system designs and membrane array configurations that enhance performance and reduce product water costs are discussed in Chapter 3.
Membrane fouling problems in RO were addressed early in the 1970s and largely solved by site-specific feed water treatment systems [39,40]. Modifications to pre-treatment and post-treatment designs are, however, deemed necessary for reducing both energy consumption and total costs especially for seawater RO desalination [5]. A novel solution suggested for decreasing the energy consumption of and cost of seawater desalination involves forward osmosis (FO) integrated with RO. In this process, investigated in the laboratory, both pre-treatment and post-treatment operations would be minimised [41]. However, for the process to be viable, development of fouling-resistant FO membranes and improved module designs are required.
Seawater pre-treatment costs may be reduced by 15–25% with new kinds of filtration intakes [4,42]. One such design is a seabed filter intake that uses screened laterals (a non-metallic header-lateral arrangement with 0.6 m diameter laterals attached to two 1.8 m diameter headers) [43]. The intake pipes are installed about 3.9 m below the seabed, under 1.5 m of graded sand, 0.3 m of graded gravel and 2.1 m of coarse gravel.
Raising the RO feed water temperature from 20 to 30°C reduces the plant energy usage by ~ 10%. Overall costs could also be decreased if the brine concentrates are processed to recover valuable products. A few such cases are discussed in Chapter 3. Deployment of high recovery brackish water RO systems, i.e. a primary RO (PRO) plus a brine recovery RO (BRO) increases the overall PWR from 70–75% to 85–90%. A 10% reduction in energy consumption is achievable when the BRO unit is replaced by a NF unit [44]. The NF feed pressure is about 30% lower than the BRO feed pressure.
Besides energy consumption, the resulting greenhouse gas emissions are significant factors in the operation of membrane desalination plants [5,7]. Renewable energy sources such as wind power and solar energy have been successfully integrated with RO desalination plants of small to large capacity in the last decade to lower energy costs, e.g. the wind-powered 140,000 m3/day SWRO plant in Perth mentioned earlier [38].
Another option to reduce SWRO energy consumption is to use diluted seawater. For example, the London desalination plant shown in Figure 5.5 draws water from the Thames River estuary during the last 3 h of the ebb tide. The feed water TDS is less than half of normal seawater. The $400 M plant commissioned in 2010 has a capacity of 150,000 m3/day, enough to supply 400,000 households, and operates on 100% renewable energy with a water recovery > 75% [45].
The seawater could also be diluted with sewage reclaimed water. In this scheme, RO reject from an integrated MBR-RO system is used to dilute SWRO feed [46]. At a demonstration plant in Kitakyushu, Japan, the RO feed pressure was reduced by more than 30% from 55 to 35 bar g. Based on the actual data, energy‐saving efficiency for the total system was estimated to be 32%; the proposed system reduces energy consumption from 4.3 to 2.9 kWh/m3.
Membrane cleaning is a regular feature of membrane plants operation and maintenance. Frequent cleaning cycles with chemicals, however, have an adverse impact on membrane life and operating costs. Osmotic backwash based on FO for cleaning RO/NF membranes has been investigated to increase plant efficiency [14]. FO is a promising seawater desalination process described in Chapter 1 [5]. The basis of FO is osmosis, a natural and spontaneously occurring process. Thin-film composite membranes cannot be backwashed because the top thin layer can get detached. However, since FO transfers pure or fresh water through an RO/NF membrane under osmotic pressure, it can be used to backwash and clean the membrane with the permeate without the risk of damaging the membrane. Thus, operating costs of RO/NF plants can be reduced. The osmotic backwash process is described in Chapter 1.
ED for treating low TDS brackish waters and industrial waters is a proven and cost-effective technology, and in some applications superior to RO and NF [33,34,37]. Integrated RO/EDR, NF/EDR [47] and RO-ZDD [48] systems can reduce the cost of treated water by achieving higher recovery, e.g. in the case of inland brackish water desalination, higher total recovery results in minimising brine concentrate volume for disposal (see Chapter 3).