Appendix: Engineering Data and Notes
Abstract: The chapter discusses topics that are either not covered in detail or not covered in Chapters 1–5. It details design calculations, properties of water treatment chemicals and equipment, and data tables and charts relevant to membrane systems and applications. It is a valuable source of a large amount of information and provides useful reference material. Topics covered include RO membrane chlorination, fluid flow in microporous membranes, surfactant-based separations, wastewater treatment, RO desalination plants, ion exchangers, water analysis, mathematical modeling, pumps, control valves, materials of construction, definitions, engineering units and conversion factors.
Keywords: Membrane permeation, Chlorination, Microporous membranes, UF separations, Ion exchange, Desalination, Water analysis, Pumps, Control valves, Materials of construction
“Anyone who believes that exponential growth in a finite world can go on forever is either a madman or an economist.”
— (Economist) Kenneth Boulding
6.1 Glossary/Terminology
Activation energy Energy barrier that the reactants must overcome in order react. It is the energy difference between the reactants and the activated complex.
Absorption It involves the dissolution (partitioning) of a contaminant from one phase into another without chemical reaction, e.g. absorption of oxygen gas in water or the absorption of DDT in hexane, an organic solvent.
Acidity, water All waters – natural, domestic wastewater and also frequently industrial wastewater – with pH less than 8.5 contain acidity. Acidity in natural waters is caused mainly by dissolved carbon dioxide that produces a weak acid, carbonic acid. Natural waters are buffered by a CO2–bicarbonate system. See carbon dioxide.
Activated diffusion The process by which a penetrant molecule moves through a membrane from one transient vacancy to another with an energy interaction between the penetrant and the membrane.
Adsorption The process by which ions or molecules present in one phase condense and concentrate on the surface of another phase (surface phenomena), e.g. adhesion of the molecules of gases, dissolved substances, or liquids to the surfaces of solids or liquids with which they are in contact. There are three general types of adsorption: physical (activated carbon), chemical and exchange (ion exchange).
Aeration Air introduced into water and/or to release dissolved gases from water.
Aerobic Conditions where oxygen acts as electron donor for biochemical reactions.
Agglomerate To gather fine particulate matter together into a larger mass.
Algae Primitive autotrophic plant-like single-cell organisms. Use sunlight and photosynthesis to grow.
Alkalinity A measure of the buffer capacity to resist drop in pH when acid is added, i.e. it is the measure of the chemical constituents of water that react with hydrogen ions, and thus resist a decrease in pH. The major portion of alkalinity is due to hydroxide, carbonate and bicarbonate. Other contributors include salts of weak acids such as borates, silicates, phosphates, and organic acids such as humic acid. Alkanitiy can be expressed as “M” alk. to a methyl orange titration end point (pH 4.2) or “P” alk. to a phenolphthalein end point (pH ≥ 8.2).
Amphoteric Compounds such as amino acids that form salts with acids or bases. The hydroxides of aluminium, zinc, chromium and a few other elements are soluble in both acid and bases. Hence used to accomplish separations in water treatment.
Anaerobic Conditions where biochemical reactions take place in the absence of oxygen.
Anion A negatively charged ion resulting from the dissociation of a salt, acid, or an alkali in an aqueous solution.
Anion-exchange membrane Membrane containing a fixed positive polar group that will permit passage of anions and reject cations.
Anisotropic (asymmetric) Defines a particular type of ultrastructure of microporous membranes. The surface of the membrane where separation occurs is more dense than the rest of the membrane body. The pore diameter increases in a direction perpendicular to the membrane surface, with the pore opening near the separation surface being smaller than the pore opening on the bottom of the membrane. This “skin” layer is typically present in polymeric membranes made by the phase-inversion process. Some asymmetry is also present in many inorganic membranes.
Anoxic Conditions where some species other than oxygen act as the electron donor for biochemical reactions.
Aqueous chemistry Also called solution chemistry, aquatic chemistry, water chemistry, electrolyte chemistry – any chemical system that involves water and dissolved salts.
ATD (anti-telescoping device) A circular ring with spokes fitted to the ends of a spiral module to prevent the membrane from pushing itself outward under a high-pressure drop.
Autofiltration The formation of a secondary or a dynamic membrane by retention of solutes or particles on the membrane surface affects separation or fractionation in UF. The higher the pressure, the more severe the polarisation.
Autotrophic Microorganisms that do not need to use organic matter as a source of energy.
Attrition Breakage or wear of ion-exchange resins.
Back-pressure Pressure exerted against flow.
Backwash Reverse (upward) flow of water through a packed bed to remove foreign material from the bed and clean and expand the bed.
Backpulse Brief reversal of flow from permeate to feed side of the membrane.
Base The hydroxyl form of a cation or a compound that can neutralise an acid.
Bicarbonate alkalinity The bicarbonate ion concentration expressed in “ppm” as CaCO3 equivalents. To convert ppm of bicarbonate to ppm of CaCO3 equivalents multiply by 0.82.
Biological treatment (biotreatment) Process whereby dissolved organic chemical constituents are removed through biodegradation.
Biomass Viable (living) microorganisms used to achieve removal of organics through biotreatment.
Biomimetic membrane A potential synthetic membrane under development incorporating aquaporins (proteins functioning as water-selective channels in biological cell membranes) that results in superior water transport efficiency than conventional RO membranes.
Bioreactor A vessel for conducting biological reactions.
Bipolar membrane The membrane consists of an anionic membrane and a cationic membrane laminated together. The membrane is used for generation of hydroxyl and hydrogen ions by water splitting. Used to split sodium chloride into sodium hydroxide and hydrochloric acid.
BOD (biochemical oxygen demand) A measure of the amount of oxygen required to support growth of bacteria during the breakdown of organic compounds in a sample. Usually expressed in parts per million (ppm). It is a bioassay procedure that involves the measurement of oxygen consumed by living organisms (mainly bacteria) while utilising the organic matter present in waste under conditions that simulate natural conditions.
Boundary layer The region near a sold surface where fluid motion is affected by the surface. The boundary layer is a major resistance to transport (e.g. by heat, mass, or momentum). In order to improve transport, the thickness of this boundary layer must be reduced.
Brackish water Generally, water having a dissolved solids content of 1000–10,000 mg/l.
Buffers Substances in solution that resist change in pH as acids or bases are added to or formed in the solution. Buffer solutions usually contain mixtures of weak acids and their salts (conjugate bases) or weak bases and their salts (conjugate acids).
Calcium carbonate equivalents The impurities of naturally occurring waters are frequently expressed as CaCO3 equivalents (Table 6.9). To convert the ppm (mg/l) of a given constituent to ppm expressed as CaCO3, multiply “ppm” by the ratio of the molecular weight (MW) of CaCO3 to that of the constituent. For example, to convert ppm of carbonate to ppm of CaCO3 equivalents multiply by 1.67. The MW of CaCO3 is 100.
Capacity Operating – the fraction of total capacity used in an ion-exchange operation. Total – the ultimate or maximum ion-exchange capacity of a resin.
Carbonate alkalinity The carbonate ion concentration expressed in “ppm” as CaCO3 equivalents.
Carbon dioxide CO2 gas is a natural component of natural waters. It is also generated by biological oxidation of organic matter, especially in polluted water. Carbon dioxide is very soluble in water above pH 5 and forms bicarbonate and carbonate buffers by exposure to atmosphere. In the case of surface waters it can enter water from the atmosphere when its concentration in water is less than that in equilibrium with CO2 in the atmosphere in accordance with Henry’s law. Free CO2 is dissolved carbon dioxide gas in water.
Carbonate hardness Carbonate hardness is chemically equivalent to the bicarbonate plus carbonate hardness (formerly called “temporary hardness”). It is expressed as ppm CaCO3.
Carbon nano-tube membrane CNT membrane made by catalytic vapour deposition on the surface of quartz substrates. Observed flow velocities are four to five orders of magnitude higher than predicted by the Hagen–Poiseuille equation.
Catalyst A substance that lowers activation energy of a reaction but is not consumed. It reduces the time needed for a reaction to reach equilibrium but does not affect the composition of the equilibrium reaction.
Cation A positively charged ion resulting from the dissociation of molecules in solution.
Cation-exchange membrane Membrane containing a fixed negative polar group that will permit passage of cations and reject anions.
Cell potential Voltage produced by an electrochemical cell.
cfu Colony forming units, a measure of the number of microorganisms in a sample that are capable of forming colonies on a plate.
Channelling Liquid flow through a path of least resistance in a packed bed.
Chelating agent Organic compounds having the ability to form soluble complexes with ions in an aqueous solution. The solubility of metal ions is increased by chelating agents. See EDTA. Natural chelates include haemoglobin (contains iron), vitamin B-12 (containing cobalt), and chlorophyll (containing iron). Natural organic substances, e.g. humic are capable of chelating.
Chemical potential Defined in terms of Gibbs free energy, it is a measure of how the Gibbs function for a system changes when a specified amount of component is added to the system.
Chlorination Addition of chlorine in the form of free chlorine or sodium hypochlorite. Chlorine, hypochlorous acid and hypochlorite ions are called “free chlorine residuals,” whereas the chloramines are referred to as “combined chlorine residuals.”
Cryptosporidium A microbial pathogen found in surface water. Ingestion can cause cryptosporidiosis, an abdominal infection.
Coagulant A chemical (e.g. alum of iron salts) used to form a floc; used in the clarification of turbid or coloured water, and as an aid in removing colloids. See also Zeta potential.
COD (chemical oxygen demand) A chemical measure of the amount of oxygen required to break down organic matter in a sample expressed in parts per million (ppm). It does not differentiate stable from unstable organic matter. COD values are greater than BOD values.
Colligative properties Properties of a solution that depend only on the number of solute molecules and not the identity of the solute. They include osmotic pressure, freezing point depression, boiling point elevation and Raoult’s law.
Colloids Particles (0.001–1.0 μm) that form a suspension or emulsion and cause turbidity in water. All colloidal particles are electrically charged (+ ve or − ve), have very large surface areas, and are too stable to be removed by gravitational settling (can be removed by UF in their original state). However, if they are destabilised by charge neutralisation or allowed to form aggregates with coagulating agents, they can be removed by filtration. Hydrophilic colloids such as protein compounds have minimum solubility at their iso-electric point (pH = 4.0–6.5).
Colloidal solutions Stable two-phase systems with fine particles of one phase dispersed in a second phase. Solid particles suspended in a liquid – sols; liquid/liquid systems – emulsions; gas/liquid systems – aerosol.
Concentrate That portion of the feed solution that is retained (on the high-pressure side) of the membrane. As a result, the retained components are usually more concentrated than they were in the original feed solution. The terms concentrate, reject and retentate are used interchangeably.
Concentration polarisation Accumulation of solutes within the boundary layer above the membrane surface. Solutes that do not pass through the membrane accumulate on the membrane surface causing either an increased resistance to solvent transport or an increase in local osmotic pressure (either of which may decrease flux), and possibly a change in the separation characteristics of the membrane. See also Gel Layer and Polarisation Modulus.
Concentration ratio or concentration factor The ratio of the initial feed volume (or weight or flow rate) to the concentrate volume (or weight or flow rate).
Contact angle Acute for hydrophilic and obtuse for hydrophobic at solvent–solid interface.
Continuous diafiltration A mode of processing where water is added continuously to the feed tank or the retentate loop at the same rate as permeate flux. The total volume of the system and the concentration of the retained solute remain constant during CD. The concentration of the permeable solutes decreases in proportion to the volumes diluted and their individual rejections.
Critical flux Membrane flux below which flux decline is minimal. Operation at below critical flux condition results in minimal fouling. See also Flux-step.
Cross-contamination Inter-mixing of one resin with another of opposite charge.
Cross-linking The “setting up” of chemical links between two or more polymer chains.
Cross-flow The flow of fluid across a membrane surface, parallel to its surface or tangential flow. These modules have one inlet (feed) and two outlets (concentrate and permeate). This is in contrast to dead-end modules.
Cryoto – Cryptosporidium A protozoan parasite found in cattle and sheep. Causes severe diarrhoea in humans.
DE Diatomaceous earth, which is the fossilised skeletal remains of microscopic prehistoric plants; used as a filter aid in conventional filtration.
Dead-end Mode of operation where there is only one feedstream and one outlet stream (the filtrate of permeate). Refers to modules that do not have a means for cross-flow, e.g. stirred cells. Cross-flow modules could be operated in the dead-end mode by shutting off the reject outlet of the module.
Deionisation See Demineralisation.
Demineralisation Any process used to remove mineral salts from water, commonly restricted to an ion-exchange process.
Denitrification Biochemical reduction of nitrate to nitrogen gas.
Desalination The process of removing salts from water by reverse osmosis or distillation.
Detergents Organic materials that have the property of being “surface active” in aqueous solution. See Surfactants.
Diafiltration The convective elimination of permeable solutes by the addition of fresh solvent (water) to the retentate. Two modes of operation may be used in diafiltration: continuous or discontinuous.
Diffusivity/diffusion coefficient A measure of a solute’s diffusive mobility in a solvent, cm2/s.
Discontinuous diafiltration Permeable solutes are first eliminated by conventional UF or MF. Water is then added to the concentrated retentate to dilute it back to a certain volume and reprocessed by MF or UF. This process of repetitive MF/UF and dilution to eliminate permeable solutes is called discontinuous diafiltration.
Dissolved air flotation (DAF) The process that introduces fine bubbles of air into water. The bubbles tend to form using solid particles as nuclei, which then float to the surface where they are removed as a foam.
Dissolved oxygen All atmospheric gases are soluble in water to some degree. Oxygen and nitrogen are poorly soluble, and since they do not react with water chemically, their solubility is directly proportional to their partial pressures. The solubility of atmospheric oxygen in fresh water ranges from 14.6 mg/l at 0°C to 7 mg/l at 35°C at 1 bar atmosphere pressure. The equilibrium concentration of oxygen in water at 20°C at 1 bar air is 9.2 mg/l. The low solubility of oxygen restricts the purification capacity of natural waters, necessitating treatment of wastes to remove pollutants prior to discharge. The solubility of oxygen is also less in saline water than in clean water.
Divinylbenzene A di-functional monomer used to cross-link polymers.
Donnan phenomena Fixed charged groups on the membrane polymer backbone tend to exclude ions of the same charge, especially multivalent ions, while permeable to ions of opposite charge particularly multivalent ions.
Drawback The process of natural osmosis that occurs when an RO system is shut down.
EDTA Ethylene-diamine-tetra-acetic acid; the Na+ salt is the usual form of this chelating agent.
Eductor An in-line static mixing device that, by flow of water through it creates a vacuum, thereby drawing a solution into the water stream.
Electric double layer Most substances acquire a surface electric charge when brought into contact with a polar (e.g. aqueous) medium possibly due to ionisation, ion adsorption and ion dissolution. Ions of opposite charge (counter-ions) are attracted toward the surface, and ions of like charge (co-ions) are repelled away from the surface. This together with the mixing tendency of thermal motion leads to the formation of an electric double layer made of the charged surface and a neutralising excess of counter-ions over co-ions distributed in a diffuse manner in the polar medium. The theory of the electric “double layer” deals with this distribution of ions and the magnitude of the electric potentials, which occur in area of the charged surface. See also Zeta potential.
Electrochemical cell Device that uses an electrochemical reaction to generate an electric current at a constant voltage.
Electrochemistry The study of chemical reactions that produce electricity, and the use of electricity to facilitate non-spontaneous chemical reactions.
Electron donor Species capable of donating an electron to a suitable acceptor, which is oxidised as a result.
Electroneutrality When the positive charges equal the negative charges.
End point (breakthrough) A pre-selected value or measurement used to determine when the service cycle is completed or that a break-through has occurred.
Enzymes, catalysts Temperature sensitive, organic catalysts produced by living cells. Enzymes are proteinaceous catalysts that permit biochemical reactions at room temperature. Catalysts increase the rate of a chemical reaction by lowering the activation energy of the reactions.
Equivalent Equal valence is the weight in grams of a substance that combines with or displaces one gram of hydrogen, usually obtained by dividing the molecular weight by the valence.
Eutrophication The process whereby nutrients and biological growth increase with time in a body of water.
Exchange sites Reactive groups on an ion-exchange resin.
Exothermic Giving off heat in a chemical reaction. Reverse of endothermic.
Feed-and-bleed A continuous cross-flow mode of UF or MF operation where the feed is pumped into the recirculation loop of the membrane system at the same rate as the sum of the concentrate flow and permeate flux out of that loop. The feed concentration within the recirculation loop is determined by the concentration factor.
Filter aid A material added to a liquid to be filtered or on to the filter medium to improve the separation of solids from the liquid.
Fines Particles smaller than 50 mesh in size.
Floc A gelatinous precipitate formed by a coagulant.
Flocculants Materials that can form gelatinous clouds of precipitate to enclose fine particles of suspended dirt.
Fluoropolymers See Thermoplastics.
Flow rate The volumetric rate of flow of fluid parallel to the membrane surface. This is expressed in terms of volume/time (e.g. l/min or gal/min). Flow rate is velocity (v) × cross-sectional area of the feed channel. Also sometimes termed recycling rate or recirculation rate. This is the major determinant of the state of turbulence in a membrane module.
Flux Membrane permeate throughput (flow rate per unit area) usually expressed as volume per unit membrane area per unit time, e.g. l/m2/h, m3/m2/h, or gal/ft2/day.
Flux-step Critical flux identification method whereby flux is increased incrementally and the TMP or permeability response recorded.
FMA Free mineral acidity; the sum of the mineral acids.
Fouling Phenomenon in which the membrane adsorbs or interacts in some manner with solutes in feed resulting in a decrease in membrane performance (lowering of the flux and/or increase in rejection of solutes). This is usually irreversible and time-dependent, which distinguishes it from concentration polarisation.
Freeboard The space above a packed bed in a vessel that allows for bed expansion during backwashing.
Functional groups See Exchange Sites.
Gel layer Precipitation of sparingly soluble macromolecules, colloids and particles on the membrane surface.
Gellular A jelly-like appearance with no apparent physical pores, e.g. gellular resins.
Giardia Giardia lamblia is a protozoan organism that causes severe diarrhoea, carried by animals.
Glass transition temperature (Tg) The temperature where the polymer transits from a rubbery state to a glassy state. The thermal expansion coefficient in the rubbery state is two to three times greater than in the glassy state because of greater molecular (chain) mobility. Tg varies between − 120 and + 130°C, depending on the type of polymer. Rubbery polymers such as elastomers have − ve Tg, i.e. Tg is well below their use temperature, whereas common plastics such as polyvinyl chloride (PVC) polymers have + ve Tg, i.e. Tg is well above their use temperature. However, if used above its Tg, PVC would display the usual rubber-like behaviour.
Hardness It is caused by multivalent metallic cations. The main cations promoting hardness in water, Ca2 +, Mg2 +, Sr2 +, Fe2 +, Mn2 +, and the major anions associated with them are ![]() ,
, ![]() , Cl−,
, Cl−, ![]() , and SiO3. Can include iron and other multivalent cations. A rough classification of water in terms of hardness (mg/l as CaCO3) is soft = 0–100; medium hard = 100–300; hard = 300–500; and very hard > 500.
, and SiO3. Can include iron and other multivalent cations. A rough classification of water in terms of hardness (mg/l as CaCO3) is soft = 0–100; medium hard = 100–300; hard = 300–500; and very hard > 500.
Henry’s law The law states that the amount of a gas that dissolves in a given volume of a liquid at constant temperature is directly proportional to the pressure the gas exerts above the liquid. The Henry’s law constant, H, reflects the relationship between gas phase over a solution and dissolved species. Hence, Henry’s law can be used to calculate the amount of gas present at saturation at any temperature.
Heterotrophic Requiring an organic substrate to obtain carbon for growth and development.
Housing A pressure vessel in which a membrane element is placed with ports and fittings to direct the feed, concentrate and permeate streams through the membrane element.
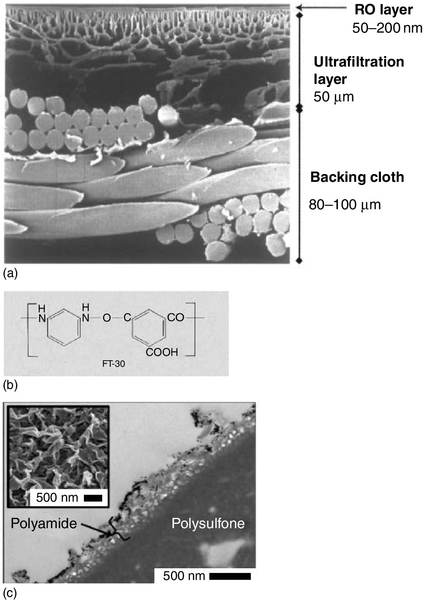
Humic substances High molecular weight polymeric substances, phenolic in character, that are formed by the decomposition of plant materials that release coloured substances of a highly refractive nature. The macromolecular structure is composed largely of aromatic building blocks that have been heavily substituted with carboxylic acid (–COOH) and alcoholic (–OH) functional groups, as shown in Figure 6.1. It has an amphiphilic character due to the hydrophilicity of the –COOH and –OH functional groups, and the hydrophobicity of the aromatic and aliphatic groups in the core of the molecule.

Hydrolysis The addition of water to split a chemical bond, e.g. the splitting of a salt and water into its ions and formation of a weak acid or base, or both.
Hydrophilic A material that is compatible with or preferentially interacts with water (“water loving”). See Contact Angle.
Hydrophobic A material that is incompatible with and cannot interact with water (“water hating”). These materials preferentially interact with oils and other hydrophobic components. See Contact Angle.
Hydroxide alkalinity The carbonate ion concentration expressed in “ppm” as CaCO3 equivalents.
Hyperfiltration Same as reverse osmosis.
Inert media A resin with no reactive groups.
Ion exchange The inter-change of one ion in solution with another ion on an insoluble material.
Iso-electric point Substances such as proteins acquire their charge mainly through the ionisation of carboxyl and amino groups to give COO− and ![]() ions. The ionisation of these groups and the net molecular charge depend strongly on the pH of the solution. At low pH a protein molecule is positively charged, and at high pH, it is negatively charge. The pH at which the net charge is zero is called the “iso-electric” point.
ions. The ionisation of these groups and the net molecular charge depend strongly on the pH of the solution. At low pH a protein molecule is positively charged, and at high pH, it is negatively charge. The pH at which the net charge is zero is called the “iso-electric” point.
Isotropic Refers to the ultra-structure of a membrane, where the pores are essentially uniform in size from the top to the bottom of the membrane body, and the body is more or less of a uniform density.
Jackson turbidity units (JTU) A measure of turbidity or suspended particles by optical obstruction of light rays passed through a water sample. See NTU.
Langelier Saturation Index (LSI) It is a means of expressing the degree of saturation of water as related to calcium carbonate solubility. The difference between the actual pH and the pH at which the water would be saturated with calcium carbonate, pHs. It quantifies CaCO3 scaling potential. If LSI is positive, pH > pHs, CaCO3 will precipitate from water. If LSI is negative, pH < pHs, water will dissolve CaCO3 and will be corrosive. The LSI value must be negative to ensure the scaling potential is nil. Common practice is to feed sufficient acid or an anti-scalant to reduce the LSI in the concentrate stream to < 1. See Section 6.14.
Leakage Leakage or slippage is the amount of an ion or ions in the effluent from an ion-exchange bed during the service cycle.
“Like dissolves like” (i) A solute dissolves when the attraction of solvent molecules to solute molecules (or ions) overcomes the intermolecular forces (or ionic bonds) holding solute molecules (or ions) together. (ii) For a solute to dissolve in a solvent, the cohesive forces that hold the solute molecules together (e.g. London forces, dipole–dipole interactions) should be the same as those that hold the solvent molecules together. (iii) Non-polar solvents dissolve non-polar solutes, while polar solvents dissolve polar solutes.
Macroporous A material with large pores, e.g. macroporous resins for removing organics.
Mass transfer coefficient (k) A measure of the solute’s mobility due to forced or natural convection in the system. Analogous to a heat transfer coefficient, it is measured as the ratio of the mass flux to the driving force. In membrane processes the driving force is the difference in solute concentration at the membrane surface and at some arbitrarily defined point in the bulk fluid. When using the “film theory” to model mass transfer, k is also defined as D/δ, where D is solute diffusivity and δ is the thickness of the concentration boundary layer.
Membrane element Refers to a membrane module without the pressure vessel housing.
meq/L Milli-equivalents per litre.
Membrane bio-reactor (MBR) A system for simultaneous reaction and separation with a membrane. Could be conducted in the same physical enclosure or in separate enclosures if the reaction vessel and membrane unit are coupled in a semi-closed-loop configuration.
Mesh The number of strands in a linear inch of filter material. Higher numbers mean finer particles are retained.
Micrometre (μm) Indication of size of microscopic particles; 1.0 μm = 0.0001 cm.
Microfiltration (MF) Membrane separation process using microporous membranes with a pore size range of 0.1–10 μm.
Mil One-thousandth of an inch. 1 mil = 0.0254 mm. A common way of expressing the thickness of spacers in flat-sheet membrane elements.
Molality One mole of solute per kilogram of solvent.
Molarity One mole of solute per litre of solvent.
MWCO Molecular weight cut-off, a term used to describe the potential separating capabilities of a UF membrane; molecular weight of a theoretical solute with 90% rejection by the membrane.
Mixed-matrix membranes A combination of organic and inorganic materials. The objective is to combine the high packing density, good permselectivity and long operational experience of polymeric membranes with superior chemical, biological and thermal stability of inorganic membranes, e.g. nanocomposite membranes made by adding zeolite nanoparticles to polyamide films that boost permeability without sacrificing rejection.
Nanofiltration (NF) Originally called “loose RO.” NF operates at lower pressure than RO but at a higher flux. A process that rejects multivalent ions and organic compounds >200 molecular weight but rejection of monovalent ions is < 70%.
Neutral Neither acidic nor basic, i.e. pH 7.0.
Nitrification An aerobic respiration process in which ammonia is converted into nitrate in the presence of oxygen. Biochemical oxidation of ammonia to nitrate.
Non-carbonate hardness The amount of hardness that is in excess of carbonate hardness, i.e. hardness in water caused by chlorides, sulphates and nitrates of calcium and magnesium (formerly called “permanent hardness”). See Hardness.
Non-reactive silica Polymerised colloidal silica.
NTU Nephelometric turbidity units. A measure of turbidity in water by scattering of light from particles. Replaces JTU.
Oleophilic Same as hydrophobic.
Osmosis It is the movement of a solvent through a membrane that is impermeable to a solute, from the more dilute to the more concentrated solution. Water passes through the membrane in both directions, but it flows more rapidly in the direction of the salt solution resulting in a difference in hydrostatic pressure. The tendency of the solvent to flow can be stopped by applying pressure to the salt solution. The excess pressure that must be applied to the solution to produce equilibrium is known as “osmotic pressure.” The pressure exerted in excess of the osmotic pressure “reverses” the flow of the solvent and is called “reverse osmosis.”
Oxidation A chemical reaction in which an element or ion is increased in positive valence, losing electrons to an oxidising agent. Oxidants such as chlorine and ozone are added to water and wastewater to bring about the desired inorganic and organic transformations as well as to disinfect.
Oxidation–reduction reactions Many reactions in wastewater treatment including organic oxidation, methane fermentation, nitrification, and denitrification are mediated by bacteria. They are important in the solubilisation of iron and manganese.
Permeate That portion of the feed solution that passes through the membrane.
pH A measure of the hydrogen ion concentration in solution. pH of water determines the percentage of inorganic carbon that is in the form of carbon dioxide, bicarbonate, or carbonate. It also determines the extent to which carbon dioxide is in the permeate water, or whether calcium carbonate is likely to precipitate.
Poiseuille’s law Describes the behaviour of liquids flowing through capillary tubes in relation to their viscosity [V = (πPr4)/(8 μ L)].
Polarisation modulus Ratio of solute concentration in the boundary layer above the membrane surface and the bulk feed once the steady state is reached. In the case of UF and MF membranes solute concentration at the membrane surface is very high for macromolecular and colloidal solutes. The modulus is > 50 for proteins and colloidal as compared to < 1.5 for desalination.
PPM An acronym for “parts per million” (mg/l). Similarly, PPB = μg/l.
Protonation It is the addition of a proton (H+) to an atom, molecule, or ion, forming the conjugate acid.
PWR Product water recovery defined as: permeate flow rate/feed water flow rate, %.
Pyrogen Any substance capable of producing a fever when injected into mammals. Produced by bacteria and not necessarily inactivated by conventional heat treatment methods.
Reaction rate The rate of change in concentration in a reactant or product over time.
Redox conditions Conditions defined by the presence of either dissolved oxygen or some other species capable of providing oxygen bioactivity (reduction–oxidation).
Reduction A chemical reaction in which an element or compound gains electrons, being reduced in positive valence.
Regenerant solution A chemical used to restore the ion-exchange resin back to its desired or original form.
Rejection A measure of how well a membrane retains or allows passage of a solute. When based on concentrations in the bulk of the permeate and retentate streams, it is the “apparent” rejection. The “intrinsic” rejection is based on concentrations at the membrane surface. Sometimes used interchangeably with retention factor.
Reject stream Also called “retentate,” it is the concentrated feed stream that does not flow through the membrane.
Retention factor Defined in the same manner as rejection, except retention refers to the feed, permeate, and retentate streams entering and leaving a module, while rejection should ideally refer to local concentrations close to the membrane surface.
Reynolds number (Re) A measure of the state of turbulence in a fluid system. It is calculated as the ratio of inertia effects to viscous effects. Reynolds number is dimensionless. Flow systems with Re values < 2200 are considered to be laminar flow, while Re > 4000 are considered to be fully turbulent. See Table 6.1 and Section 6.5.
Table 6.1
Reynolds numbers for various flow systems
| Flow system | Rea |
| Flow past wing of a jumbo jet | 5 × 10⁷ |
| Spin-down of a stirred cup of tea | 5 × 10³ |
| Finger moved through water | 3 × 10² |
| Golden syrup draining from a spoon | 2 × 10− 3 |
| Swimming spermatozoan | 1 × 10− 3 |
| Spiral-wound membrane elementsb | < 1 × 10³ |
Source: Adapted from Acheson, From Calculus to Chaos, Oxford, 1997.
a Re < 2.1 × 10³ is laminar; Re > 4 × 10³ is turbulent. The transition from laminar to turbulent flow in porous channels and tubes, e.g. tubular membranes, Re < 2 × 10³.
b Flow is considered turbulent because of mesh spacers.
Salt-splitting To replace the cation (or anion) of a neutral salt such as sodium chloride (NaCl) with hydrogen (or hydroxyl) ion.
Schmidt number (Sc) A measure of the ratio of momentum transfer to mass transfer. See Section 6.5.
Silt Density Index (SDI) It is an empirical measurement (ASTM Standard D-4189-82, 1987) used for measuring the colloidal fouling potential of RO/NF feed water. It is not a direct measure of the particle concentration, which is more properly measured by turbidity. The SDI value is based on the time required to filter a volume of feed water through a 0.45 μm filter pad at a feed pressure of 2.1 bar g. The SDI value is calculated from the formula:

where P30 is % plugging, which should not exceed 75%; Tt the total test time, usually 15 min; Ti the initial time in seconds required to obtain a sample; and Tf is the time required to obtain a sample after 15 min.A value < 1 is indicative of a system that will run for several years without problems; a system with a value in the range of 3–5 is considered a “problem” and requires regular cleaning, and a value > 5 indicates a system with severe fouling potential. Most spiral-wound RO/NF membrane systems require a SDI < 3.
Sherwood number (Sh) A dimensionless measure of the ratio of convective mass transfer to molecular mass transfer. If the mass transfer coefficient k is defined in terms of the “film theory,” then Sh is a measure of the ratio of hydraulic diameter to the thickness of the boundary layer. See Section 6.5.
SHMP Sodium hexametaphosphate, a sequestering agent used for complexing calcium sulphate, thereby preventing CaSO4 from precipitating on the membrane surface.
SI Units International System of Units was established in 1973–74 to develop a uniform method of reporting results worldwide. The basic units are metre (m), kilogram (kg), second (s), ampere (A), Kelvin (K), mole (mol) and candela (cd). Acceptable units outside the SI system are litre (l), grams per litre (g/l), moles per litre (M), day (d), hour (h) and minute (min).
Solubility product Solubility product constant, Ksp, reflects the relationship between dissolved species and precipitated species. Each ionic compound has its own solubility limit, which is the maximum amount of the compound that can remain in solution. Ksp is commonly used in solubility calculations to determine the precipitation potential of mineral salts. Certain combinations of cations and anions form sparingly soluble salts in water, and scaling in RO/NF may occur when the salts are concentrated beyond their solubility limits. See Table 6.10.
Solute The solid (e.g. salt) that is dissolved in water (solvent) to form a solution.
Solution A homogenous mixture of more than one substance in one phase (solute – minor component of a solution; solvent – major component of a solution).
Spacers A mesh-like material used in flat-sheet modules (e.g. plate, spirals, pleated sheet) to separate successive layers of membranes. Spacers control the feed channel dimensions in these modules. Serve as turbulence promoters in spiral-wound membrane elements.
Space velocity Flow per unit volume of media, m3/h/m3 or gpm/ft3.
Superficial linear velocity Flow per unit area, m3/h/m2 or gpm/ft2.
Surfactant “Surface active agent” is a compound that alters the surface tension of a liquid in which it is dissolved. All surfactants have large polar molecules. One end of the molecule is soluble in water (due to carboxyl, sulphate, hydroxyl, or sulphonate groups) and the other end is readily soluble in oils (organic groups). Synthetic surfactants are of three types: anionic, cationic and nonionic.
Sustainable flux The flux at which TMP increases gradually at an acceptable rate and chemical cleaning required is minimal.
Total dissolved solids (TDS) in mg/l or ppm is a measure of the total weight of impurities found in a water supply. The measure permits a quick, rough estimate of RO/NF permeate quality and feed pressure requirements.
Thermoplastic Polymers such as polyethylene (PE) and polypropylene (PP) can be processed and fabricated in the molten state. When actually used they are in the crystalline state so that the desired physical properties can be exploited. The replacement of all the hydrogen atoms from the linear PE with fluorine atoms results in a fluoropolymer such as polytetrafluoroethylene (PTFE) with a much higher melting temperature.
TFC Thin-film composite RO and NF membranes. A typical TFC membrane consists of three layers: a polyester web structural support (120–150 μm thick), a micro-porous inter layer (~ 40 μm thick), and an ultra-thin polyamide (or other polymer) top layer (0.2 μm thick). See Figure 6.15.
TOC Total organic carbon is a measure of the organic, carbonaceous material in water. Under normal circumstances, TOC concentrations are less than 15 ppm, ranging in most water supplies from 2 to 6 ppm. Under unusual circumstances or in wastewater streams, the TOC level can be 50 ppm or higher. Organic compounds with a molecular weight greater than 200 are easily rejected by RO and NF membranes. Compounds of lower molecular weight such as trihalomethanes are removed only 40%. TOC is not a key parameter in the design of RO systems. It can, however, be a source organic or bacterial fouling of the membrane.
Trace contaminants Contaminants in ground water or drinking water that are carcinogenic when present in excess of minute concentrations as set by the US government maximum contaminant levels. Mostly halogenated hydrocarbons (typically 1–100 μg/l or ppb) and heavy metals (typically 0.1–1.0 mg/l or ppm).
Transmembrane pressure (TMP) The driving force for flux. In cross-flow systems, it is measured as the average of the feed inlet and concentrate outlet pressures minus the permeate back-pressure.
Trihalomethanes (THM) Compounds formed by the reaction between the halogen elements of chlorine and bromine and methane forming chloroform, bromoform, dibromochloromethane and bromodichloromethane. The methane (CH4) molecule has three of its hydrogen atoms replaced by either bromine or chlorine.
Turbidity A measure of the extent to which light is scattered by particulate matter in the water. It is caused by a wide variety of suspended materials ranging in size from colloidal to coarse dispersions. Municipal water supplies normally have a turbidity level of less than 1 NTU indicating a content of less than 0.5 ppm of suspended solids. The turbidity should be less than 1 NTU to avoid particulate fouling of RO/NF membrane elements.
Turbulence promoter Devices that are inserted into the feed/retentate channel of a module to improve mixing characteristics, increase turbulence, and thus improve flux. Typical turbulence promoters are spacers, spiral wires, static Kenics®-type mixers, spheres, or balls.
Ultrafiltration (UF) Membrane separation process using membranes with a pore size range of about 0.005–0.1 μm, corresponding to MWCO of 1000–500,000. See Section 6.12.
Valence The number of positive or negative charges of an ion. It is measured by the number of atoms or ions of hydrogen it takes to combine with or be replaced by an element or radical.
Vapour pressure The pressure exerted by a vapour in equilibrium with a liquid or solid.
Velocity The linear rate of flow of fluid parallel to the membrane, expressed in units of length/time (e.g. m/s). This is calculated as flow rate/cross-sectional area of feed channel.
Void The openings or spaces, e.g., in the body of a membrane, underneath its surface.
Void volume The space between particles of a settled packed bed, or “interstitial volume.”
Water hammer Instantaneous surges of water pressure caused by sudden interruptions in water flow in pipe or tank systems.
WHO Water Guidelines Drinking water: TDS < 1000 mg/l; chloride concentration < 250 mg/l; boron concentration < 2.4 mg/l. Irrigation water: TDS < 450 mg/l; chloride concentration < 105 mg/l; boron concentration < 0.5 mg/l.
Zeolite A mineral composed of hydrated silicates of aluminium and sodium or calcium. The term has been used, sometimes improperly, to describe softening by synthetic IX resins.
Zeolite membrane Ceramic membranes made up of a micro-porous support layer and a meso- or micro-porous active layer. Made from alumina, silica, titania, zirconia, or any other mixtures of these materials.
Zero discharge desalination (ZDD) ZDD is based on electrodialysis metathesis (EDM). EDM stacks utilise the same types of anion and cation-exchange membranes as conventional ED stacks, but there are four membranes and solution compartments in the repeating unit of an EDM stack.
Zeta potential (ζ) It is the magnitude of the charge at the surface of shear – the boundary surface between the fixed ion layer and the solution serves as a shear plane when the particle undergoes movement relative to the solution. ζ = 4πδq/D where q is the charge at the shear surface, δ is the thickness of the diffuse layer, and D is the dielectric constant of the liquid. Zeta potential gives an indication of the effectiveness of added electrolytes in lowering the energy barrier between colloids (i.e. reducing surface potential and electrical double-layer thickness), and thus can be used to select the optimum conditions for coagulation. Most colloids in natural water sources have a negative charge that helps to repel each other and to keep them suspended in solution. Overall, the colloidal water has a negative ζ value. The negative charge can be neutralised by the addition of cationic coagulants such as aluminium sulphate (alum) and ferric chloride. The coagulants are added until ζ reading is zero (neutral). The colloids without charges do not repel each other and coagulate into larger particulate groups, which can be easily filtered out by filtration. See also Electric Double Layer.
6.2 Membrane Polymer Performance
Membrane morphology and performance are altered by changing the chemical structure of the membrane polymer. The permeability of synthetic membranes is dependent on both the chemical and physical structure of the membrane. High permeability may be realised by (a) increase in porosity, (b) decrease in thickness, (c) increase in operating pressure, and (d) increase of hydrophilicity. Water flux of polyamide (PA) membranes can be enhanced by the introduction of highly hydrophilic pendant carboxylic (–COOH) or sulphonic acid (–SO3 H) groups. Nitration of polymers also imparts hydrophilicity to the polymer. However, it was found that the nitrated PA membranes had the opposite effect; the membrane shrank slightly and there was a reduction in flux [1] when thin-film composite (TFC) PA membranes were nitrated to produce a chlorine-resistant membrane (Section 6.3).
The drop in flux can be shown quantitatively by the drop in the value of the membrane constant, A. For a perfectly semi-permeable membrane with feed-side mixing or flow conditions such that the boundary layer is insignificant,
where A is the membrane constant, g/cm2 s atm; J the permeate flux, g/cm2 s; ΔP the pressure drop across the membrane; and π the osmotic pressure of the salt solution, atm. The membrane constant is based on the membrane properties alone [2]. The value of A decreased for the TFC membrane from 1.92 × 10− 5 to 0.47 × 10− 5 g/cm2 s atm or fourfolds after nitration, most likely due to morphological changes in the membrane (discussed next) qualitatively. Any shrinkage in membrane would lead to a decrease in porosity (ɛ) and an increase in skin-layer thickness (λ). These in turn would lead to higher tortuosity (τ). In other words, the term (λτ/ɛ) defined here as a “morphology constant” would increase. This is further evident (J decreases as λτ/ɛ increases) if we consider the equation for the special case of Poiseuille flow through membrane pores, which have the ideal critical diameter (2 t) for desalination given by

where t is the thickness of a monomolecular layer of pure water on the membrane surface based on the preferential-sorption capillary flow model of Sourirajan, J the permeability of water, P the effective pressure, γ the effective pore radius, and η the average viscosity [3]. Typical values for homogenous PA membranes are reported in the literature to be λ = 0.1–0.3 μm, τ = 2.5 and ɛ = 0.005–0.052 [4].
It was also reported that membrane permeability decreased while membrane selectivity increased in the case of nitrated polysulphone (PS) membranes [5] due to increasing packing density. Since the packing density is a common measure of polymer “free volume,” an increase in packing density was believed to be due to an increase in polymeric inter-chain attraction caused by the polar nature of the nitro (–NO2) group, and/or an increase in chain packing efficiency. Further, the addition of nitro groups to the backbone of the PS polymer most likely decreases polymer permeability by stiffening the polymer matrix, thereby restricting chain torsional mobility. The stiffening of the PS polymer by nitration was due to an increase in the glass transition temperature (Tg) of the highly nitrated PS polymer. Hence, a lower flux after nitration of the PA membrane was most likely due to morphological changes playing a far more dominant role than hydrophilic factors. Similar behaviour was also noted when a polysulphone UF membrane was nitrated by a gas phase technique [6]. The UF membrane shrank, transforming into a NF membrane.
6.3 Chlorination of PA Membranes
In order to form suitable membranes, the membrane polymer must possess glass transition temperatures (Tg), and melting temperatures (Tm) that are well above the used temperature. TFC PA membranes in spiral-wound elements are the workhorse of RO and NF systems, as discussed in Chapter 1. These membranes have remarkable properties for separations in aqueous streams; high flux, high rejection (RO membranes), low fouling, satisfactory thermal properties and tolerance to operating conditions over a wide pH range. In the last few years, TFC PA membranes have been developed that are sanitisable with hot water at 80°C, an essential requirement for applications in the pharmaceutical and beverage industries.
As remarkable as the performances of these membranes are, all aromatic PA membranes have one severe drawback: their susceptibility to degradation by chlorine. The removal of chlorine prior to membrane separation by activated carbon, sodium sulphite (Na2SO3), or sodium bisulphite (NaHSO3) addition is, therefore, mandatory. Dechlorination by NaHSO3 in stoichiometric excess can, however, be ineffective in seawater feed because dissolved oxygen in seawater reacts with the chemical. Further, the absence of chlorine can lead to biofouling that is often irreversible.
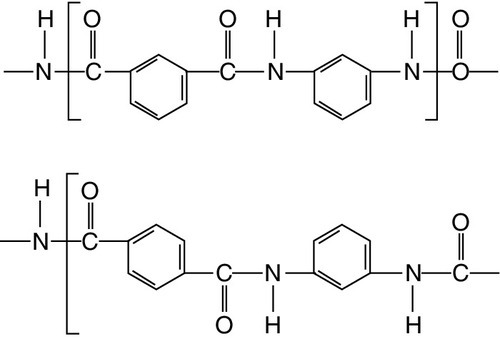
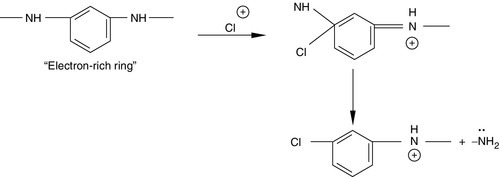
Aromatic PA polymers used for RO membranes are essentially random copolymers consisting of repeat units as shown in Figure 6.2. The amide ring is sensitive to attack by chlorine because it is an electron-rich region [1,7]. Hence, deleterious ring chlorination occurs only on the electron-rich phenylenediamine rings and not on the electron deficient phthalate rings, as shown in Figure 6.3. The bulkiness of the halogen substituents on the amide ring results in changes in hydrogen-bonding modes from inter-molecular to intra-molecular. This results in chain deformation and alteration of the average inter-chain displacement within the membrane skin structure. The damage to the skin layer of TFC composite membranes is severe, rendering the membrane useless with rejections dropping to as low as 20% [8–10]. A reaction scheme for chain cleavage is shown in Figure 6.4.

The effect of oxidative chain cleavage on PA polymer can be investigated by exposing the polymer to a sodium hypochlorite solution over a period of time and measuring the viscosity of the dissolved polymer after chlorination. The severe drop in viscosity after several exposure times confirmed the breakdown of the polymer [7]. Why viscosity? Solution viscosity is a well-recognised measure of the molecular weight of a polymer. According to the Mark–Houwink equation, for example, the relationship between the intrinsic viscosity [η] and the average molecular weight, M, is expressed as:
where K is a proportionality constant [3]. Hence the breakdown of the PA polymer due to chlorination, i.e. lower molecular weight is reflected in lower viscosity measurements.
One way to suppress the ring chlorination reaction is to make the diamine rings less electron rich. Nitro (–NO3) groups are powerful electron acceptors and are known to drastically deactivate aromatic rings toward electrophilic substituents. Nitration of an aromatic ring is known to reduce its reactivity by 10 for further ring addition reactions such as chlorination. A reaction scheme where an NO2 molecule attaches itself to an aromatic ring containing the amide groups is shown in Figure 6.5.

6.4 Fluid Flow in Microporous Membranes
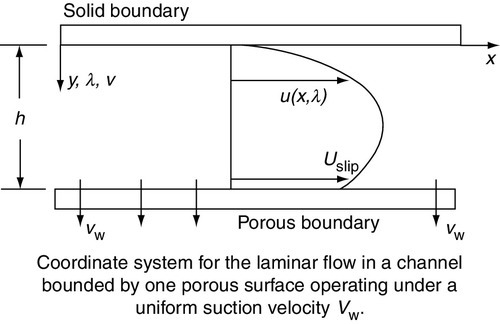
In the analysis of fluid flow in microporous membrane tubes and channels, it is tacitly assumed that the no-slip boundary condition that characterises flows with solid bounding walls is applicable. This postulate is incorrect because the surface velocity at a porous wall is in fact not zero but proportional to the shear rate at the permeable boundary, i.e.
where Us is slip velocity, ϕ is slip-flow coefficient, and du/dy is shear rate at wall boundary. Slip velocity and slip coefficient for a UF membrane were measured with a dye-tracing photographic technique by Kohler [11]. Laminar flow velocity profiles in tubes and channels using slip coefficients measured by Kohler were subsequently investigated [12,13]. Profiles for channel flow (Figure 6.6) are shown in Figure 6.7, which is a plot of normalised velocity as a function of channel height [U (= u/uavg) vs. λ (= y/h)] for an entrance Reynolds number of 1000 (Re = 4 uavgh/ν) and a longitudinal position, x/h, equal to 500. The curves are plotted for a slip coefficient equal to 0, 0.1, and 0.5, and a wall Reynolds number, Rew of 0.1 ((Rew = vwh/ν), where vw is the fluid velocity through the membrane).
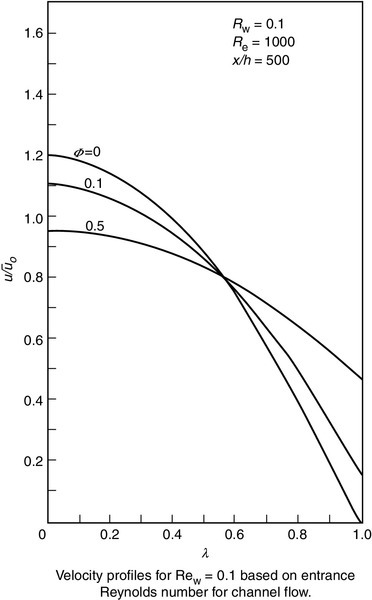
The curves show that the velocity at the membrane surface (λ = 1) is 0 when ϕ is 0 as expected. As the slip velocity increases with increasing ϕ, the wall shear decreases, and the velocity profiles become flatter, approaching those for plug flow [12–14]. The effect of slip coefficient on axial pressure gradient (P) is as follows: an increase in ϕ results in a decrease in wall shear stress so that P also decreases. In addition, the transition from laminar to turbulent flow at a porous surface occurs at a Re of less than 2000, which is also the case with membrane systems.
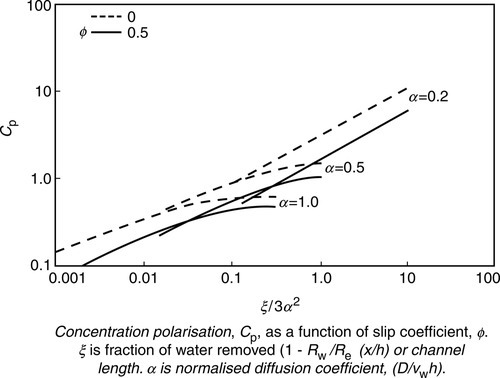
The effect of slip coefficient on concentration polarisation (CP) was mathematically modeled for flat membrane and tubular membrane systems [12,13,15,16]. Lowering of CP due to slip coefficient ϕ as a function of product water recovery (ξ) for different normalised diffusion coefficients (α) is shown in Figure 6.8. The data show that CP decreases both with ϕ and α. Since α is a measure of particle diffusion from the membrane surface to the bulk solution, slip-flow possibly augments diffusive back-transport of particles from the membrane surface to the bulk solution. Thus, the slip-flow velocity model possibly accounts for higher or actual UF/MF flux, which is under-predicted by the gel polarisation model discussed in Chapter 1.
6.5 CP and Mass Transfer Coefficient
CP is the accumulation of rejected solutes on the membrane surface. It reduces membrane permeability of the solvent and can lead to a limiting flux. Hence, controlling or reducing CP is necessary to maintain design flux or throughput. It can be controlled by raising cross-flow velocity and/or by increasing turbulence at the membrane surface resulting in increasing the diffusive back-transport of the solutes from the membrane surface, i.e. increases the mass transfer coefficient. According to Equation (1.3) in Chapter 1, for 100% rejection (solute concentration in permeate is zero), the equation for CP reduces to:
where J is the solvent flux, k is the mass transfer coefficient, Cw (or Cg) and Cb is the concentration of the solute at the membrane surface and in the bulk solution, respectively. k = D/δ, where D is the solute diffusivity and δ is the boundary layer thickness. Mass transfer correlations can be used to estimate the k for various membrane configurations [17]. It can also be estimated empirically (see Chapter 1).
For turbulent flow in a circular tube, the correlation is (Chilton–Colburn),
![]()
For laminar flow in a circular tube, the correlation is (Leveque),
![]()
where Sherwood number, ![]()


where V is the fluid velocity; dh the hydraulic diameter = d for tubes = 4 (cross-sectional area/wetted diameter); L the axial length of tube; and ν is the kinematic viscosity (μ/ρ).
An alternate correlation for k uses the shear rate (γ):
![]()
where γ = 8 V/d for tube (d is tube diameter) and for channel, γ = 6 V/b (b is channel height).
6.6 Surfactant Micelles Size Correlation
Surfactant-based ultrafiltration (SBUF) has been investigated since the 1980s for removing dissolved organic compounds, especially hazardous wastewater, as discussed in Chapter 1. The basis of SBUF is that at concentrations above the critical micelle concentration (CMC), surfactant micelles attach to each other to form organised aggregates called micelles. These aggregates average 30–200 monomers and are easily rejected by UF membranes. Thus sodium dodecyl sulphate, an anionic surfactant with a molecular weight of 288, is too small to be rejected by a UF membrane [18]. However, the anionic surfactant micelles were easily rejected by a 10,000 MWCO membrane. The micelles form in such a way that the hydrophobic portions of the molecules align toward the centre, away from the surrounding hydrophilic aqueous solution.
Surfactants, both ionic and non-ionic, are commonly available. Non-ionic surfactants form larger micelles with aggregation numbers an order of magnitude higher than ionic surfactants but at a much lower CMC, e.g. the CMC value for sodium dodecyl sulphate is 2360 mg/l (MW = 288) as compared to 16 mg/l in the case of Igepal RC-520 (MW = 526), a non-ionic surfactant. Since only micelles are rejected by UF membranes, a high CMC value results in a substantial leakage of surfactant monomers through the membrane. Hence the size of micelles is an important parameter for selecting a UF membrane with the largest MWCO in order to achieve both high flux and high rejection.
The micelle diameter can be calculated by measuring the micelle diffusion coefficient using the technique of dynamic light scattering (DLS). If one assumes that all micelles are spherical in shape, the radius of a micelle in solution may be calculated by using the Stokes–Einstein relation:

where D is the diffusion coefficient, k is Boltzmann’s constant, T the absolute temperature, η the solvent viscosity, and R the hydrodynamic radius of the micelle. Using the DLS technique, the hydrodynamic radius of micelles of ionic surfactants, Tween 80 and Igepal RC-520 was found to be 37–39 and 400–600 Å, respectively [19]. The diffusion coefficient of the two non-ionic surfactants calculated using Equation (6.5) was 5.5 × 10− 7 and 4.5 × 10− 8 cm2/s, respectively. The diameter of the anionic surfactant was considerably smaller, 24 Å, which was in good agreement with the value in the literature.
The surfactant diffusion data were compared with the molecular weight (MW) and diffusion data of selective proteins from the literature to estimate pseudo-molecular weights (PMW) of the surfactant micelle in Figure 6.9 [19]. The correlation indicates that the PMW of Tween 80 and RC-520 micelles was 92,000 and 346,000, respectively. A rule of thumb is that the MWCO of a UF membrane should be at least one-half of the solute to be separated. Thus, a new tool was developed where the relationship between the micelle diameter, diffusion coefficient and a PMW could be used to screen high MWCO membranes for SBUF applications.

6.7 Deioniser Design
Deionisation (DI) requires replacement of all cations and anions in the aqueous, as discussed in Chapter 2. The simplest DI system is a dual-bed system consisting of a strong acid cation exchanger followed by a strong base anion exchanger operating in series. For higher purity water production, a mixed-bed deioniser is required downstream of the two-bed cation–anion exchanger system or an RO system. A general rule of thumb is that when the TDS exceeds 300 mg/l, RO becomes more economical than dual-bed IX systems. IX system capabilities are listed below [20]:
• Sodium cycle softeners with co-flow regeneration: softened water hardness = 1–3 mg/l.
• Sodium cycle softeners with counter-flow regeneration: softened water hardness = 0.5 mg/l.
• Dual-bed IX systems with co-flow regeneration: DI water conductivity = 5–10 μS/cm and silica = 50 μg/l.
• Dual-bed IX system with counter-flow regeneration: DI water conductivity = 1–3 μS/cm and silica = 10–20 μg/l.
• A dual-bed IX system with co-flow regeneration followed by mixed-bed IX: DI water conductivity = 0.06–0.1 μS/cm and silica 5–10 μg/l.
6.7.1 DI system design basis
Design a dual-bed IX system for producing DI water with 1.0 μS/cm conductivity for a medium pressure (25–60 bar g) boiler [21,22]. The feed water has the following components: Ca2 + = 75 mg/l; Na = 50 mg/l; Mg2 + = 25 mg/l; Cl− = 30 mg/l; ![]() = 80 mg/l; HCO3 = 40 mg/l; and SiO2 = 10 mg/l where concentrations are in ppm as CaCO3 equivalent. The feed water flow rate is 57 m3/h at 20°C. The design procedure is given in Sections 6.7.2 and 6.7.3 using the resin manufacturer’s data given below:
= 80 mg/l; HCO3 = 40 mg/l; and SiO2 = 10 mg/l where concentrations are in ppm as CaCO3 equivalent. The feed water flow rate is 57 m3/h at 20°C. The design procedure is given in Sections 6.7.2 and 6.7.3 using the resin manufacturer’s data given below:
Strong acid cation resin bed:
• Regeneration level of 6 lb H2SO4 per ft3 (96 kg H2SO4 per m3) for maximum sodium leakage of 2.0 ppm, and an operating capacity of 15.6 kgr/ft3 (35 kg/m3);
• Pressure drop per foot (per 0.305 m) of bed depth at a linear velocity of 8.6 gpm/ft2 (21 m3/h/m2) is 0.75 psi (5.2 kPa);
• Backwash flow rate of 6.4 gpm/ft2 (15.6 m3/h/m2) for a bed expansion of 60%; and
• Rinse water flow is 25–50 gal/ft3 (3.34–6.68 m3/m3) using DI water or RO permeate. The rinse water flow rates should be 1 gpm/ft3 (8 m3/h/m3) to 1.5 gpm/ft3 (12 m3/h/m3).
Strong base anion resin bed:
• Regeneration level of 4 lb NaOH per ft3 (64 kg NaOH per m3) for maximum silica leakage of 0.05 ppm and an operating capacity of 15.3 kgr/ft3 (35 kg/m3);
• Pressure drop per foot (per 0.305 m) of bed depth at a linear velocity of 8.5 gpm/ft2 (20.8 m3/h/m2) is 0.85 psi (5.9 kPa);
• Backwash flow rate of 2.6 gpm/ft2 (6.34 m3/h/m2) for a bed expansion of 60%; and
• Rinse water flow is 40–90 gal/ft3 (5.34–12.0 m3/m3) using DI water or RO permeate. The rinse water flow rates should be 1 gpm/ft3 (8 m3/h/m3) to 1.5 gpm/ft3 (12 m3/h/m3).
6.7.2 Cation ion-exchanger design
Quantity of water to be treated per service cycle. The amount of process water deionised per service run cycle is (250 gpm)(60 min/h)(12 h/cycle) = 180,000 gal (681 m3).
Cation load. Since the influent cation load is expressed as ppm equivalents as CaCO3, it is necessary to convert to units consistent with resin manufacturer’s capacity data expressed as kilograins (as CaCO3) per ft3 of resin. Total cation load in this case is 75 + 50 + 25 = 150 ppm. Convert to kgr: (150 ppm)(180,000 gal/cycle)/(1000 gr/kgr)(17.1 ppm/g/gal) = 1580 kgr as CaCO3 per cycle.
Quantity of cation-exchange resin. The cation load per cycle is 1580 kg from above, and the resin capacity is given as 15.6 kgr/ft3 in Section 6.7.1. Therefore, the amount of resin needed is 1580 kgr/(15.6 kg/ft3) = 101 ft3 (2.86 m3).
Bed velocities. For water treatment the space velocity (SV) is usually between 1 and 5 gpm/ft3 resin (8 and 40 m3/h/m3). Therefore, the SV is 250 gpm/101 ft3 = 2.5 gpm/ft3. The normal linear velocity range is 4–10 gpm/ft2 (9.75–24.4 m3/h/m2). Assuming a bed depth of 3.5 ft (1.07 m), the cross-sectional area is 101 ft3/3.5 ft = 28.9 ft2. The linear velocity therefore is 250 gpm/28.9 ft2 = 8.6 gpm/ft2, which is within range. If either SV or linear velocity is considerably greater than the normal range, more resin would be required.
Vessel dimensions. The vessel diameter is (X-n area × 4/π)1/2 = (28.9 × 4/π)1/2 = 6.1 ft (1.86 m). In order to determine the vessel side-shell height (SSH), assume 100% bed expansion; hence, the vessel SSH is 7 ft (2.13 m) or twice the bed height.
Resin bed pressure drop and backwash flow rate. A minimum head-space (freeboard) is required for bed expansion at the design backwash flow rate. Typically, the bed expansion is 50–60%. The flow rate required for this expansion is specified as 6.4 gpm/ft2. Thus the backwash flow rate is 6.4 gpm/ft2 × 28.9 ft2 = 185 gpm (42 m3/h). The pressure drop (ΔP) per foot of bed depth is specified as 0.75 psi. Thus ΔP for the cation-resin bed is (0.75 psi/ft) × (3.5 ft) = 2.6 psi (17.9 kPa). This excludes the pressure drop due to valves, fittings, or liquid distributors or collectors. Overall, the ΔP should be < 10 psi (68.9 kPa).
Regeneration calculations. The H2SO4 regeneration level to hold Na+ leakage to 2 ppm is 6 lb/ft3 (96 kg H2SO4 per m3), as specified in Section 6.7.1. The total acid required per cycle, therefore, is (6 lb/ft3)(101 ft3) = 606 lb (275 kg) per cycle. To avoid precipitation of CaSO4, regenerate in two steps. First, use 50% of the regenerant as a 2% solution, and then the rest as a 4% solution. For the 2% step process: (1/2 × 606 lb H2SO4)/(8.43 lb solution per gallon)(0.02 lb H2SO4 per lb solution) or about 1800 gal (6.8 m3) of 2% acid solution. The 4% step requires (1/2 × 606)/(8.54 × 0.04), or about 890 gal (3.37 m3) of 4% acid solution. Note 8.43 and 8.54 lb/gal are densities of the 2% and 4% acid solution, respectively.
Rinse water flow rates. The column must be rinsed with DI/RO water after regeneration to remove traces of acid. Bed rinse is done at two flow rates to remove all traces of acid. The rinse water requirements are specified as 25–50 gal/ft3 resin. For the resin volume of 101 ft3, the rinse water requirement is about 2500–5000 gal (9.5–19 m3). For the slow rinse step, the flow rate is (one bed volume – 101 ft3 × 7.48 gal/ft3, or ~ 750 gal) at 50 gpm (11.4 m3/h) for 15 min. For the fast rinse step, the flow rate is based on the remainder volume, i.e. at 150 gpm (34.1 m3/h) for ~ 50 min.
6.7.3 Anion ion-exchanger design
Quantity of water to be treated per service cycle. The amount of process water deionised per service run cycle is (250 gpm)(60 min/h)(12 h/cycle) = 180,000 gal (681 m3).
Anion load. Total anion load is 30 + 80 + 40 = 150 ppm. Convert to kgr as follows: (150 ppm)(180,000 gal/cycle)/(1000 gr/kgr)(17.1 ppm/g/gal) = 1580 kgr as CaCO3 per cycle.
Quantity of anion-exchange resin. The anion load per cycle from above is 1580 kgr, and the resin capacity is 15.3 kgr/ft3 from Section 6.6.1. So the amount of resin needed is 1580/15.3 = 103 ft3 (2.91 m3).
Bed velocities. The space velocity is 250 gpm/103 ft3 = 2.4 gpm/ft3 resin (19.2 m3/h/m3). The normal linear velocity range is 4–10 gpm/ft2 (9.75–24.4 m3/h/m2). Assume a bed depth of 3.5 ft (1.07 m). Then the bed cross-sectional area is 103 ft3/3.5 ft = 29.4 ft2, and the linear velocity is 250 gpm/29.4 ft2 = 8.5 gpm/ft2, which is within range. If either SV or linear velocity is considerably greater than the normal range, more resin would be required.
Vessel dimensions. The vessel diameter is (area × 4/π)1/2 = (29.4 × 4/π)1/2 = 6.12 ft (1.86 m). In order to determine the vessel side-shell height (SSH), assume 100% bed expansion; hence, the vessel SSH is 7 ft (2.13 m) or twice the bed height.
Resin bed pressure drop and backwash flow rate. A minimum head-space (freeboard) is required for bed expansion to permit the requisite backwash flow rate. Typically, the design bed expansion is 50–60%. The flow rate required for this expansion is specified as 2.6 gpm/ft2 (lower linear velocity because the anion resin is lighter than the cation resin). Hence, the backwash flow rate is (2.6 gpm/ft2) × (29.4 ft2) = 76 gpm (17.3 m3/h).
The pressure drop (ΔP) per foot of bed depth is specified as 0.85 psi. Thus, ΔP for the anion-exchange bed is (0.85 psi/ft) × (3.5 ft) = 3 psi (2.07 kPa). This excludes the pressure drop due to valves, fittings, or liquid distributors or collectors. Overall, the ΔP should be < 10 psi (68.9 kPa).
Regeneration calculations. The caustic soda regeneration level is 4 lb NaOH per ft3 as specified. Total caustic soda requirement, therefore, is (4 lb/ft3)(103 ft3) = 412 lb (187 kg) NaOH per cycle. Regenerant concentration is typically 4% NaOH solution having a density of 8.68 lb/gal. Total regenerant solution requirement per cycle is (412 lb NaOH)/0.04 lb NaOH per lb of solution)(8.68 lb solution per gallon) or 1190 gal per cycle (4.5 m3 per cycle). This should be applied at 0.5 gpm/ft3 (4 m3/h/m3).
Rinse water flow rates. The column is rinsed with DI/RO water after regeneration to remove caustic remaining in the bed. Bed rinse is done at two flow rates to remove all traces of caustic. The rinse water requirements are specified as 40–90 gal/ft3 resin, i.e. for a resin volume of 103 ft3, the requirement is 4000–9000 gal (15.1–34.1 m3). For the slow rinse step, the flow rate is (one bed volume – 103 ft3 × 7.48 gal/ft3, or 750 gal) at 50 gpm (11.4 m3/h) for 15 min. For the fast rinse step, the flow rate is based on the remainder volume, i.e. at 150 gpm (34.1 m3/h) for ~ 50 min.
6.8 Process Controls
Microprocessor-based control systems generally consist of a programmable logic controller (PLC) along with sensors and alarms. The PLC controls the parameters and devices that are automated. The PLC is programmed in ladder logic and provides logic control in a step-wise fashion. PLCs are rugged and inexpensive and offer many options for interfacing with process equipment. This flexibility allows the PLC to control all the processes within the plant as well as provide data to external systems via analogue signals or serial data. The PLC itself, however, is not suited for memory-intensive requirements such as data logging or sophisticated operator interface functions.
An operator interface system (OIS) is used to indicate and record data as gathered by the PLC. The OIS may be a specialised machine with a built-in display or a personal computer (PC) with OIS application software and a PLC interface card. A PC-based system offers greater flexibility and storage capacity but is generally more expensive. The PLC system can provide PID functionality but without an interface system that allows the operator to directly adjust parameters. The PLC, however, can be connected via a digital communication link to an OIS computer. The computer can be programmed with graphical-equipment/process screens to enable the operator to view the system from a primary location and adjust the set point values of the control valves. This arrangement is capable of encompassing a whole plant. The operator and the plant, though, are completely dependent upon a functioning PLC and OIS computer. The operator must start and stop each equipment from the control panel. Once the system is running, it functions automatically. Systems are switched “on” and “off” by the PLC automatically based upon process feedback signals – unless there is a fault in the system, which then requires manual intervention to clear the fault and restart the equipment.
Most industrial sensors, including temperature, pressure, and flow transmitters, provide an analogue output in the form of a voltage or current signal. For example, a temperature sensor might generate 1 V at 10°C and 5 V at 50°C. Analogue signals in a current form (4–20 mA) are especially popular because they are more impervious to noise and can conveniently provide a power source for low demand instruments. Another advantage is that using 4 mA to represent zero for whatever is being measured allows the system to differentiate a faulty instrument from one that is simply reading zero.
An analogue signal cannot be used directly by the PLC, so it is transformed into a digital signal with the aid of an analogue-to-digital (A/D) converter. The accuracy of an A/D converter depends on the number of bits (the unit for binary information) it sends to the computer. A 10-bit converter will work in the range of 0–1024 and is, therefore, able to divide an analogue signal voltage into 1024 steps. This represents an accuracy of 1/1024, which is approximately 0.1%. Many A/D converters are capable of 12-bit resolution that represents an accuracy of 0.02%. The PLC generates analogue output signals for controlling the process such as valve position or motor speed in a similar manner using digital-to-analogue conversion. Most PLC systems also resolve the output signal into 12 bits.
More sophisticated instruments of many different types provide data in the form of a serial string. In such cases, A/D conversion is not necessary, but the PLC must be programmed to accept the format of the serial data. This method can provide much more data than just a single process value and eliminates the inherent inaccuracy of D/A and A/D converters. Addressable instruments utilise widely accepted protocols. These devices have the advantages of multi-parameter data transfer of serial instruments but afford the ease of wiring and use of analogue instruments. In many situations a device that switches between only two states may be adequate to control a process. In such cases it is more cost-effective to use a digital sensor that changes from one state to another based on a change in the process; for instance, when the pump discharge pressure exceeds a preset value, a pressure switch may change its state to close a circuit and notify the PLC. A two-state sensor may also provide backup for an analog instrument in a critical process.
All instruments and control systems must provide a way to implement process control interlocks, alarms and algorithms to prevent a dangerous upset from occurring and to safely shut down the process equipment if one does occur. Alarms let an operator know when a process deviates far enough from normal conditions and immediate action is warranted to prevent safety or quality incidents. The tendency to over-alarm the system should be avoided. Individual warning lights or annunciator panels are commonly used to indicate specific system faults, which also may be indicated in the OIS system. The latter gives the operator the ability to see the time of occurrence and associate each alarm with other conditions in the system for troubleshooting purposes. System-wide alarm conditions are indicated with a visual beacon and an audible alarm. Alarms and graphical indicators are usually driven by the PLC.
6.9 Centrifugal Pumps
Centrifugal pumps are the prime fluid movers in membrane plants for liquid separations. In general, centrifugal pumps are used in moderate-to-high flow under low head conditions and operate within the rated ranges of head and velocity. Pump specifications depend on process requirements; for example, fluid flow rate determines the capacity of the pump, whereas pump head depends on fluid density and viscosity. Pump head is commonly used as a measure of energy. The total dynamic head (TDH) is a reflection of the energy a pump imparts to a fluid, and takes into account differences in pressure, fluid elevation and velocity between source and destination. In addition, TDH accounts for pipe friction losses and the pressure drop through in-line items such as instruments, valves, strainers and static mixers.
6.9.1 Pump selection criteria
Material and energy balances are used to calculate the required flow rate while the maximum pump pressure or “shut-off” pressure is the maximum pressure a pump will develop under no-flow conditions, e.g. when the pump outlet line is fully blocked. The amount of work needed to drive the pump increases with increase in fluid density and viscosity. The maximum values of these properties usually occur during start-up, shutdown and process upsets. Similarly, fluid temperature and the presence of suspended solids are taken into consideration during pump specification.
Pump brake horsepower (BHP) is related to the flow rate (Q, gpm), TDH (or H, ft), specific gravity (S.G.) and efficiency (η) by the relationship,

The efficiency is set by the pump manufacturer when the final pump selection is made. It is usually based on their shop tests for the same model and size pumps. The pump efficiency can vary between 10% and 80%. Pump electric motor specifications require mechanical and electrical requirements. Motors can vary in size depending upon power, speed (RPM), frame size, area classification, orientation, service factor and type of enclosure (e.g. totally enclosed fan closure).
Pumps are specified to avoid cavitation. When the suction pressure of the pump fluid drops below its vapour pressure, vapour bubbles form resulting in cavitation. When the fluid gets re-pressurised, these bubbles implode, which results in pitting of the impeller and other pump components. Further, since vapour has a lower density than liquid, cavitation results in lowering pump capacity and efficiency.
Pump manufacturers have established guidelines to ensure each pump they supply is not exposed to conditions that result in cavitation. The design standard is called NPSHR or net positive suction head required. The NPSHR takes into account any potential head losses that might occur between the pump’s suction nozzle and impeller thereby ensuring the liquid does not drop below its vapour pressure (bubble point). The NPSH is a measure of the proximity of a liquid to its vapour pressure, and must exceed the pump manufacturer’s pump NPSHR. There are two process variables that can be adjusted, in case the available NPSH is less than the NPSHR: raise the static head and lower friction losses. Conversely, the NPSHR can be reduced by using a larger, slower speed pump, a double suction impeller, a larger impeller inlet area, an oversized pump and a secondary impeller placed ahead of the primary impeller.
Every pump manufacturer provides a specific curve for a pump, as shown in Figure 6.10. The curve relates head, flow rate, power, NPSHR, and efficiency for specific impeller diameters for the particular pump. The pump should not be operated below the manufacturer’s minimum continuous flow rate rating. The pump impeller size is indicated in horizontal lines. The pump curve shows the pump has a specific NPSHR that varies depending on the head and flow. The goal is to select a pump with a rated (or design) point as close as possible to the best efficiency point as determined by the manufacturer. Since pumps are rarely operated at their exact design point, flow rate and head need to be changed to increase pump efficiency or to accommodate changes in process requirements. Hence, the impeller selected should be one size smaller than the maximum size for the given pump casing so that it can be replaced with a larger one without replacing the casing.
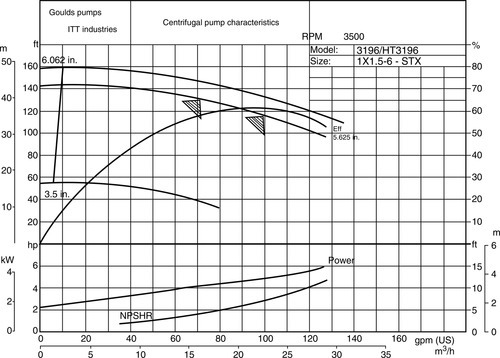
The construction materials of a pump depend on fluid properties such as corrosiveness, presence of dissolved gases and product application. Pump seals around the pump shaft are very important for preventing process fluid leaks. The seals are of two types: packing and mechanical. Mechanical seals are the most widely sealing method. Another class of pumps, the magnetically coupled pumps, are seal-less with no rotating shaft seals. These pumps, however, may not be suitable for high purity water (HPW) systems because of the potential for bacteria growth in the gap between the inner magnet and the containment can [23].
6.9.2 Pump controls
The purpose of pump control is to maintain a set of process conditions and operate it safely. These include adjusting (a) flow rate by throttling pump discharge, (b) controlling pump speed and (c) switching the pump on and off. Throttling is achieved with a flow controller and a control valve in the discharge line. Controlled flows are most often accomplished with a self-regulating (modulating) pressure-control valve on the pump discharge (as in a RO high-pressure pump discharge line), or a flow-control valve and controller with a flow configured at the set point (as in RO reject flow control), as discussed in Chapter 2.
The pump speed can be controlled by using a variable-speed driver (VFD) especially, when the capacity of the pump varies greatly. VFDs include electric, electromechanical, mechanical and hydraulic power recovery turbines.
Pump on–off control is achieved with level switches or level transmitters that have built-in dead bands on the suction vessel (storage tank) to start and stop the pump. Frequent starts and stops can damage the pump and the motor; hence, the storage tank is sized to accommodate changes in level by providing sufficient storage (residence time). Low suction pressure switches are used as safety interlocks for shutting off the pump when the suction pressure is below the set point. Conversely, high-pressure switches are installed on the pump discharge so as not to exceed the maximum allowable output pressure resulting in dead-heading the pump.
6.10 Control Valves
A control valve is a variable orifice used to regulate the flow of a process fluid. Control valves are a key component in any process plant. Proper selection of these valves can have a significant impact on how well the process is controlled and the overall cost of the plant. Characteristics of commonly used control valves in membrane plants are given in Table 6.2. In order to select a control valve, the following system operating conditions and fluid properties must be known: fluid state (vapour, liquid, or two-phase), vapour pressure, flow rate, inlet and outlet pressure, inlet temperature, fluid density, molecular weight and viscosity, specific heat ratio, critical temperature and critical pressure. In about 80% of applications, the valves are selected to be fail-safe closed under spring actuator action when there is a loss of power or signal. Hence, information about the valve’s fail-safe position and maximum shut-off pressure is also required.
Table 6.2
Characteristics of process valves
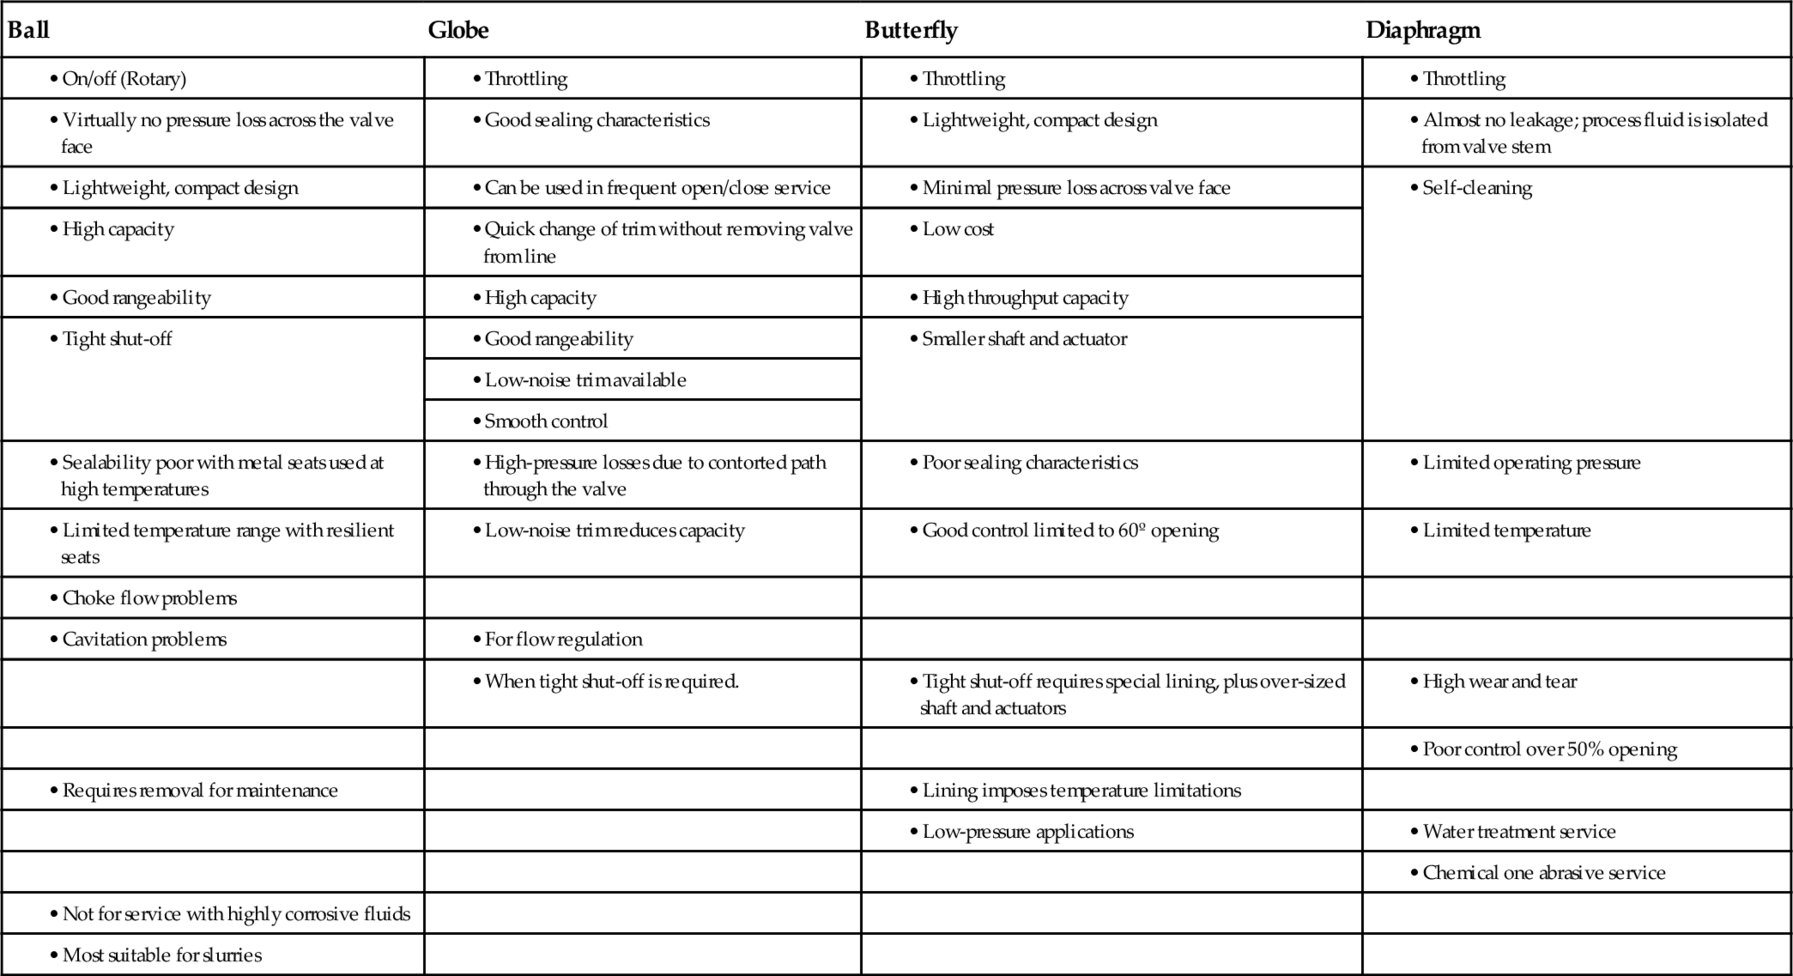
Source: Bishop et al., Reproduced with permission from Chemical Engineering Progress, Nov. 2002. Copyright® 2002 AIChE.
A valve should satisfy the following conditions to be effective: operate over a wide range of flows (wide range-ability), accurately respond to any signal across its operating range, exhibit little dead time (hysteresis), react to incremental adjustments from the controller (resolution), and respond with the required speed (stroking speed) [24]. The quality of a control valve is quantified in terms of its (a) gain, (b) time constant, and (c) dead-time lag. Gain is the ratio of the percentage change in a process variable to the percentage change of valve travel and depends on the valve characteristics and process conditions. The gain should never be less than 0.5.
The ability of a valve to control flow depends upon the quality of its actuator. A positioner is added when tighter control is required for the modulating valve, as shown in Figure 6.11. Positioners improve performance by amplifying the controller’s signal, thereby achieving a more precise response. Control valves are either motorised (electrically operated) or pneumatic (air operated). A control valve should react instantaneously to any change in the signal. A fast response, however, may not be suitable for all applications. The signal is generated by a control loop, which consists of a sensing element, a controller and the final control element, as shown in Figure 6.12. The sensing element transmits a signal to a local controller or a remote controller such as a PLC. The controller compares the signal with the set point and makes the required corrections by sending a signal to the control valve. The correction is measured and verified by the sensing element. Also shown in the figure is the I/P transducer converting the electronic signal to a pneumatic signal.
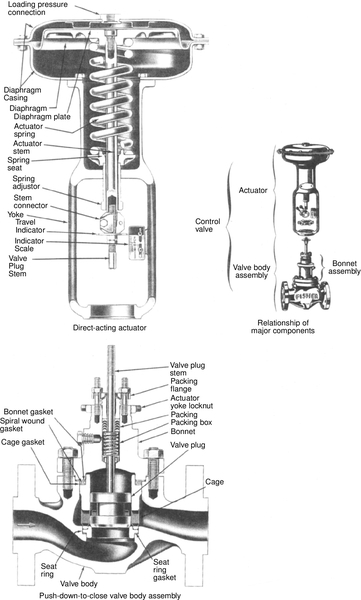
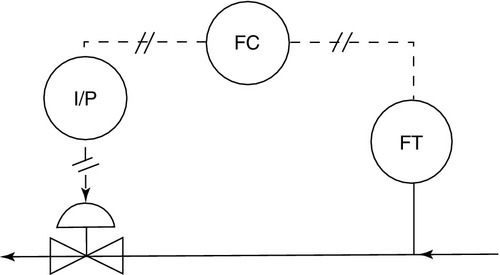
There are two main features of control valves: valve capacity and valve characteristics. The most important valve parameter for calculating the size of a control valve is the flow coefficient, Cv, which gives the flow rate of water through a valve for a unit pressure drop at standard conditions. It varies with size and style of valve. For liquids, the Cv value is calculated empirically using the equation:
where Q is flow rate, ΔP is pressure drop across the valve, and S.G. is fluid-specific gravity. The calculation of Cv depends on whether the fluid is incompressible, compressible, or mixed-phase. Valve manufacturers provide actual valve flow capacities in terms of Cv for various valve sizes and types. The valve should operate in the 10–80% range of its stroke range; otherwise, it is difficult to control the valve. System geometry, pipe size and schedule number, and materials of construction must be specified. The maximum flow rate should include a minimum design margin of 10%. The pressure drop through a valve should be greater than 1 bar at the rated flow rate in a pumped system. The size of the control valve should be one size smaller than the line size since the pressure drop due to reduced size helps it attain the correct Cv.
The fluid flowing through a valve or a flow restriction gets accelerated to some maximum velocity with corresponding minimum pressure downstream of the restriction where the cross-section area is minimum (vena contracta). This increase in velocity or kinetic energy occurs at the expense of the pressure or potential energy. If the pressure is lower than the liquid vapour pressure, flashing occurs, producing bubbles or cavities of vapour. The pressure rises or recovers downstream of the vena contracta. If the pressure exceeds the vapour pressure, the bubbles or cavities collapse, causing noise similar to gravel flowing through a line, vibration, loss of efficiency and physical damage. These gas pockets collapse violently; the resulting shock waves can generate impact pressure greater than 10,000 bar. The key to preventing damage due to cavitation is to avoid a sudden pressure recovery when the fluid emerges from the throat of the valve. Accelerating the fluid gradually maintains sufficient pressure to avoid cavitation. The initiation of cavitation can also be delayed by installing an orifice plate downstream of the valve. This builds up a back-pressure on the valve resulting in ΔP that is below the cavitation threshold. Orifice plates are useful in processes with fairly constant flow.
6.11 Materials Properties
The key issue in selecting materials of construction for high purity plants such as pharmaceutical and semiconductor plants is contamination. Selecting the most suitable materials – stable and cost-effective – for equipment and piping is a complex and critical issue, e.g. in the case of seawater desalination plants.
6.11.1 Stainless steel
Stainless steel refers to steel alloys with a minimum chromium content of 10.5% that forms a thin chromium oxide film on the steel’s surface to improve corrosion resistance, which makes the steel “stainless.” Other alloying elements typically include nickel and molybdenum to improve materials properties, e.g. fabrication.
Type 304 and 316 stainless steel are used in the high-pressure pipes and pipe fittings in RO plants. The 300 series SS are also sensitive to chlorides at a pH of 6.5–8 and at temperatures below 60°C. Type 316 SS tolerates chlorides up to 1000 ppm, but concentrations can reach 26,000 ppm in dry zones (for MgCl2), resulting in failure. In seawater RO desalination plants, duplex (2205) or super-duplex (2507) steels are used instead of 316 SS. The compositions of these steels are detailed below [25]:
• 304 SS: Contains 18% chromium and 8% nickel. It has good general corrosion resistance in moderately oxidising environments.
• 316 SS: Contains 16% chromium, 10% nickel and 2% molybdenum. Molybdenum increases corrosion resistance and improves chloride pitting resistance.
• 2205 SS: Duplex 2205 is an austentic–ferritic (duplex) stainless with 22% chromium, 4.5% nickel and 3% molybdenum with superior corrosion resistance lessthan 316. Its design strength is much higher than 316 L, often permitting lighter wall construction.
• 2507 SS: Contains 25% chromium, 7% nickel and 4% molybdenum. It is ideal for applications requiring exceptional strength and corrosion resistance. It has excellent resistance to chloride stress corrosion cracking and pitting and crevice corrosion.
Type 316 L is the preferred material of construction in pharmaceutical and other HPW plants. It contains about 70% iron and has less than 0.03% carbon (L is for low carbon). The rust deposits formed on SS surfaces are thin, called “rouge” due to their reddish-brown hue. Rouging is the result of dissolved ferrous ion (Fe2 +) oxidising to the insoluble ferric iron (Fe3 +) in the presence of oxygen and precipitating as either Fe2O3 or Fe(OH)3. One gram of iron will cover an area of 390 m2, three atoms deep [26]. Oxygen can enter a system through pump seals or by diffusion-sorption through plastics, as discussed in Chapter 1.
There are three types of rouge: (a) Type I is due to the dissolution of steel such as in the case of pump impellers; (b) Type II results from active corrosion, e.g. on non-stainless steel components; and (c) Type III is due to high temperature. Passivation is used to remove rogue, but it does not prevent Type I and III rogue from reoccurring if oxygen permeates the system. Type II rogue is usually the result of improper welding that leaves a heat-affected zone near the weld. Type II attacks the heat-affected zone only. Rogue can be avoided by using the thermoplastics discussed in Section 6.11.2. However, plastics are permeable to gases such as O2, N2, He, H2, and CO2 as well as many solvents. This permeability results in “blistering” behind plastic-lined vessels and pipes over time.
6.11.2 Plastics
Unlike stainless steel, the properties of plastics vary depending on the type of polymer. Polymers are substances formed by linking one or more species of atoms or groupings of atoms by covalent bonds. The method and type of linking converts simple molecules into macromolecular structures that determine the chemical and physical properties of the synthesised polymer. Polymer properties depend on many factors such as polymer chain length and conformation, cross-linking of chains, intense polar interactions and the type and size of attached side groups, to name a few controlling factors. For example, branched polyethylene (PE) has a lower melting point than linear PE even though they are chemically identical. For additional information refer to “Glass transition temperature” and “Thermoplastics” in the Glossary section.
Commonly used thermoplastics such as PE, polyvinyl chloride (PVC) and polypropylene (PP) are less costly than fluoropolymers, e.g. polyvinylidene fluoride (PVDF), but do not perform as well in high temperature conditions. They also include plasticisers, heat stabilisers and fire retardants that can leach out. PVDF in its virgin form is highly pure and does not contain additives.
Fluropolymers such as PVDF and perfluoroalkoxy (PFA) have excellent chemical resistance to deionised water, high thermal stability and are resistant to degradation by sunlight. They have a low coefficient of friction unlike metal surfaces, thereby preventing microorganisms (fungi and bacteria) from growing. This is critical since unlike chemical plants, biocides cannot be added to HPW to prevent microbial growth. PFA polymer can be used at temperatures up to 260°C. However, it is highly expensive, and PVDF is the preferred material. PVDF is the main competitor of 316 L SS in HPW systems and is widely used in high purity fluid loops in semiconductor plants. PVDF is among the hardest fluoropolymers and has the highest tensile strength of all plastics. It also has better abrasion strength than SS.
Since PVC and PP have low melting temperatures (< 90°C), components using these materials can only be sterilised by chemicals such as hydrogen peroxide and chlorine, both of which require rinsing after sterilisation. The melt temperature of PVDF, on the other hand, is 178°C, which makes it amenable to steam sterilisation. PVDF can also be sterilised by ozone. Since ozone has a short half-life (minutes), PVDF systems do not need rinsing after sterilisation.
6.11.3 SS vs. plastics
Stainless steel is impermeable to oxygen unlike plastics; it has 10 times the thermal conductivity of plastics and does not creep at temperatures below 425°C (at room temperature for plastics). SS pipes can withstand high pressures (up to 110 bar for a 25 mm O.D. 300-series SS pipe vs. 5 bar for plastic pipe). Its yield and tensile stresses are an order of magnitude greater than those of thermoplastics.
6.12 Process Validation
Membrane plants used for producing HPW in pharmaceuticals manufacture require validation like other equipment and processes. The FDA has defined process validation as “establishing documented evidence which provides a high degree of assurance that a specific process will consistently produce a product meeting its predetermined specification and quality attributes.” In other words, validation involves detailed testing and documentation of system equipment and components and system functional operation to ensure that design and regulatory specifications are met and that system performance will be consistently acceptable during service.
Process validation is part of current good manufacturing practices (cGMPs) and is required in the US and EU for a manufacturing license. It involves the identification, monitoring, and control of sources of variation that can contribute to changes in the product. Process development normally involves identifying critical variables, defining set points for each unit operation, and establishing operating ranges. Cleaning validation shows the ability of cleaning procedures to allow reuse of processing components and equipment without deterioration of product quality.
In the case of pharmaceutical plants, a HPW system must comply with the rules of the US Food and Drug Administration (FDA) as stated in the 21 CFR (Code of Federal Regulations), Parts 210, 211 and 820. According to the FDA regulatory code, validation implies “the conformation by documented examination and provision of objective evidence that the particular requirements for a specific intended use can be consistently fulfilled.” These regulations specify minimum cGMP. Compliance, which must be validated, ensures that drugs meet the requirements of safety, identity, strength, quality and purity.
The system validation documentation includes but is not limited to Quality Assurance Plan (QAP), Operation and Maintenance Manual (O&M), and Factory Acceptance Test (FAT) reports. A properly developed QAP and its supporting documentation help to reduce cost, boost product quality, ensure regulatory compliance and increase profitability. The FAT validation is the first verification step of the customer’s validation process, which may include design qualification (DQ), installation qualification (IQ), operational qualification (OQ), and performance qualification (PQ).
6.13 RO/NF Feed Water Analysis
Feed water constituents must be analysed prior to designing a membrane system. The ASTM Designation D4195-88 “Standard Guide for Water Analysis for Reverse-Osmosis Applications” for components and properties that require analysis is given below. Water treatment processes are discussed in Chapter 2.
Carbon dioxide (CO2) is not rejected by RO/NF membranes. If it is the major dissolved constituent in the permeate, it will increase the ionic load on downstream ion-exchange polisher anion resins.
Free chlorine (Cl2) is an oxidant. Polyamide RO and NF membranes are sensitive to chlorine. Hence, water must be dechlorinated by passing it through an activated carbon filter or by the addition of a reducing chemical such as sodium sulphite, sodium bisulphite, or sodium metabisulphite to feed water. However, it is necessary for CA membranes to protect them from bacterial attack.
Hydrogen sulphide (H2S) is not present in chlorinated water supplies because it is quickly converted to sulphite. It is, however, associated with some sub-surface water supplies that have been depleted of oxygen. H2S forms sulphur particles in the water and contribute to membrane fouling. Sulphide ion may form insoluble metal sulphides.
Langelier Saturation Index. See Section 6.14.
Oxygen (O2) is indicative of the character and source of the water supply. Water depleted in oxygen/air is likely to contain soluble iron, manganese and hydrogen sulphide, often in appreciable quantities. When oxygen is added to such a water supply, precipitates (e.g. ferric compounds) are formed.
Silt Density Index. See Glossary.
Silica. The solubility of silica (SiO2) is a function of pH and temperature. Exceeding the saturation level in cold water (< 10°C) is not a serious problem because the precipitation is very slow. However, exceeding 120 ppm in any temperature presents a potential problem. Since water supplies often contain > 20 ppm silica, silica very often limits recovery. Precipitated silica is virtually impossible to remove from the elements and must be avoided. Metal hydroxides (e.g. iron, aluminium, magnesium) absorb or complex silica and catalyse the precipitation.
Turbidity. See Glossary.
Bicarbonate (HCO3−) results from the chemical decomposition of dissolved CO2 with the hydroxide ion in water. A portion of the bicarbonate present in the feed water can be converted to carbonate as a result of pH changes owing to concentration of salts on the concentrate side of the membrane. Such cases require the addition of acid or a crystal growth inhibitor to avoid calcium carbonate scaling.
Carbonate (CO32−) forms a sparingly soluble salt with calcium, which readily fouls RO membranes. Calcium carbonate can easily be removed by lowering the pH below 5.0 or raising the pH above 8.0.
Chloride (Cl−) does not generate insoluble salts. Because it passes through RO membranes more easily than most anions, it is one of the predominant ions in the permeate.
Fluoride (F−) forms insoluble salts with divalent metal ions such as calcium, magnesium, barium and strontium.
Nitrate (NO3−) is similar to chloride in that it is not aggressive to the membrane nor does it tend to form insoluble salts.
Phosphate (PO43−) forms a low solubility salt with calcium. Water containing phosphate generally requires the addition of an antiscalant.
Sulphate (SO42−) forms a sparingly soluble salt with calcium, strontium, or barium. Sulphate does not usually limit the cycles of concentration, unless one or more of these three cations are present in high concentrations.
Aluminium (Al3 +) is generally found as the hydroxide, which causes particulate fouling of the RO membrane. Aluminium-based compounds such as sodium aluminate and aluminium sulphate are common coagulants used in potable water treatment. Under proper circumstances, the aluminium precipitate formed in the water treatment plant is completely filtered. Occasional fluctuations in pH can cause excessive amounts of dissolved Al3 + to pass into the distribution system.
Barium (Ba2 +) forms a low solubility compound with sulphate ion. Strontium and barium tend to occur together (see Strontium).
Calcium (Ca2 +) forms insoluble or slightly soluble salts with common ions such as carbonate and sulphate. Both can be adequately controlled through crystal growth inhibitors or, if the precipitate is allowed to form, can readily be removed by cleaning the RO membrane. Calcium concentration, in conjunction with alkalinity and sulphate concentration, often establishes the upper limit to the water recovery of the RO system.
Iron is generally present in the dissolved ferrous (Fe2 +) form, but can oxidise to the ferric (Fe3 +) state and precipitate as the hydroxide. Municipal potable water supplies contain < 0.3 ppm of iron, but sub-surface supplies may contain levels of iron in excess of 10–20 ppm. Prior to use in an RO system, a water supply containing iron should be treated to remove the iron, or steps should be taken to avoid contact of the water with air or oxidising substances such as chlorine.
Magnesium (Mg2 +) forms sparingly soluble salts such as magnesium silicate and, under high pH conditions, magnesium hydroxide. Both are uncommon in RO systems.
Manganese (Mn2 +) like iron is usually at levels of less than 0.3 ppm in public water supplies. Private well water supplies often contain higher manganese levels, often in a dissolved form, which precipitates on exposure to air. A well water supply containing manganese should be pre-treated, or steps should be taken to eliminate contact with air or oxidants to assure the manganese remains soluble.
Potassium (K+) is present in small quantities. It is soluble like sodium, and no operating or fouling problems are caused by potassium.
Sodium (Na+) forms relatively soluble salts with most anions, including bicarbonate, sulphate and chloride, and thus seldom presents a fouling issue. However, since the cation passes most readily through the RO membrane, it is present at the highest concentrations in the permeate. It generally controls overall salt rejection.
Strontium (Sr2 +) is found in less than 20% of water supplies. It forms a salt with sulphate ion that is soluble up to 1 ppm in concentration. It is kept in suspension with a crystal growth inhibitor.
When the feed water is secondary effluent from a municipal plant, analyses of total oil, grease and surfactants are also required.
6.14 Chemistry of Feed Water Treatment in Membrane Plants
6.14.1 Mineral precipitation
Conditions within an RO unit are typically not at equilibrium with respect to supersaturated ion precipitation. Hence, it may be feasible, depending on the feed water chemistry, to operate RO units under supersaturated conditions when precipitation kinetics are substantially lower than the residence time in the RO system. Ideally, this requires the use of short flow-path membrane elements, as shown in Figure 1.24.
As amply discussed in previous chapters, product water recovery (< 75%) in brackish water RO systems is constrained by the solubility of sparingly soluble salts. Precipitation of BaSO4 (barite), CaSO4 (gypsum), SrSO4 (celestite), CaCO3 (calcite), CaMg(CO3)2 (dolomite) and silica are generally the most critical. Additionally, MgCO3 may precipitate instead of CaMg(CO3)2. High RO recoveries (80–90%) are achievable, depending on feed water chemistry, by using a brine RO/NF system with or without intermediate chemical treatment such as lime softening or caustic soda [27]. Addition of Ca(OH)2 (hydrated lime) generates twice the amount of CaCO3 solids as NaOH (caustic soda), although it is half as expensive.
Raising the pH to 10.3 by adding Na2CO3 (soda ash) promotes the precipitation of non-carbonate hardness resulting in the highest removal of Ca2 + and Sr2 +, whereas adding Ca(OH)2 and Na2CO3 aids in the removal of Ba2 +, Mg2 + and silica. When the pH is 10.3, barium, magnesium and strontium can co-precipitate with CaCO3. The principal sink for Ca2 + can also be CaSO4 and CaMg(CO3)2, and the principal sink for Mg2 + can also be MgSO4.
6.14.2 Calcium carbonate chemistry
Calcium carbonate (CaCO3) is a common scale component in desalination plants because of its very low solubility; 18 mg/l in pure water at 15°C. The solubility product of CaCO3 is 8.7 × 10− 9 at 15°C, which is one of the lowest among sparingly soluble salts. See Table 6.9.
Relatively high concentrations of calcium and carbonate in natural waters result from the composition of geological formations in aquifers. Calcium carbonate exists in three different crystalline forms in the order of increasing solubility: calcite, aragonite and vaterite. Calcite is thermodynamically the most stable polymorph of CaCO3 and forms tenaciously adhering hard mineral deposits. Vaterite is the least stable and tends to transform to aragonite or calcite. The presence of foreign ions or impurities has a destabilising influence; for example, Mg2 +, Ni2 +, Co2 +, Fe2 +, Zn2 +, and Cu2 + encourage aragonite formation over calcite. Magnesium has the strongest influence on CaCO3 precipitation, favouring the formation of aragonite or vaterite over calcite [28]. In the absence of additives and over a range of temperatures up to 80°C, a mixture of all three polymorphs exists. The presence of Mg2 + favours the stabilisation of aragonite, while organic compounds tend to stabilise the formation of vaterite.
Total hardness comprises all divalent salt ions in solution (mainly calcium and magnesium), while carbonate hardness is the fraction of total hardness that relates to dissolved CO2. The actual concentration of dissolved Ca2 + (or Mg2 +) in water depends on the availability of CO2, which solubilises CaCO3 (MgCO3) according to the equation:
A concentration of CO2 corresponding to its partial pressure yields a carbonate hardness of about 100 mg/l (2 meq/l). Scale inhibitors such as polymeric phosphates can sustain a concentration of 250 mg/l. WHO hardness recommendation for drinking water is 2 meq/l (max.) and a permissible total hardness of 10 meq/l (max.). Carbonate hardness is reduced by the addition of lime, Ca(OH2), which precipitates CaCO3, as discussed under lime softening in Chapter 2.
The ratios of carbonate containing species in aqueous solution are a function of pH value as depicted by the well-known carbonate speciation curve (Figure 6.13). Aqueous carbon takes on three different forms depending on the acidic or basic nature of the water. At pH ~ 4.3, the concentration of bicarbonate (![]() ) is 1% of the dissolved CO2, and neutralisation of carbonate (
) is 1% of the dissolved CO2, and neutralisation of carbonate (![]() ) is virtually complete. Alkalinity is, thus, related to carbonate hardness, specifically to
) is virtually complete. Alkalinity is, thus, related to carbonate hardness, specifically to ![]() concentration. It is controlled or destroyed by the addition of acid with simultaneous generation of CO2:
concentration. It is controlled or destroyed by the addition of acid with simultaneous generation of CO2:
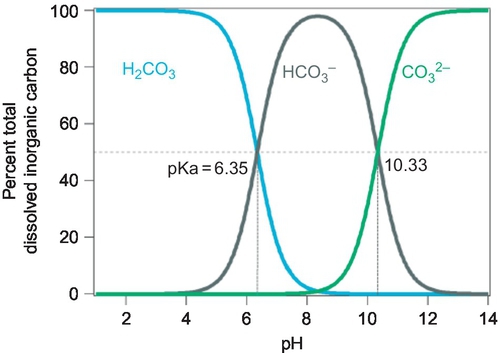
Acidification is followed by aeration (decarbonation) to remove excess CO2. This is a common pre-treatment step in desalination plants to prevent carbonate scaling and reduce hardness. LSI and S&DSI should be less than 2.0–2.5 to reduce acid treatment.
Desalinated water is soft and acidic regardless of the process used. Soft waters are aggressive (corrosive). For example, RO permeate (desalinated water) is virtually devoid of hardness-producing ions (essentially Ca2 + and Mg2 +), resulting in CO2-enriched RO permeate (CO2 is not rejected by the membrane) and softened water (enriched in monovalent ions), whereas distilled water is virtually ion-free, devoid of all saline constituents. Decarbonation after acidification, therefore, is necessary to remove any excess dissolved CO2 beyond required to keep Ca2 + and other hardness ions in solution because excess CO2 acts like a mineral acid (carbonic acid), particularly in the presence of oxygen and corrodes ferrous pipes and equipment. Excess CO2 also destroys the beneficial effects of the corrosion-protective mineral layer formed on steel pipes. The protective layer consists of crystalline CaCO3 and FeCO3. Hence, raising the pH value and remineralisation are essential. For example, desalinated water for drinking requires raising the pH to 8.0 and remineralisation with lime to up to 150 mg/l CaCO3. The minimum remineralisation requirement for bulk transport of desalinated seawater is 35 mg/l CaCO3.
Remineralisation with Ca(OH)2 or CaCO3 is commonly practiced. Use of limestone “beads” in a packed bed is the simplest process; demineralised water flows through the bed from the top resulting in dissolution of the calcite. The pH, alkalinity (![]() ) and hardness (Ca2 +) of the processed water are increased. The calcite dissolution process is given by:
) and hardness (Ca2 +) of the processed water are increased. The calcite dissolution process is given by:
Limestone is a sedimentary rock primarily composed of calcite and sometimes aragonite. This calcite can be pure in composition (CaCO3) or contain low levels of magnesium forming magnesium calcite (see Table 6.6).
6.14.3 Procedure for calculating LSI value
The scaling tendency of a given feed water is often evaluated using the Langelier Saturation Index (LSI) for brackish water and the Stiff and Davis Stability Index (S&DSI) for seawater (LSI is acceptable for seawater). LSI and S&DSI are defined below:
where pHS = pH level at which the water is in equilibrium with calcium carbonate; pCa = –log10 of calcium concentration (mol/l); pAlk = –log10 of total alkalinity (mol/l); pK2 = –log10 of ionisation constant of HCO3; pKS = − log10 of the solubility product of calcium carbonate; and K = the ionic strength constant at 25°C.
LSI value guidelines are:
• when LSI > 0, water is supersaturated with respect to CaCO3.
• when LSI < 0, CaCO3 scale does not deposit, or if present, it will dissolve.
• when LSI is 0, the water is at a saturation state. As a result no scale is anticipated while corrosion is negligible.
A quick and ready way to determine the LSI of water in the field is to access the following web site: http://www.lenntech.com/calculators/Langelier/index/Langelier.htm. Plug the following values – pH, temperature, TDS (or conductivity), calcium ion General loan assistance (800) 243-7552 and bicarbonate ion – into the Lennentech data input Table 6.3, and the programme will calculate the LSI value. Conversion from ion to CaCO3 basis is as follows:
Table 6.3
Lennentech data input table for LSI valuea
 |
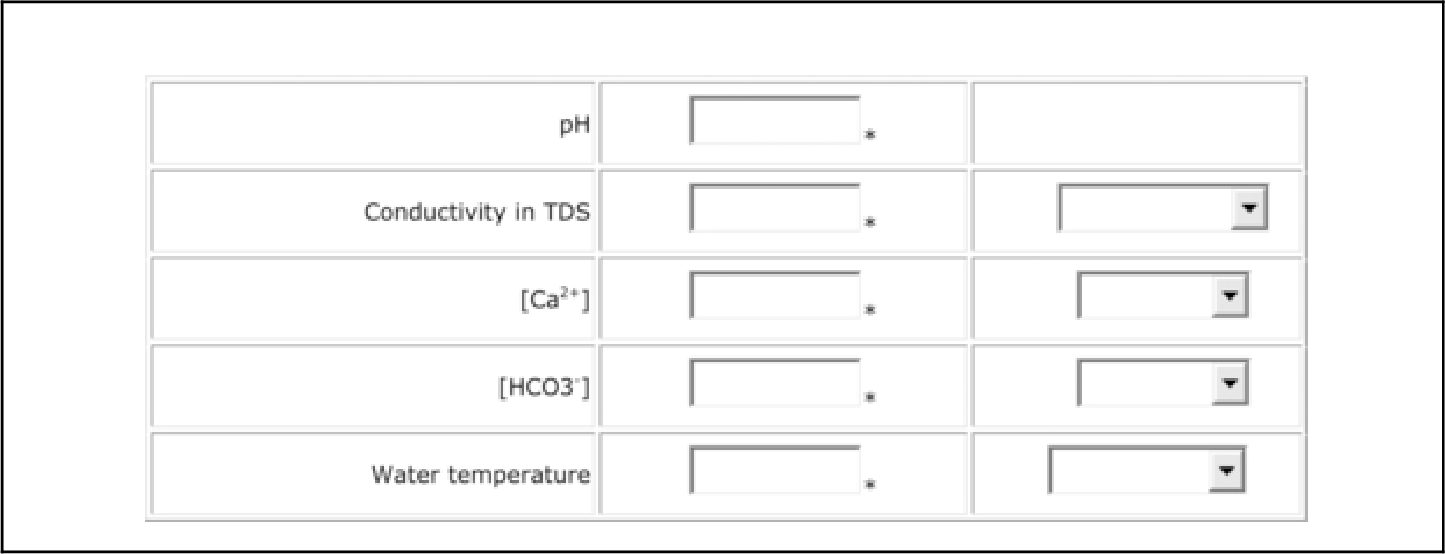
a http://www.lenntech.com/calculators/Langelier/index/Langelier.htm.
• Bicarbonate alkalinity as CaCO3 = HCO3 as ion × 0.82. Thus, when the HCO3 value is 100 mg/l as ion, bicarbonate alkalinity is 82 mg/l as CaCO3.
• Calcium as CaCO3 = Ca as ion × 2.5. Thus, when the Ca value is 100 mg/l as ion, Ca hardness is 250 mg/l as CaCO3.
• Magnesium as CaCO3 = Mg as ion × 4.1. Thus, when the Mg value is 100 mg/l as ion, Mg hardness is 410 mg/l as CaCO3.
6.14.4 Silica and boron removal
Weak acids and undissociated compounds such as silica and boron are poorly rejected by RO membranes at pH < 8.0. For example, boron exists as a weakly dissociated boric acid, H3BO3 at pH < 8.2. Silica dissolves in water forming weakly ionised silicic acid, which in alkaline conditions dissociates from silicates. At pH > 9.0 silica and boron get ionised with substantial increase in solubility resulting in higher rejection:

At high pH values silica rejection also increases due to the molecule structure changing from silicic acid to orthosilicate, which is associated with six water molecules making a larger molecule resulting in higher rejection. Similarly, boron rejection levels are enhanced at high pH levels when the boron changes from boric acid to its salt; %rejection changes from approximately < 30% to > 90%. When a double-pass RO system is used, silica can be reduced from 10 ppm to < 1 ppb, boron from 12 ppb to < 100 ppt and TOC from 2 ppm to < 5 ppb [29].
The high efficiency reverse osmosis (HERO™) process is used for enhanced rejection of silica and boron in SWRO and HPW applications [30]. The process is capable of high rejection of silica, TOC and boron with RO. Further, organic cleaning is minimised at high pH levels, akin to operating the RO unit in a continuous cleaning mode.
The central premise of the HERO process is the removal of all hardness in RO feed water so that RO can be operated at a high pH where silica is highly soluble. Opex is, however, 60–70% higher than RO alone. The HERO™ technology consists of three basic processes operating in series:
• Weak acid cation (WAC) ion exchange for removing hardness associated with alkalinity;
• Degasification for removing CO2 resulting from alkalinity removal as a result of acid addition to lower the pH;
• RO operation at high pH (10.0–11.0) with caustic soda General loan assistance (800) 243-7552 which results in increasing the silica solubility to 1500 ppm.
6.15 Wastewater Treatment
6.15.1 Common constituents in wastewater
The most common constituents of wastewaters and their treatment methods are listed below:
1. Oil and grease – induced gas flotation (IGF), dissolved air flotation (DAF), membrane filtration
2. Suspended solids (turbidity) – IGF, DAF, coagulation + media filtration, membrane filtration
3. Hardness – chemical softening, IX, NF softening, scale inhibitors
4. Alkalinity – chemical softening, acidification, IX
5. Silica – chemical softening, IX, scale inhibitors
6. Iron/manganese – oxidation, greensand filtration, iron filter, aeration
7. Organic compounds – activated carbon, UV irradiation, chemical oxidation, biological treatment, NF
8. Ammonia – aeration, biological treatment
9. Hydrogen sulphide – chemical oxidation, biological treatment, aeration
10. Dissolved gases – aeration, membrane contactors (decarbonation)
11. VOCs – activated carbon, air stripping
12. Dissolved salts – thermal desalination, RO
Treatment of produced and flowback wastewaters is extremely challenging because of its composition and toxicity. The salinity range is 8000–200,000 ppm [31].
• Organic compounds: Aliphatic, aromatic, polar compounds, e.g. fatty acids, oil, grease, benzene, phenol, napthenic acids
• Inorganic compounds: Na+, K+, Ca2 +, Mg2 +, Cl−, ![]() ,
, ![]() , silicates, borates, selenium, heavy metals
, silicates, borates, selenium, heavy metals
• Production chemicals: Emulsion breakers to improve oil/water separation, surfactants, corrosion inhibitors
• Ammonia, hydrogen sulphide, iron reducing bacteria and sulphur-reducing bacteria.
SAGD (steam-assisted gravity drainage) produced water has a high level of silica (200–300 mg/l), and soluble organics, mostly humic acid and asphaltenes. The TDS is typically < 20,000 mg/l.
6.15.2 Trace contaminants in wastewater
Trace contaminants are chemicals that can be harmful to human health and the biotic environment because of their physicochemical toxicological properties, and are, hence, undesirable in water bodies [32]. In the aquatic environment, they are present at trace levels, usually in the μg/l (ppb) range or less. While coagulants preferentially remove larger molecular weight compounds, which tend to be more hydrophobic, it is more difficult to remove the smaller and more hydrophilic compounds by chemical means. Increasing demand for water leads to the exploitation of resources of lower water quality that are not suitable for conventional treatment. Membrane technologies offer a more reliable solution, e.g. NF is being increasingly used to retain organics and treat coloured or tainted waters.
Most trace contaminants are of anthropogenic origin. A variety of synthetic organics are produced in a substantial quantity such as pesticides, pigments, dye carriers, preservatives, pharmaceuticals, refrigerants, propellants, heat transfer media, dielectric fluids, degreasers, lubricants, etc. These compounds are collectively known as synthetic organic compounds. The production of such chemicals may entail the introduction of byproducts and their metabolites, some of which are far more detrimental to human health and the environment than the parent compounds. The majority of wastewater organic compounds are the remnants of biological treatment and tend to be lower in molecular weight and aromaticity than organics found in natural waters. These compounds are also referred to as effluent organic matter (EfOM). Further, such compounds may be less biologically degradable partly due to their binding capacity to organic matter and contain a large number of trace organics.
Some trace organics such as pesticides, trihalomethanes (THMs), polychlorinated biphenols (PCBs) and polyaromatic hydrocarbons (PAHs) are regulated. That is their maximum contamination levels are enforceable by a regulatory authority. However, many compounds have not yet been regulated. Treatment processes for removing trace amounts of arsenic and nitrates in ground waters are discussed in Chapter 3. Carbon filtration is used to remove metal ions, particularly cadmium, hexavalent chromium, silver and selenium as well as uncharged species such as arsenic and antimony from acidic streams. It is also used to remove any traces of hydrocarbons and chloramines. Biological methods are used to remove methanol, which is not rejected well by RO. Methanol is a highly miscible solvent in water, and it is virtually impossible to remove it to < 10 ppm even with steam stripping.
6.16 Conversion Factors
Area:
1 m2 = 104 cm2 = 10.764 ft2
1 cm2 = 0.0011 ft2 = 0.1550 in.2
Density:
Diffusivity:
1 m2/s = 3.875 × 104 ft2/h
Flux:
1 gal/ft2/day = 1.7 l/m2/h (lmh)
Force and pressure:
1 kg m/s2 = 1 N
1 bar = 105 Pa = 105 N/m2 = 14.5 psi (lb/in.2)
1 psi (lbf/in.2) = 6.8947 kPa = 6.8947 × 10³ N/m2
1 psi = 2.036 in. Hg = 51.715 mm Hg
1 psi = 6.8947 × 10⁴ g/cm/s2 = 6.8947 × 10⁴ dyne/cm2
1 atm = 14.696 psi = 1.01325 bar = 101.3251 kPa = 760 mm Hg = 33.9 ft water
1 dyne/cm2 = 2.0886 × 10− 3 lbf/ft2
1 kPa = 0.1450383 psi
1 kgf/cm2 = 14.2234 psi
Length:
1 Å = 10− 10 m = 10− 4 μm = 0.1 nm
1 in. = 2.54 cm
1 m = 39.37 in.
1 μm = 10− 6 m = 10− 4 cm
1 mil = 0.001 in. = 25.4 μm
1 nm = 10 Å = 10− 9 m
Mass:
1 lb = 8.3454 gal (US)
1 ton, short (US) = 2000 lb
1 ton, long = 2240 lb
1 kg = 2.2046 lb
1 ton, metric = 1000 kg
1 grain (gr) = 17.1 ppm per gallon
1 lb of any substance dissolved in 1000 gal ~ 120 ppm
1 quart of any substance dissolved in 1000 barrels ~ 6 ppm
Mass transfer coefficient:
1 ft/h = 8.4668 × 10− 5 m/s
Power, work, and energy:
1 hp = 0.7457 kW = 550 ft lb/s = 0.7068 Btu/s
1 W = 14.3 cal/min
1 J/s = 1 W
1 Btu = 1055.06 J
1 kcal = 4.1840 kJ
1 hp h = 0.7457 kWh = 2544 Btu
1 ft lbf = 1.35582 J
1 kWh/m3 = 3.788 kWh/kgal
Temperature:
T (°C) = [T (°F) − 32]/1.8
Velocity:
1 m/s = 3.281 ft/s
Viscosity:
1 cP = 0.01 poise = 10− 3 Pa s = 10− 3 N s/m2
1 lb/ft/s = 1488.16 cP
1 cP = 2.4191 lb/ft/h = 6.72 × 10− 4 lb/ft/s
Volume:
1 gal (US) = 4 quarts (qt) = 3.78541 l
1 gal (Imperial) = 1.20094 US gal
1 barrel = 42 US gal
1000 barrel/day = 29.2 gpm
1 acre-foot = 325,853 US gal
1 acre-foot = 1233.5 m3
1 m3 = 1000 l = 264.17 US gal
1 m3/h = 4.4 gpm
1 in.3 = 16.387 cm3
1 ft3 = 28.317 l
1 l = 1000 cm3
Molar concentration – TDS – conductivity chart (NaCl, 25°C):
• Conductivity < 5000 μS/cm: TDS = conductivity × 0.5
• Conductivity 5000–40,000 μS/cm: TDS = conductivity × 0.64
• Conductivity > 40,000 μS/cm: TDS = conductivity × 0.79
• Seawater: 500 mM ⋍ 30,000 mg/l
• Brackish water: 170 mM ⋍ 10,000 mg/l
• Potable water: 10 mM ⋍ 600 mg/l
• Drinking water: 3 mM ⋍ 180 mg/l
6.17 Physical and Chemical Data
Table 6.4
Viscosity and density data
| Fluid | Viscosity, μ (kg/m/s) | Density, ρ (kg/m3) |
| Air | 0.00002 | 1.3 |
| Water | 0.001 | 1000 |
| Glycerine | 1.8 | 1000 |
| Golden syrup | 120 | 1000 |
Table 6.5
Standard cleaning solutions for water treatment heat exchangers
| Foulant type | Cleaning solution |
| Encrustation – scaling | |
| Calcium carbonate; calcium sulphate, silicates | Nitric acid, sulphamic acid, citric acid, phosphoric acid, complexing agents (EDTA, NTA), or sodium polyphosphates (< 4% by wt; < 60°C) |
| Sediment | |
| Corrosion products; metal oxides; silt; alumina; diatomic organisms and their excrement of various colours | Nitric acid, sulphamic acid, citric acid, phosphoric acid, complexing agents (EDTA, NTA), or sodium polyphosphates (< 4% by wt; < 60°C) |
| Biological growth | |
| Bacteria; nematodes; protozoa | Sodium hydroxide, or sodium carbonate plus surfactants (< 4% by wt; < 80°C) |
| Hydrocarbons | |
| Oil residue; asphalt; fats | Paraffin- or naphtha-based solvent (e.g. kerosene)a |

a Note natural, butyl and EPDM gaskets swell in these solvents.
Table 6.6
Common chemicals used to treat water
| Chemical | Common name | Typical specifications | Equivalent weight | Bulk density (lb/ft3 or lb/gal) | Approx. pH (1% solution) | Solubility |
| Aluminium sulphate Al2(SO4)3 · 14H2O | Alum | Lump – 17% Al2O3 | 100a | 60 | 3.4 | 4.2 lb/gal at 60°F |
| Liquid – 8.5% Al2O3 | 11 | |||||
| Bentonitic clay | Bentonite | – | – | 60 | – | Insoluble |
| Calcium carbonate CaCO3 | Limestone | 96% CaCO3 | 50 | 80 | 9 | Insoluble |
| Calcium hydroxide Ca(OH)2 | Hydrated lime Slaked lime | 96% Ca(OH)2 | 40a | 40 | 12 | Insoluble |
| Calcium hypochlorite Ca(OCl)2 · 4H2O | HTH | 70% Cl2 | 103 | 55 | 6–8 | 3% at 60°F |
| Calcium oxide CaO | Burned lime | 96% CaO | 30a | 60 | 12 | Slake at 10–20% |
| Quicklime | ||||||
| Calcium sulphate CaSO4 · 2H2O | Gypsum | 98% Gypsum | 86a | 55 | 5–6 | Insoluble |
| Chlorine(Cl2) | Chlorine | Gas – 99.8% Cl2 | 35.5 | gas | – | 0.07 lb/gal at 60°F |
| Copper sulphate CuSO4 · 5H2O | Blue vitriol | 98% Pure | 121 | 75 | 5–6 | 2 lb/gal at 60°F |
| Dolomitic lime Ca(OH)2 · MgO | Dolomitic lime | 36–40% MgO | 67b | 40 | 12.4 | Insoluble |
| Ferric chloride FeCl3 · 6H2O | Iron chloride | Lump – 20% Fe | 91a | 70 | 3–4 | 45% at 60°F |
| Liquid – 20% Fe | 13 | |||||
| Ferric sulphate Fe2(SO4)3 · 3H2O | Iron sulphate | 18.5% Fe | 51.5a | 70 | 3–4 | 30% at 60°F |
| Ferrous sulphate Fe(SO4)3 · 7H2O | Copperas | 20% Fe | 139a | 70 | 3–4 | 1 lb/gal at 60°F |
| Hydrochloric acid HCl | Muriatic acid | 30% HCl | 120a | 9.6 | 1–2 | 35% at 60°F |
| 20°Baume | ||||||
| Sodium aluminate NaAlO2 | Aluminate | Flake – 46% Al2O3 | 100a | 50 | 11–12 | 40% at 60°F |
| Liquid 26% Al2O3 | 13 | |||||
| Sodium chloride NaCl | Rock salt, salt | 98% pure | 58.5 | 60 | 6–8 | 2.6 lb/gal at 60°F |
| Sodium carbonate Na2CO3 | Soda ash | 98% pure | ||||
| 58% Na2O | 53 | 60 | 11 | 1.5 lb/gal at 60°F | ||
| Sodium hydroxide NaOH | Caustic, Lye | Flake – 99% NaOH | 65 | 12.8 | 70% at 60°F | |
| Liquid – 50–70% | 40 | 12 | ||||
| Sodium phosphate Na2HPO4 | Disodium phosphate | 49% P2O5 | 47.3 | 55 | 9 | 20% at 60°F |
| Sodium metaphosphate NaPO3 | Hexametaphosphate | 66% P2O5 | 34 | 47 | 5–6 | 1 lb/gal at 60°F |
| Sulphuric acid H2SO4 | Oil of vitriol | 94–96% | ||||
| 66° Baume | 50a | 15 | 1–2 | Infinite |
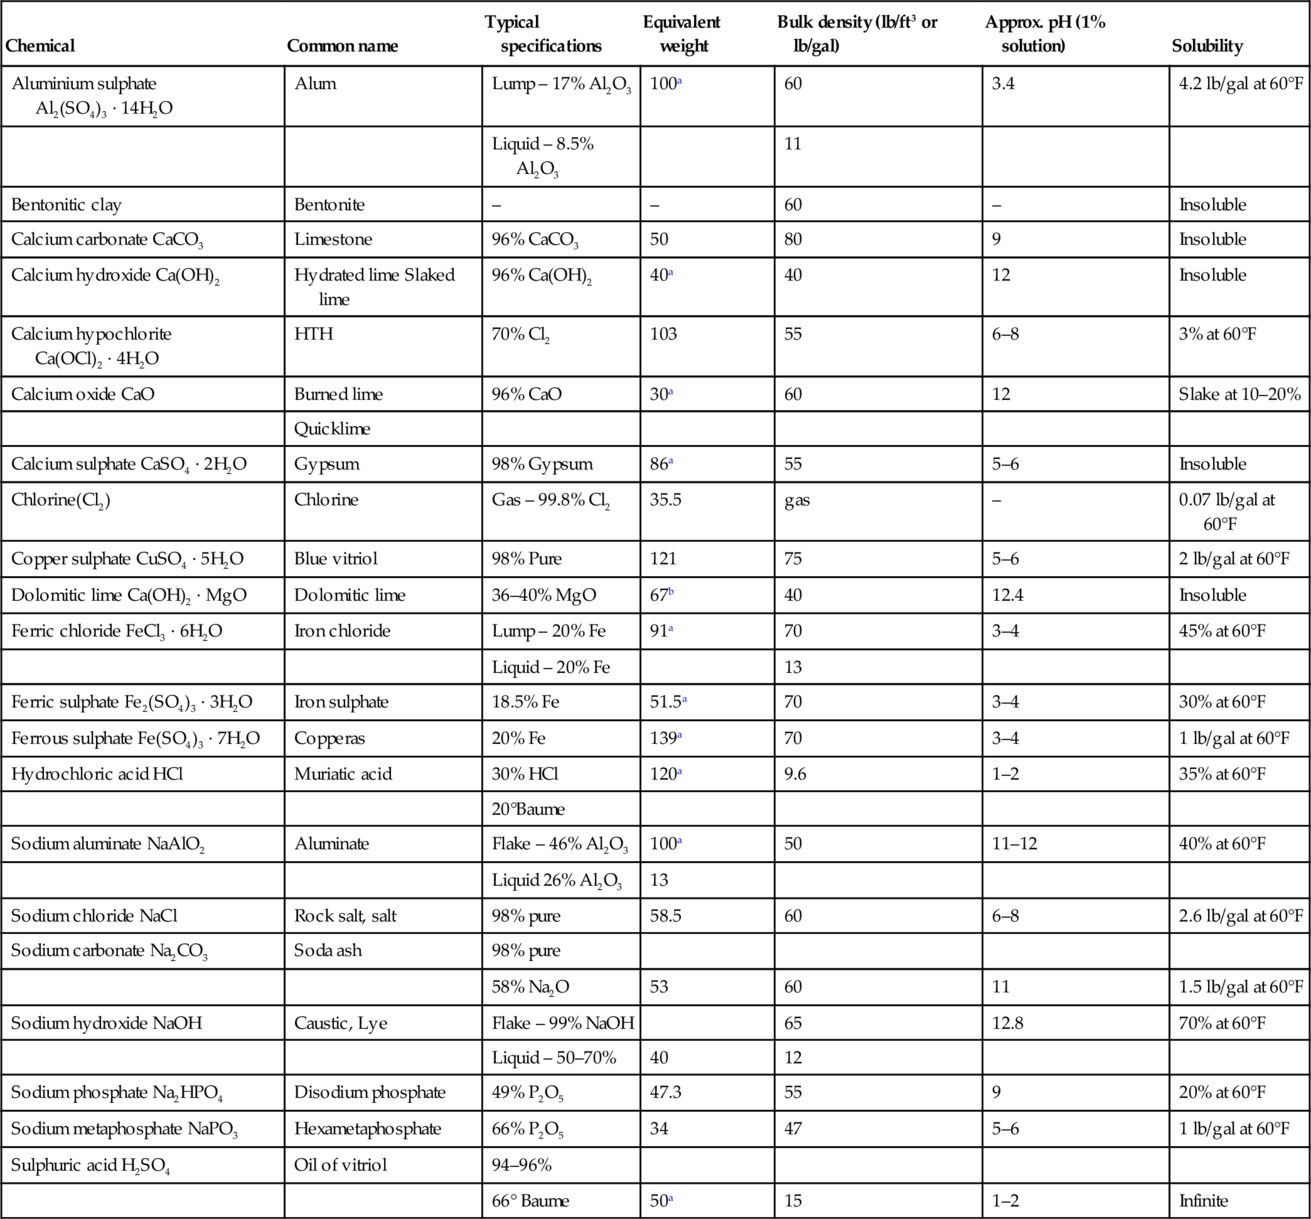
a Effective equivalent weight of commercial product.
b Effective equivalent weight based on Ca(OH)2 content.
Table 6.7
Pre-treatment chemicals used in desalination plants
| Chemical additive | Dosage (mg/l) |
| Chlorine | 0.5–6 |
| Sodium bisulphite | 3–19 |
| Ferric chloride | 0.8–25 |
| Polyelectrolyte | 0.2–4 |
| Sodium hexametaphosphate (SHMP) | 2–10 |
| Polyacrylic acid | 2.9 |
| Phosphonate | 1.4 |
| Sulphuric acid | 6.6–100 |
Table 6.8
Properties of common coagulants
| Coagulant | Advantages | Disadvantage |
| Alum, Al2(SO4)3 · 18H2O | Easy to handle and apply; most common; produces less sludge than lime; pH range 6.5–7.5 | Effective over a limited pH range; adds dissolved solids to water |
| Sodium aluminate, Na2Al2O4 | Effective in hard waters; small dosages typical | Often used with alum; high cost; ineffective in soft waters |
| Polyaluminium chloride (PAC), Al13(OH)20(SO4)2 · Cl15 | Floc formed is more dense and faster settling than alum in some applications | Not often used |
| Ferric chloride, FeCl3 · 6H2O | pH range 4–11 | Adds dissolved solids to water; consumes 2 × alkalinity as alum |
| Ferric sulphate, Fe2(SO4)3 | pH range 4–6 and 8.8–9.2 | Adds dissolved solids to water; usually need to add alkalinity |
| Ferrous sulphate (Copperas), FeSO4 · 7H2O | Less pH sensitive than lime | Adds dissolved solids to water; usually need to add alkalinity |
| Lime, Ca(OH)2 | Very effective; commonly used; may not add dissolved solids to water | Very pH dependent; produces large qty. of sludge; overdose can result in poor effluent quality |
Table 6.9
Calcium carbonate equivalent of common substances
| Formula | Molecular weight | Equivalent weight | Substance to CaCO3 equivalent (multiply by) | CaCO3 equivalent to substance (multiply by) | |
| Aluminium | AI3 + | 27.0 | 9.0 | 5.56 | 0.18 |
| Ammonium | 18.0 | 18.0 | 2.78 | 0.36 | |
| Barium | Ba2 + | 137.4 | 68.7 | 0.73 | 1.37 |
| Calcium | Ca2 + | 40.1 | 20.0 | 2.50 | 0.40 |
| Copper | Cu2 + | 63.6 | 31.8 | 1.57 | 0.64 |
| Hydrogen | H+ | 1.0 | 1.0 | 50.0 | 0.02 |
| Ferric iron | Fe3 + | 55.8 | 18.6 | 2.69 | 0.37 |
| Ferrous iron | Fe2 + | 55.8 | 27.9 | 1.79 | 0.56 |
| Magnesium | Mg2 + | 24.3 | 12.2 | 4.10 | 0.24 |
| Manganese | Mn2 + | 54.9 | 27.5 | 1.82 | 0.55 |
| Potassium | K+ | 39.1 | 39.1 | 1.28 | 0.78 |
| Sodium | Na+ | 23.0 | 23.0 | 2.18 | 0.46 |
| Strontium | Sr2 + | 87.6 | 43.8 | 1.14 | 0.88 |
| Zinc | Zn2 + | 65.4 | 32.7 | 1.53 | 0.65 |
| Bicarbonate | 61.0 | 61.0 | 0.82 | 1.22 | |
| Carbonate | 60.0 | 30.0 | 1.67 | 0.60 | |
| Chloride | Cl− | 35.5 | 35.5 | 1.41 | 0.71 |
| Chromate | 116.0 | 58.0 | 0.86 | 1.16 | |
| Fluoride | F− | 19.0 | 19.0 | 2.63 | 0.38 |
| Iodide | I− | 126.9 | 126.9 | 0.39 | 2.54 |
| Hydroxyl | OH- | 17.0 | 17.0 | 2.94 | 0.34 |
| Nitrate | 62.0 | 62.0 | 0.81 | 1.24 | |
| Phosphate (tribasic) | 95.0 | 31.7 | 1.58 | 0.63 | |
| Phosphate (dibasic) | 96.0 | 48.0 | 1.04 | 0.96 | |
| Phosphate (monobasic) | 97.0 | 97.0 | 0.52 | 1.94 | |
| Sulphate | 96.1 | 48.0 | 1.04 | 0.96 | |
| Bisulphate | 97.1 | 97.1 | 0.52 | 1.94 | |
| Sulphite | 80.1 | 40.0 | 1.25 | 0.80 | |
| Bisulphate | 81.1 | 81.1 | 0.62 | 1.62 | |
| Sulphide | S2 − | 32.1 | 16.0 | 3.13 | 0.32 |

Table 6.10
Solubility product of sparingly soluble salts
| Substance | Formula | Temp. (°C) | Solubility product, Ksp |
| Aluminium hydroxide | Al(OH)3 | 20 | 1.9 × 10− 33 |
| Barium carbonate | BaCO3 | 16 | 7 × 10− 9 |
| Barium sulphate | BaSO4 | 25 | 1.08 × 10− 10 |
| Calcium carbonate | CaCO3 | 25 | 8.7 × 10− 9 |
| Calcium fluoride | CaF2 | 26 | 3.95 × 10− 11 |
| Calcium sulphate | CaSO4 | 10 | 6.1 × 10− 5 |
| Cupric sulphide | CuS | 18 | 3.5 × 10− 45 |
| Ferric hydroxide | Fe(OH)3 | 18 | 1.1 × 10− 36 |
| Ferrous hydroxide | Fe(OH)2 | 18 | 1.64 × 10− 14 |
| Magnesium ammonium phosphate | MgNH4PO4 | 25 | 2.5 × 10− 13 |
| Magnesium carbonate | MgCO3 | 12 | 2.6 × 10− 5 |
| Magnesium hydroxide | Mg(OH)2 | 18 | 1.2 × 10− 11 |
| Manganese hydroxide | Mn(OH)2 | 18 | 4 × 10− 14 |
| Strontium carbonate | SrCO3 | 25 | 1.6 × 10− 9 |
| Strontium sulphate | SrCO4 | 17.4 | 2.81 × 10− 7 |
| Zinc hydroxide | Zn(OH)2 | 20 | 1.8 × 10− 14 |

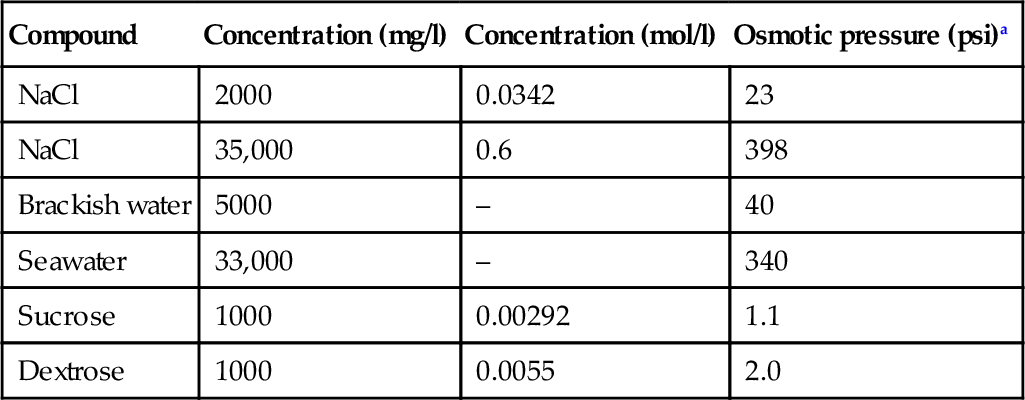
6.18 Membrane Data
Table 6.12
Pore size characteristics of UF membranesa
| MW cutoff Nominal (Da) | Apparent pore dia (nm) | Water flux at 3.7 bar (l/m2/h) | Rejection d-Alanin (%) | Rejection Sucrose (%) | Rejection Myoglobin (%) | Rejection IgM (%) |
| 500 | 2.1 | 17 | 15 | 70 | > 95 | > 98 |
| 1000 | 2.4 | 34 | 0 | 50 | > 95 | > 98 |
| 10,000 | 3.0 | 102 | 0 | 25 | 95 | > 98 |
| 10,000 | 3.8 | 935 | 0 | 0 | 80 | > 98 |
| 30,000 | 4.7 | 850 | – | 0 | 35 | > 98 |
| 50,000 | 6.6 | 425 | – | – | 20 | > 98 |
| 100,000 | 11 | 1105 | – | – | – | > 98 |
| 300,000 | 48 | 2215 | – | – | – | > 98 |
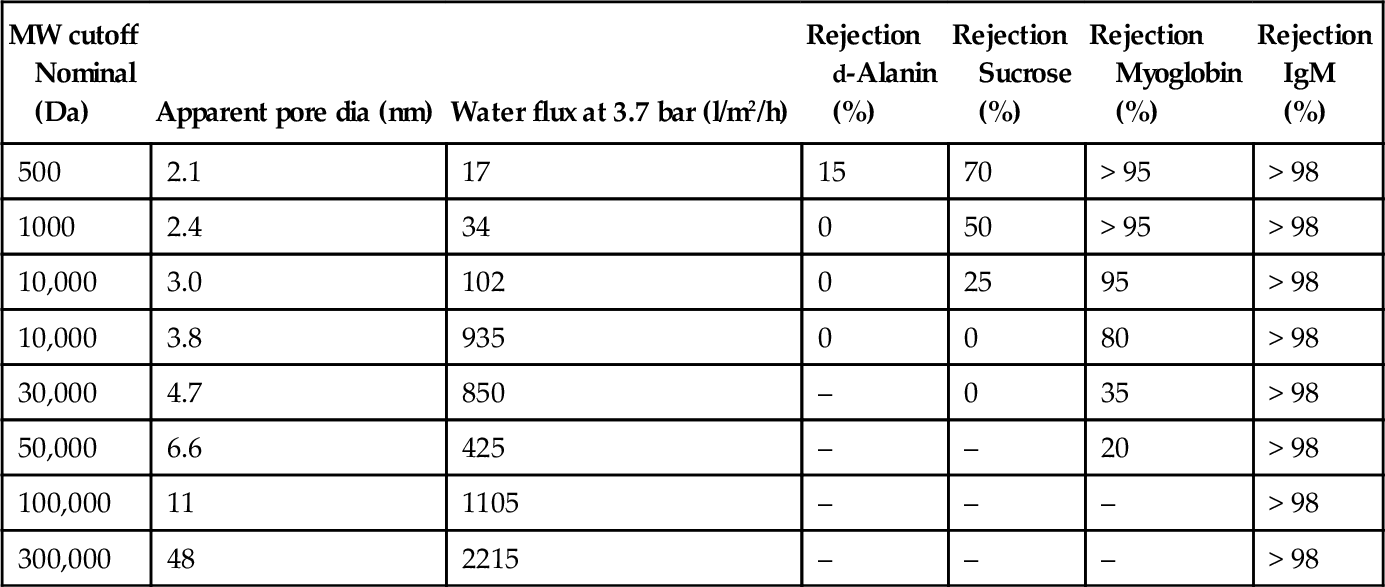
Source: Amicon.
Molecular weights: d-alanin, MW = 89 Da; Sucrose, MW = 342 Da; Myoglobin, MW = 17,500 Da; IgM (immunoglobin), MW > 900,000 Da.
a Water flux and %rejection as a function of pore size rating of membranes used in cross-flow systems.
Table 6.13
Data for sample UF/MF ceramic membranes and modules
| Characteristic | Membrane Property | |
| Substrate | α-Alumina | α-Alumina |
| Membrane | α-Alumina | α-Alumina |
| Pore sizea (μm) | 0.2, 0.45, 1.0 | 0.2, 0.45, 0.8, 1.2, 1.5, 3.5 |
| Water permeabilityb (m3/h m2 bar) | 4.0 | 3.0 |
| Module | ||
| Cross-section | Circular | Hexagonal |
| Length (cm) | 88 | 85 |
| Diameter (cm) | 1.6 | 2.8 |
| Number of lumens | 19 | 19, 37 |
| Lumen diameter (mm) | 2.0, 2.7, 4.0, 6.0 | 3.0, 4.0, 6.0 |
| Surface area (m2) | 0.14 | 0.20, 0.30 |
| Pressure (bar) | 21c | > 100d |

a Smaller-pore ultrafiltration ceramic membranes are also manufactured.
b Measured at 20°C for 0.2 μm pore membrane.
c Operating pressure.
d Burst pressure.
Table 6.14
Classification of commercial UF/MF membranes and dead-end modules
| Manufacturer | Membrane | Module | Configuration | ||||||||
| Polymer | UF/MF | MWCO (kDa) | Pore size (μm) | I.D. (mm) | O.D. (mm) | Diameter (mm) | L (cm) | Surface area (m3) | PD | SUB | |
| Aquasouce | CA | UF | 35–100 | 0.01 | 0.93 | – | 450 | 132 | 125 | PDI | – |
| Dow/Omexell | PVDF | UF | 20 | 0.01 | 0.65 | 1.25 | 165 | 221 | 47.1 | PDO | – |
| Hydranautics | PES | UF | 100–150 | 0.02–0.025 | 0.8 | 1.3 | 225 | 168 | 46 | PDI | – |
| Inge | PES | UF | 100–150 | 0.01–0.025 | 0.9 | 4.2 | 250 | 168 | 50 | PDI | – |
| Koch | PS | UF | 100 | – | 0.89 | 1.4 | 273 | 183 | 80.9 | PDI | – |
| Memcor | PVDF | MF/UF | – | 0.04–0.1 | 0.5 | 0.8 | 150 | 119 | 27.9 | PDO | SUBO |
| Memcor | PP | MF | – | 0.2 | 0.3 | 0.6 | 150 | – | 3.5 | PDO | SUBO |
| Norit | PES/PVP | UF | 100–150 | 0.02–0.025 | 0.8 | 1.3 | 200 | 150 | 40 | PDI | – |
| Pall/Asahi | PVDF | MF | – | 0.1 | 0.7 | 1.3 | 165 | 234 | 50 | PDO | – |
| Pall/Asahi | PAN | UF | 80 | 0.01 | 0.8 | 1.4 | 140 | 223 | 41 | PDO | – |
| Polymem | PS | UF | 100 | – | – | 0.72 | 315 | 98 | 114 | PDO | – |
| Toray | PVDF | MF | – | 0.1 | 0.8 | 1.35 | 200 | 216 | 80 | PDO | – |
| Toray | PAN | UF | 001 | – | – | – | 100 | – | 10 | PDO | – |
| Zenon | PVDF | MF | – | 0.2–0.4 | 0.8 | 1.9 | 1750 | 2.54 × 2.11 m | 31.6 | – | SUBO |
| Zenon | PVDF | UF | – | 0.02–0.025 | 0.4 | 0.7 | 890 | 2.6 × 1.82 m | 37–56 | – | SUBO |
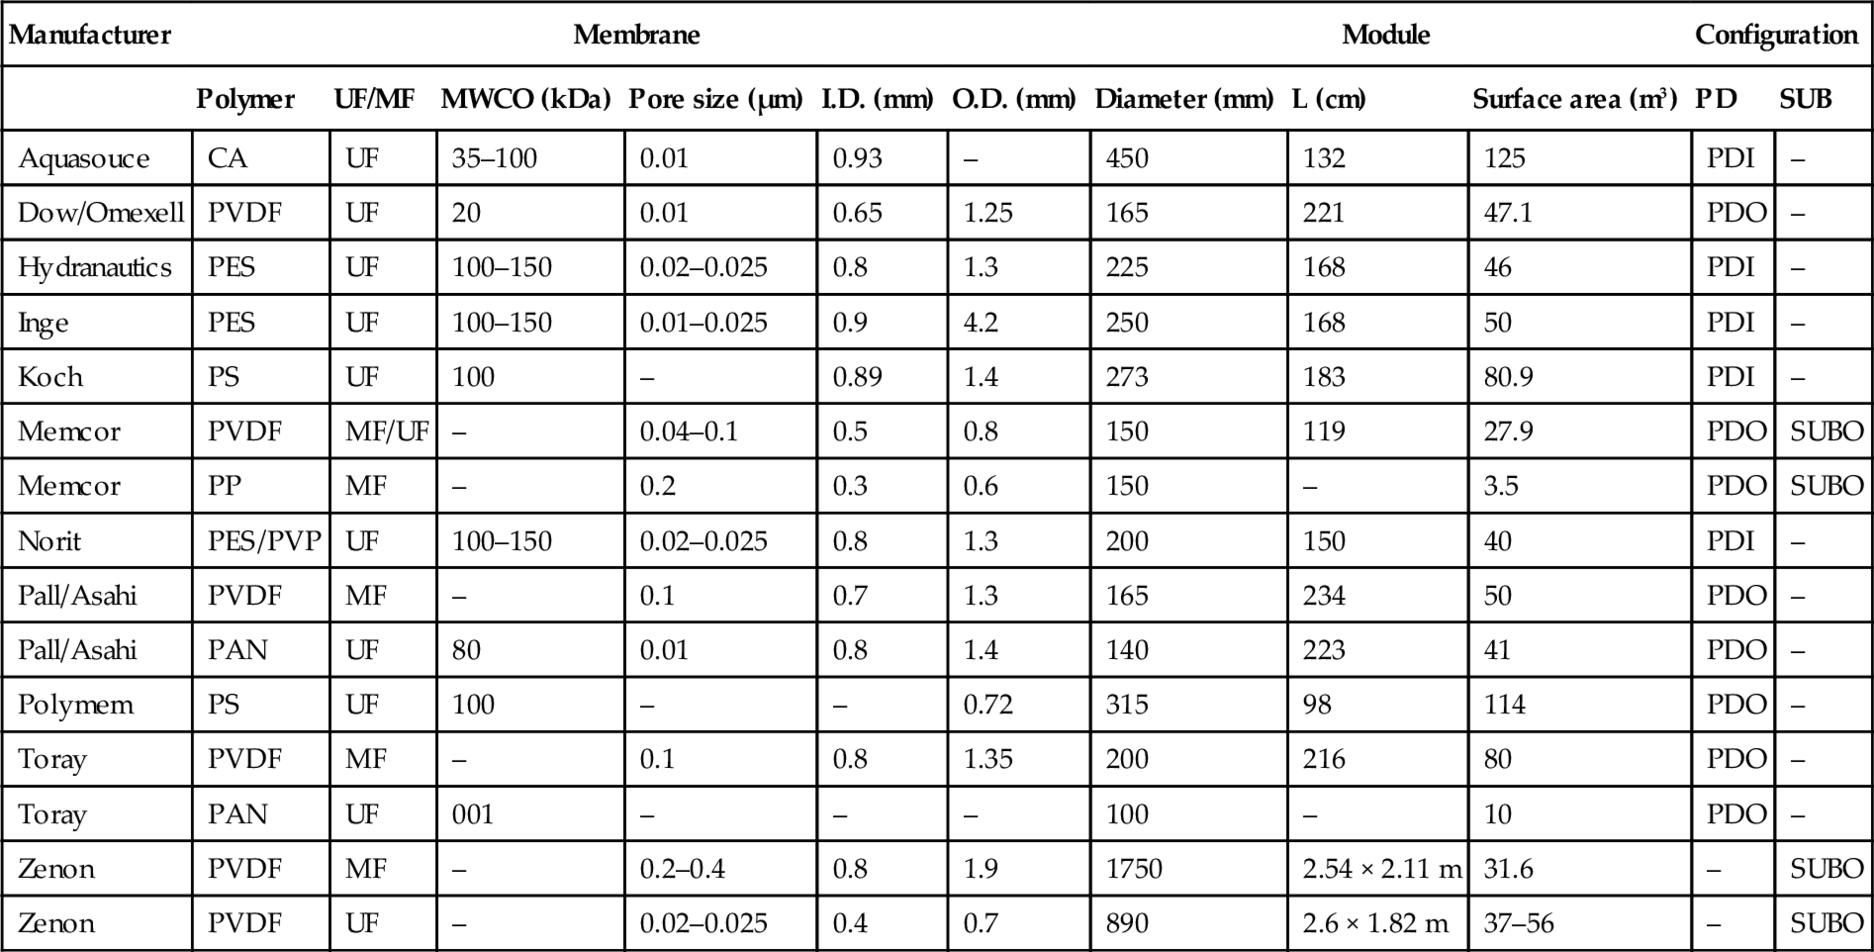
Source: Adapted from Graeme Pearce, Filtration + Separation, October 2007.
PDI, pressure driven inside feed; PDO, pressure driven outside feed; SUBO, submerged vacuum driven; CA, cellulose acetate; PAN, polyacrylonitrile; PS, polysulphone; PES, polyether sulphone; PVP, polyvinyl pyrrolidone; PVDF, polyvinylidene fluoride; PP, polypropylene.
Table 6.15
Hydrophilic/hydrophobic surface characteristics of various commercial NF membranes based on contact angle
| Membrane | Polymer | Contact angle (°) | Hydrophilicity | Manufacturer |
| PVD-1 | Polyvinyl alcohol | 20a | Most hydrophilic | Nitto Denko – Hydranautics |
| Desal-5 DK | Polyamide | 31a | GE Osmonics | |
| SR1 | – | 32a | Koch | |
| UTC-20 | Polypipera-zineamide | 36b | Toray | |
| ATF-60 | – | 38a | Parker-Hannifan | |
| Desal-5 DL | Cross-linked aromatic polyamide | 42a 44b | GE Osmonics | |
| XN-40 | Polyamide | 46a | Tri-Sep | |
| Desal-51 HL | Cross-linked aromatic polyamide | 47b | GE Osmonics | |
| NF-PES-10 | Polyethersulphone | 54a 72b | Nadir GmbH | |
| NTR-7450 | Sulphonated polyether sulphone | 58a 70b | Nitto Denko – Hydranautics | |
| N30-F | Polyethersulphone | 88b | Most hydrophobic | Nadir GmbH |

aSource: Mantarri et al., Desalination 149 (2002) 131–136.
bSource: Boussu et al., Desalination 191 (2006) 245–253.