
This chapter discusses the fundamentals of measurement theory. We outline the relationships among theoretical concepts, definitions, and measurement, and describe some basic measures that are used frequently. It is important to distinguish the levels of the conceptualization proces s, from abstract concepts, to definitions that are used operationally, to actual measurements. Depending on the concept and the operational definition derived from it, different levels of measurement may be applied: nominal scale, ordinal scale, interval scale, and ratio scale. It is also beneficial to spell out the explicit differences among some basic measures such as ratio, proportion, percentage, and rate. Significant amounts of wasted effort and resources can be avoided if these fundamental measurements are well understood.
We then focus on measurement quality. We discuss the most important issues in measurement quality, namely, reliability and validity, and their relationships with measurement errors. We then discuss the role of correlation in observational studies and the criteria for causality.
It is undisputed that measurement is crucial to the progress of all sciences. Scientific progress is made through observations and generalizations based on data and measurements, the derivation of theories as a result, and in turn the confirmation or refutation of theories via hypothesis testing based on further empirical data. As an example, consider the proposition “the more rigorously the front end of the software development process is executed, the better the quality at the back end.” To confirm or refute this proposition, we first need to define the key concepts. For example, we define “the software development process” and distinguish the process steps and activities of the front end from those of the back end. Assume that after the requirements-gathering process, our development process consists of the following phases:
Design
Design reviews and inspections
Code
Code inspection
Debug and development tests
Integration of components and modules to form the product
Formal machine testing
Early customer programs
Integration is the development phase during which various parts and components are integrated to form one complete software product. Usually after integration the product is under formal change control. Specifically, after integration every change of the software must have a specific reason (e.g., to fix a bug uncovered during testing) and must be documented and tracked. Therefore, we may want to use integration as the cutoff point: The design, coding, debugging, and integration phases are classified as the front end of the development process and the formal machine testing and early customer trials constitute the back end.
We then define rigorous implementation both in the general sense and in specific terms as they relate to the front end of the development process. Assuming the development process has been formally documented, we may define rigorous implementation as total adherence to the process: Whatever is described in the process documentation that needs to be executed, we execute. However, this general definition is not sufficient for our purpose, which is to gather data to test our proposition. We need to specify the indicator(s) of the definition and to make it (them) operational. For example, suppose the process documentation says all designs and code should be inspected. One operational definition of rigorous implementation may be inspection coverage expressed in terms of the percentage of the estimated lines of code (LOC) or of the function points (FP) that are actually inspected. Another indicator of good reviews and inspections could be the scoring of each inspection by the inspectors at the end of the inspection, based on a set of criteria. We may want to operationally use a five-point Likert scale to denote the degree of effectiveness (e.g., 5 = very effective, 4 = effective, 3 = somewhat effective, 2 = not effective, 1 = poor inspection). There may also be other indicators.
In addition to design, design reviews, code implementation, and code inspections, development testing is part of our definition of the front end of the development process. We also need to operationally define “rigorous execution” of this test. Two indicators that could be used are the percent coverage in terms of instructions executed (as measured by some test coverage measurement tools) and the defect rate expressed in terms of number of defects removed per thousand lines of source code (KLOC) or per function point.
Likewise, we need to operationally define “quality at the back end” and decide which measurement indicators to use. For the sake of simplicity let us use defects found per KLOC (or defects per function point) during formal machine testing as the indicator of back-end quality. From these metrics, we can formulate several testable hypotheses such as the following:
For software projects, the higher the percentage of the designs and code that are inspected, the lower the defect rate at the later phase of formal machine testing.
The more effective the design reviews and the code inspections as scored by the inspection team, the lower the defect rate at the later phase of formal machine testing.
The more thorough the development testing (in terms of test coverage) before integration, the lower the defect rate at the formal machine testing phase.
With the hypotheses formulated, we can set out to gather data and test the hypotheses. We also need to determine the unit of analysis for our measurement and data. In this case, it could be at the project level or at the component level of a large project. If we are able to collect a number of data points that form a reasonable sample size (e.g., 35 projects or components), we can perform statistical analysis to test the hypotheses. We can classify projects or components into several groups according to the independent variable of each hypothesis, then compare the outcome of the dependent variable (defect rate during formal machine testing) across the groups. We can conduct simple correlation analysis, or we can perform more sophisticated statistical analyses. If the hypotheses are substantiated by the data, we confirm the proposition. If they are rejected, we refute the proposition. If we have doubts or unanswered questions during the process (e.g., Are our indicators valid? Are our data reliable? Are there other variables we need to control when we conduct the analysis for hypothesis testing?), then perhaps more research is needed. However, if the hypothesis(es) or the proposition is confirmed, we can use the knowledge thus gained and act accordingly to improve our software development quality.
The example demonstrates the importance of measurement and data. Measurement and data really drive the progress of science and engineering. Without empirical verification by data and measurement, theories and propositions remain abstract. The example also illustrates that from theory to testable hypothesis, and likewise from concepts to measurement, there are several steps with levels of abstraction. Simply put, a theory consists of one or more propositional statements that describe the relationships among concepts—usually expressed in terms of cause and effect. From each proposition, one or more empirical hypotheses can be derived. The concepts are then formally defined and operationalized. The operationalization process produces metrics and indicators for which data can be collected. The hypotheses thus can be tested empirically. A hierarchy from theory to hypothesis and from concept to measurement indicators is illustrated in Figure 3.1.
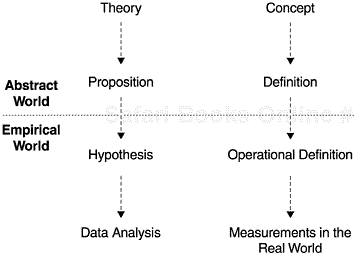
The building blocks of theory are concepts and definitions. In a theoretical definition a concept is defined in terms of other concepts that are already well understood. In the deductive logic system, certain concepts would be taken as undefined; they are the primitives. All other concepts would be defined in terms of the primitive concepts. For example, the concepts of point and line may be used as undefined and the concepts of triangle or rectangle can then be defined based on these primitives.
Operational definitions, in contrast, are definitions that spell out the metrics and the procedures to be used to obtain data. An operational definition of “body weight” would indicate how the weight of a person is to be measured, the instrument to be used, and the measurement unit to record the results. An operational definition of “software product defect rate” would indicate the formula for defect rate, the defect to be measured (numerator), the denominator (e.g., lines of code count, function point), how to measure, and so forth.
We have seen that from theory to empirical hypothesis and from theoretically defined concepts to operational definitions, the process is by no means direct. As the example illustrates, when we operationalize a definition and derive measurement indicators, we must consider the scale of measurement. For instance, to measure the quality of software inspection we may use a five-point scale to score the inspection effectiveness or we may use percentage to indicate the inspection coverage. For some cases, more than one measurement scale is applicable; for others, the nature of the concept and the resultant operational definition can be measured only with a certain scale. In this section, we briefly discuss the four levels of measurement: nominal scale, ordinal scale, interval scale, and ratio scale.
The most simple operation in science and the lowest level of measurement is classification. In classifying we attempt to sort elements into categories with respect to a certain attribute. For example, if the attribute of interest is religion, we may classify the subjects of the study into Catholics, Protestants, Jews, Buddhists, and so on. If we classify software products by the development process models through which the products were developed, then we may have categories such as waterfall development process, spiral development process, iterative development process, object-oriented programming process, and others. In a nominal scale, the two key requirements for the categories are jointly exhaustive and mutually exclusive. Mutually exclusive means a subject can be classified into one and only one category. Jointly exhaustive means that all categories together should cover all possible categories of the attribute. If the attribute has more categories than we are interested in, an “other” category is needed to make the categories jointly exhaustive.
In a nominal scale, the names of the categories and their sequence bear no assumptions about relationships among categories. For instance, we place the waterfall development process in front of spiral development process, but we do not imply that one is “better than” or “greater than” the other. As long as the requirements of mutually exclusive and jointly exhaustive are met, we have the minimal conditions necessary for the application of statistical analysis. For example, we may want to compare the values of interested attributes such as defect rate, cycle time, and requirements defects across the different categories of software products.
Ordinal scale refers to the measurement operations through which the subjects can be compared in order. For example, we may classify families according to socio-economic status: upper class, middle class, and lower class. We may classify software development projects according to the SEI maturity levels or according to a process rigor scale: totally adheres to process, somewhat adheres to process, does not adhere to process. Our earlier example of inspection effectiveness scoring is an ordinal scale.
The ordinal measurement scale is at a higher level than the nominal scale in the measurement hierarchy. Through it we are able not only to group subjects into categories, but also to order the categories. An ordinal scale is asymmetric in the sense that if A > B is true then B > A is false. It has the transitivity property in that if A > B and B > C, then A > C.
We must recognize that an ordinal scale offers no information about the magnitude of the differences between elements. For instance, for the process rigor scale we know only that “totally adheres to process” is better than “somewhat adheres to process” in terms of the quality outcome of the software product, and “somewhat adheres to process” is better than “does not adhere to process.” However, we cannot say that the difference between the former pair of categories is the same as that between the latter pair. In customer satisfaction surveys of software products, the five-point Likert scale is often used with 1 = completely dissatisfied, 2 = somewhat dissatisfied, 3 = neutral, 4 = satisfied, and 5 = completely satisfied. We know only 5 > 4, 4 > 3, and 5 > 2, and so forth, but we cannot say how much greater 5 is than 4. Nor can we say that the difference between categories 5 and 4 is equal to that between categories 3 and 2. Indeed, to move customers from satisfied (4) to very satisfied (5) versus from dissatisfied (2) to neutral (3), may require very different actions and types of improvements.
Therefore, when we translate order relations into mathematical operations, we cannot use operations such as addition, subtraction, multiplication, and division. We can use “greater than” and “less than.” However, in real-world application for some specific types of ordinal scales (such as the Likert five-point, seven-point, or ten-point scales), the assumption of equal distance is often made and operations such as averaging are applied to these scales. In such cases, we should be aware that the measurement assumption is deviated, and then use extreme caution when interpreting the results of data analysis.
An interval scale indicates the exact differences between measurement points. The mathematical operations of addition and subtraction can be applied to interval scale data. For instance, assuming products A, B, and C are developed in the same language, if the defect rate of software product A is 5 defects per KLOC and product B’s rate is 3.5 defects per KLOC, then we can say product A’s defect level is 1.5 defects per KLOC higher than product B’s defect level. An interval scale of measurement requires a well-defined unit of measurement that can be agreed on as a common standard and that is repeatable. Given a unit of measurement, it is possible to say that the difference between two scores is 15 units or that one difference is the same as a second. Assuming product C’s defect rate is 2 defects per KLOC, we can thus say the difference in defect rate between products A and B is the same as that between B and C.
When an absolute or nonarbitrary zero point can be located on an interval scale, it becomes a ratio scale. Ratio scale is the highest level of measurement and all mathematical operations can be applied to it, including division and multiplication. For example, we can say that product A’s defect rate is twice as much as product C’s because when the defect rate is zero, that means not a single defect exists in the product. Had the zero point been arbitrary, the statement would have been illegitimate. A good example of an interval scale with an arbitrary zero point is the traditional temperature measurement (Fahrenheit and centigrade scales). Thus we say that the difference between the average summer temperature (80°F) and the average winter temperature (16°F) is 64°F, but we do not say that 80°F is five times as hot as 16°F. Fahrenheit and centigrade temperature scales are interval, not ratio, scales. For this reason, scientists developed the absolute temperature scale (a ratio scale) for use in scientific activities.
Except for a few notable examples, for all practical purposes almost all interval measurement scales are also ratio scales. When the size of the unit is established, it is usually possible to conceive of a zero unit.
For interval and ratio scales, the measurement can be expressed in both integer and noninteger data. Integer data are usually given in terms of frequency counts (e.g., the number of defects customers will encounter for a software product over a specified time length).
We should note that the measurement scales are hierarchical. Each higher-level scale possesses all properties of the lower ones. The higher the level of measurement, the more powerful analysis can be applied to the data. Therefore, in our operationalization process we should devise metrics that can take advantage of the highest level of measurement allowed by the nature of the concept and its definition. A higher-level measurement can always be reduced to a lower one, but not vice versa. For example, in our defect measurement we can always make various types of comparisons if the scale is in terms of actual defect rate. However, if the scale is in terms of excellent, good, average, worse than average, and poor, as compared to an industrial standard, then our ability to perform additional analysis of the data is limited.
Regardless of the measurement scale, when the data are gathered we need to analyze them to extract meaningful information. Various measures and statistics are available for summarizing the raw data and for making comparisons across groups. In this section we discuss some basic measures such as ratio, proportion, percentage, and rate, which are frequently used in our daily lives as well as in various activities associated with software development and software quality. These basic measures, while seemingly easy, are often misused. There are also numerous sophisticated statistical techniques and methodologies that can be employed in data analysis. However, such topics are not within the scope of this discussion.
A ratio results from dividing one quantity by another. The numerator and denominator are from two distinct populations and are mutually exclusive. For example, in demography, sex ratio is defined as
If the ratio is less than 100, there are more females than males; otherwise there are more males than females.
Ratios are also used in software metrics. The most often used, perhaps, is the ratio of number of people in an independent test organization to the number of those in the development group. The test/development head-count ratio could range from 1:1 to 1:10 depending on the management approach to the software development process. For the large-ratio (e.g., 1:10) organizations, the development group usually is responsible for the complete development (including extensive development tests) of the product, and the test group conducts system-level testing in terms of customer environment verifications. For the small-ratio organizations, the independent group takes the major responsibility for testing (after debugging and code integration) and quality assurance.
Proportion is different from ratio in that the numerator in a proportion is a part of the denominator:
Proportion also differs from ratio in that ratio is best used for two groups, whereas proportion is used for multiple categories (or populations) of one group. In other words, the denominator in the preceding formula can be more than just a + b. If
then we have
When the numerator and the denominator are integers and represent counts of certain events, then p is also referred to as a relative frequency. For example, the following gives the proportion of satisfied customers of the total customer set:
The numerator and the denominator in a proportion need not be integers. They can be frequency counts as well as measurement units on a continuous scale (e.g., height in inches, weight in pounds). When the measurement unit is not integer, proportions are called fractions.
A proportion or a fraction becomes a percentage when it is expressed in terms of per hundred units (the denominator is normalized to 100). The word percent means per hundred. A proportion p is therefore equal to 100p percent (100p%).
Percentages are frequently used to report results, and as such are frequently misused. First, because percentages represent relative frequencies, it is important that enough contextual information be given, especially the total number of cases, so that the readers can interpret the information correctly. Jones (1992) observes that many reports and presentations in the software industry are careless in using percentages and ratios. He cites the example:
Requirements bugs were 15% of the total, design bugs were 25% of the total, coding bugs were 50% of the total, and other bugs made up 10% of the total.
Had the results been stated as follows, it would have been much more informative:
The project consists of 8 thousand lines of code (KLOC). During its development a total of 200 defects were detected and removed, giving a defect removal rate of 25 defects per KLOC. Of the 200 defects, requirements bugs constituted 15%, design bugs 25%, coding bugs 50%, and other bugs made up 10%.
A second important rule of thumb is that the total number of cases must be sufficiently large enough to use percentages. Percentages computed from a small total are not stable; they also convey an impression that a large number of cases are involved. Some writers recommend that the minimum number of cases for which percentages should be calculated is 50. We recommend that, depending on the number of categories, the minimum number be 30, the smallest sample size required for parametric statistics. If the number of cases is too small, then absolute numbers, instead of percentages, should be used. For instance,
Of the total 20 defects for the entire project of 2 KLOC, there were 3 requirements bugs, 5 design bugs, 10 coding bugs, and 2 others.
When results in percentages appear in table format, usually both the percentages and actual numbers are shown when there is only one variable. When there are more than two groups, such as the example in Table 3.1, it is better just to show the percentages and the total number of cases (N) for each group. With percentages and N known, one can always reconstruct the frequency distributions. The total of 100.0% should always be shown so that it is clear how the percentages are computed. In a two-way table, the direction in which the percentages are computed depends on the purpose of the comparison. For instance, the percentages in Table 3.1 are computed vertically (the total of each column is 100.0%), and the purpose is to compare the defect-type profile across projects (e.g., project B proportionally has more requirements defects than project A).
In Table 3.2, the percentages are computed horizontally. The purpose here is to compare the distribution of defects across projects for each type of defect. The inter-pretations of the two tables differ. Therefore, it is important to carefully examine percentage tables to determine exactly how the percentages are calculated.
Ratios, proportions, and percentages are static summary measures. They provide a cross-sectional view of the phenomena of interest at a specific time. The concept of rate is associated with the dynamics (change) of the phenomena of interest; generally it can be defined as a measure of change in one quantity (y) per unit of another quantity (x) on which the former (y) depends. Usually the x variable is time. It is important that the time unit always be specified when describing a rate associated with time. For instance, in demography the crude birth rate (CBR) is defined as:
where B is the number of live births in a given calendar year, P is the mid-year population, and K is a constant, usually 1,000.
The concept of exposure to risk is also central to the definition of rate, which distinguishes rate from proportion. Simply stated, all elements or subjects in the denominator have to be at risk of becoming or producing the elements or subjects in the numerator. If we take a second look at the crude birth rate formula, we will note that the denominator is mid-year population and we know that not the entire population is subject to the risk of giving birth. Therefore, the operational definition of CBR is not in compliance with the concept of population at risk, and for this reason, it is a “crude” rate. A better measurement is the general fertility rate, in which the denominator is the number of women of childbearing age, usually defined as ages 15 to 44. In addition, there are other more refined measurements for birth rate.
In literature about quality, the risk exposure concept is defined as opportunities for error (OFE). The numerator is the number of defects of interest. Therefore,
In software, defect rate is usually defined as the number of defects per thousand source lines of code (KLOC or KSLOC) in a given time unit (e.g., one year after the general availability of the product in the marketplace, or for the entire life of the product). Note that this metric, defects per KLOC, is also a crude measure. First, the opportunity for error is not known. Second, while any line of source code may be subject to error, a defect may involve many source lines. Therefore, the metric is only a proxy measure of defect rate, even assuming no other problems. Such limitations should be taken into account when analyzing results or interpreting data pertaining to software quality.
The term six sigma represents a stringent level of quality. It is a specific defect rate: 3.4 defective parts per million (ppm). It was made known in the industry by Motorola, Inc., in the late 1980s when Motorola won the first Malcolm Baldrige National Quality Award (MBNQA). Six sigma has become an industry standard as an ultimate quality goal.
Sigma (σ) is the Greek symbol for standard deviation. As Figure 3.2 indicates, the areas under the curve of normal distribution defined by standard deviations are constants in terms of percentages, regardless of the distribution parameters. The area under the curve as defined by plus and minus one standard deviation (sigma) from the mean is 68.26%. The area defined by plus/minus two standard deviations is 95.44%, and so forth. The area defined by plus/minus six sigma is 99.9999998%. The area outside the six sigma area is thus 100% −99.9999998% = 0.0000002%.
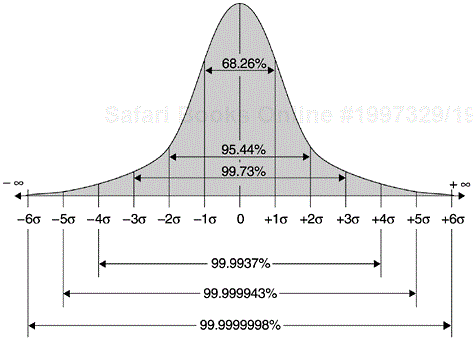
If we take the area within the six sigma limit as the percentage of defect-free parts and the area outside the limit as the percentage of defective parts, we find that six sigma is equal to 2 defectives per billion parts or 0.002 defective parts per million. The interpretation of defect rate as it relates to the normal distribution will be clearer if we include the specification limits in the discussion, as shown in the top panel of Figure 3.3. Given the specification limits (which were derived from customers’ requirements), our purpose is to produce parts or products within the limits. Parts or products outside the specification limits do not conform to requirements. If we can reduce the variations in the production process so that the six sigma (standard deviations) variation of the production process is within the specification limits, then we will have six sigma quality level.
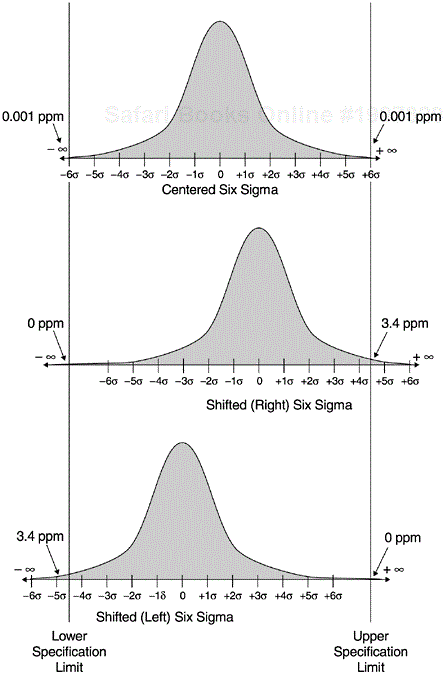
The six sigma value of 0.002 ppm is from the statistical normal distribution. It assumes that each execution of the production process will produce the exact distribution of parts or products centered with regard to the specification limits. In reality, however, process shifts and drifts always result from variations in process execution. The maximum process shifts as indicated by research (Harry, 1989) is 1.5 sigma. If we account for this 1.5-sigma shift in the production process, we will get the value of 3.4 ppm. Such shifting is illustrated in the two lower panels of Figure 3.3. Given fixed specification limits, the distribution of the production process may shift to the left or to the right. When the shift is 1.5 sigma, the area outside the specification limit on one end is 3.4 ppm, and on the other it is nearly zero.
The six sigma definition accounting for the 1.5-sigma shift (3.4 ppm) proposed and used by Motorola (Harry, 1989) has become the industry standard in terms of six sigma–level quality (versus the normal distribution’s six sigma of 0.002 ppm). Furthermore, when the production distribution shifts 1.5 sigma, the intersection points of the normal curve and the specification limits become 4.5 sigma at one end and 7.5 sigma at the other. Since for all practical purposes, the area outside 7.5 sigma is zero, one may say that the Motorola Six Sigma is equal to the one-tailed 4.5 sigma of the centered normal distribution.
The subtle difference between the centered six sigma and the shifted six sigma may imply something significant. The former is practically equivalent to zero defects, which may invite the debate whether it is feasible to achieve such a goal. The shifted six sigma, while remaining at a very stringent level, does contain a sense of reality. As an example to illustrate the difference, assume we are to clean a house of 1500 sq. ft. By centered six sigma, the area that we allow not to be clean enough is about the area of the head of a pin. By shifted six sigma, the area is about the size of the bottom of a soft drink can. Table 3.3 shows the defect rates by sigma level with and without the 1.5-sigma shift. The defect rates are expressed in terms of defective parts per million (DPPM).
So far our discussion of six sigma has centered on the fact that it is a specific defect rate. Its concept, however, is much richer than that. As we touched on in the discussion, in order to reach six sigma, we have to improve the process. Specifically, we must reduce process variations so that the six sigma variation is still within the specification limits. The notion of process improvement/process variation reduction is, therefore, an inherent part of the concept. Another notion is that of product design and product engineering. If failure tolerance is incorporated into the design of the product, it is a lot easier to make the finished product meet the specifications and, therefore, easier to achieve six sigma quality. The concept of process variation reduction also involves the theory and elaboration of process capability. For details, see Harry and Lawson (1992) and other Motorola literature on the subject (e.g, Smith, 1989). In recent years, the concept and approach of six sigma has been expanded and applied to the improvement of management systems and total quality management. In their recent work, Harry and Schroeder (2000) discuss this expanded approach and its successful applications in several well-known corporations. In Customer-Centered Six Sigma, Naumann and Hoisington (2001) discuss the approach and methods to link six sigma quality and process improvement with customer satisfaction, customer loyalty, and financial results.
Table 3.3. DPPM by Sigma Level with and without Process Shift
|
Sigma |
DPPM (Centered) |
DPPM (with 1.5-Sigma Shift) |
|---|---|---|
|
2 |
45,500 |
308,733 |
|
3 |
2,200 |
66,810 |
|
3.5 |
466 |
22,700 |
|
4 |
63 |
6,210 |
|
4.5 |
6.8 |
1,350 |
|
5 |
0.57 |
233 |
|
5.5 |
0.038 |
32 |
|
6 |
0.002 |
3.4 |
In software, a defect is a binary variable (the program either works or does not), and it is difficult to relate to continuous distributions such as the normal distribution. However, for discrete distributions there is an equivalent approximation to the six sigma calculation in statistical theory. Moreover, the notions of process improvement and tolerance design cannot be more applicable. In the software industry, six sigma in terms of defect level is defined as 3.4 defects per million lines of code of the software product over its life. Interestingly, the original reason for using the sigma scale to measure quality was to facilitate comparisons across products or organizations. However, in reality this is not the case because the operational definition differs across organizations. For instance, the lines of code in the denominator are taken as the count of shipped source instructions by the International Business Machine Corporation regardless of the language type used to develop the software. Motorola, on the other hand, operationalized the denominator as Assembler language–equivalent instructions. In other words, the normalized lines of code (to Assembler language) is used. To achieve the normalization, the ratios of high-level language to Assembler by Jones (1986) were used. The difference between the two operational definitions can be orders of magnitude. For example, according to Jones’s conversion table, one line of PL/I code is equivalent to four lines of Assembler statements, and one line of Smalltalk is equivalent to 15 lines of Assembler.
Recall that concepts and definitions have to be operationally defined before measurements can be taken. Assuming operational definitions are derived and measurements are taken, the logical question to ask is, how good are the operational metrics and the measurement data? Do they really accomplish their task—measuring the concept that we want to measure and doing so with good quality? Of the many criteria of measurement quality, reliability and validity are the two most important.
Reliability refers to the consistency of a number of measurements taken using the same measurement method on the same subject. If repeated measurements are highly consistent or even identical, then the measurement method or the operational definition has a high degree of reliability. If the variations among repeated measurements are large, then reliability is low. For example, if an operational definition of a body height measurement of children (e.g., between ages 3 and 12) includes specifications of the time of the day to take measurements, the specific scale to use, who takes the measurements (e.g., trained pediatric nurses), whether the measurements should be taken barefooted, and so on, it is likely that reliable data will be obtained. If the operational definition is very vague in terms of these considerations, the data reliability may be low. Measurements taken in the early morning may be greater than those taken in the late afternoon because children’s bodies tend to be more stretched after a good night’s sleep and become somewhat compacted after a tiring day. Other factors that can contribute to the variations of the measurement data include different scales, trained or untrained personnel, with or without shoes on, and so on.
The measurement of any phenomenon contains a certain amount of chance error. The goal of error-free measurement, although laudable and widely recognized, is never attained in any discipline of scientific investigation. The amount of measurement error may be large or small, but it is universally present. The goal, of course, is to achieve the best possible reliability. Reliability can be expressed in terms of the size of the standard deviations of the repeated measurements. When variables are compared, usually the index of variation (IV) is used. IV is simply a ratio of the standard deviation to the mean:
The smaller the IV, the more reliable the measurements.
Validity refers to whether the measurement or metric really measures what we intend it to measure. In other words, it refers to the extent to which an empirical measure reflects the real meaning of the concept under consideration. In cases where the measurement involves no higher level of abstraction, for example, the measurements of body height and weight, validity is simply accuracy. However, validity is different from reliability. Measurements that are reliable are not necessarily valid, and vice versa. For example, a new bathroom scale for body weight may give identical results upon five consecutive measurements (e.g., 160 lb.) and therefore it is reliable. However, the measurements may not be valid; they would not reflect the person’s body weight if the offset of the scale were at 10 lb. instead of at zero.
For abstract concepts, validity can be a very difficult issue. For instance, the use of church attendance for measuring religiousness in a community may have low validity because religious persons may or may not go to church and may or may not go regularly. Often, it is difficult to recognize that a certain metric is invalid in measuring a concept; it is even more difficult to improve it or to invent a new metric.
Researchers tend to classify validity into several types. The type of validity we have discussed so far is construct validity, which refers to the validity of the operational measurement or metric representing the theoretical construct. In addition, there are criterion-related validity and content validity. Criterion-related validity is also referred to as predictive validity. For example, the validity of a written driver’s test is determined by the relationship between the scores people get on the test and how well they drive. Predictive validity is also applicable to modeling, which we will discuss in later chapters on software reliability models. Content validity refers to the degree to which a measure covers the range of meanings included in the concept. For instance, a test of mathematical ability for elementary pupils cannot be limited to addition, but would also need to cover subtraction, multiplication, division, and so forth.
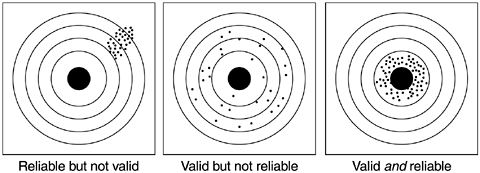
Given a theoretical construct, the purpose of measurement is to measure the construct validly and reliably. Figure 3.4 graphically portrays the difference between validity and reliability. If the purpose of the measurement is to hit the center of the target, we see that reliability looks like a tight pattern regardless of where it hits, because reliability is a function of consistency. Validity, on the other hand, is a function of shots being arranged around the bull’s eye. In statistical terms, if the expected value (or the mean) is the bull’s eye, then it is valid; if the variations are small relative to the entire target, then it is reliable.
From Practice of Social Research (Non-Info Trac Version), 9th edition, by E. Babbie. © 2001 Thomson Learning. Reprinted with permission of Brooks/Cole, an imprint of the Wadsworth Group, a division of Thomson Learning (fax: 800-730-2215).
Figure 3.4. An Analogy to Validity and Reliability
Note that there is some tension between validity and reliability. For the data to be reliable, the measurement must be specifically defined. In such an endeavor, the risk of being unable to represent the theoretical concept validly may be high. On the other hand, for the definition to have good validity, it may be quite difficult to define the measurements precisely. For example, the measurement of church attendance may be quite reliable because it is specific and observable. However, it may not be valid to represent the concept of religiousness. On the other hand, to derive valid measurements of religiousness is quite difficult. In the real world of measurements and metrics, it is not uncommon for a certain tradeoff or balance to be made between validity and reliability.
Validity and reliability issues come to the fore when we try to use metrics and measurements to represent abstract theoretical constructs. In traditional quality engi-neering where measurements are frequently physical and usually do not involve abstract concepts, the counterparts of validity and reliability are termed accuracy and precision (Juran and Gryna, 1970). Much confusion surrounds these two terms despite their having distinctly different meanings. If we want a much higher degree of precision in measurement (e.g., accuracy up to three digits after the decimal point when measuring height), then our chance of getting all measurements accurate may be reduced. In contrast, if accuracy is required only at the level of integer inch (less precise), then it is a lot easier to meet the accuracy requirement.
Reliability and validity are the two most important issues of measurement quality. These two issues should be well thought-through before a metric is proposed, used, and analyzed. In addition, other attributes for software metrics are desirable. For instance, the draft of the IEEE standard for a software quality metrics methodology includes factors such as correlation, tracking, consistency, predictability, and discriminative power (Schneidewind, 1991).
In this section we discuss validity and reliability in the context of measurement error. There are two types of measurement error: systematic and random. Systematic measurement error is associated with validity; random error is associated with reliability. Let us revisit our example about the bathroom weight scale with an offset of 10 lb. Each time a person uses the scale, he will get a measurement that is 10 lb. more than his actual body weight, in addition to the slight variations among measurements. Therefore, the expected value of the measurements from the scale does not equal the true value because of the systematic deviation of 10 lb. In simple formula:
In a general case:
where M is the observed/measured score, T is the true score, s is systematic error, and e is random error.
The presence of s (systematic error) makes the measurement invalid. Now let us assume the measurement is valid and the s term is not in the equation. We have the following:
The equation still states that any observed score is not equal to the true score because of random disturbance—the random error e. These disturbances mean that on one measurement, a person’s score may be higher than his true score and on another occasion the measurement may be lower than the true score. However, since the disturbances are random, it means that the positive errors are just as likely to occur as the negative errors and these errors are expected to cancel each other. In other words, the average of these errors in the long run, or the expected value of e, is zero: E(e) = 0. Furthermore, from statistical theory about random error, we can also assume the following:
The correlation between the true score and the error term is zero.
There is no serial correlation between the true score and the error term.
The correlation between errors on distinct measurements is zero.
From these assumptions, we find that the expected value of the observed scores is equal to the true score:
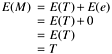
The question now is to assess the impact of e on the reliability of the measurements (observed scores). Intuitively, the smaller the variations of the error term, the more reliable the measurements. This intuition can be observed in Figure 3.4 as well as expressed in statistical terms:
Therefore, the reliability of a metric varies between 0 and 1. In general, the larger the error variance relative to the variance of the observed score, the poorer the reliability. If all variance of the observed scores is a result of random errors, then the reliability is zero [1 – (1/1) = 0].
Thus far we have discussed the concept and meaning of validity and reliability and their interpretation in the context of measurement errors. Validity is associated with systematic error and the only way to eliminate systematic error is through better understanding of the concept we try to measure, and through deductive logic and reasoning to derive better definitions. Reliability is associated with random error. To reduce random error, we need good operational definitions, and based on them, good execution of measurement operations and data collection. In this section, we discuss how to assess the reliability of empirical measurements.
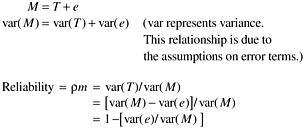
There are several ways to assess the reliability of empirical measurements including the test/retest method, the alternative-form method, the split-halves method, and the internal consistency method (Carmines and Zeller, 1979). Because our purpose is to illustrate how to use our understanding of reliability to interpret software metrics rather than in-depth statistical examination of the subject, we take the easiest method, the retest method. The retest method is simply taking a second measurement of the subjects some time after the first measurement is taken and then computing the correlation between the first and the second measurements. For instance, to evaluate the reliability of a blood pressure machine, we would measure the blood pressures of a group of people and, after everyone has been measured, we would take another set of measurements. The second measurement could be taken one day later at the same time of day, or we could simply take two measurements at one time. Either way, each person will have two scores. For the sake of simplicity, let us confine ourselves to just one measurement, either the systolic or the diastolic score. We then calculate the correlation between the first and second score and the correlation coefficient is the reliability of the blood pressure machine. A schematic representation of the test/retest method for estimating reliability is shown in Figure 3.5.
The equations for the two tests can be represented as follows:
From the assumptions about the error terms, as we briefly stated before, it can be shown that
in which ρm is the reliability measure.
As an example in software metrics, let us assess the reliability of the reported number of defects found at design inspection. Assume that the inspection is formal; that is, an inspection meeting was held and the participants include the design owner, the inspection moderator, and the inspectors. At the meeting, each defect is acknowledged by the whole group and the record keeping is done by the moderator. The test/retest method may involve two record keepers and, at the end of the inspection, each turns in his recorded number of defects. If this method is applied to a series of inspections in a development organization, we will have two reports for each inspection over a sample of inspections. We then calculate the correlation between the two series of reported numbers and we can estimate the reliability of the reported inspection defects.
One of the important uses of reliability assessment is to adjust or correct correlations for unreliability that result from random errors in measurements. Correlation is perhaps one of the most important methods in software engineering and other disciplines for analyzing relationships between metrics. For us to substantiate or refute a hypothesis, we have to gather data for both the independent and the dependent variables and examine the correlation of the data. Let us revisit our hypothesis testing example at the beginning of this chapter: The more effective the design reviews and the code inspections as scored by the inspection team, the lower the defect rate encountered at the later phase of formal machine testing.
As mentioned, we first need to operationally define the independent variable (inspection effectiveness) and the dependent variable (defect rate during formal machine testing). Then we gather data on a sample of components or projects and calculate the correlation between the independent variable and dependent variable. However, because of random errors in the data, the resultant correlation often is lower than the true correlation. With knowledge about the estimate of the reliability of the variables of interest, we can adjust the observed correlation to get a more accurate picture of the relationship under consideration. In software development, we observed that a key reason for some theoretically sound hypotheses not being supported by actual project data is that the operational definitions of the metrics are poor and there are too many noises in the data.
Given the observed correlation and the reliability estimates of the two variables, the formula for correction for attenuation (Carmines and Zeller, 1979) is as follows:
where
ρ(xt yt) is the correlation corrected for attenuation, in other words, the estimated true correlation
ρ(xi yi) is the observed correlation, calculated from the observed data
ρxx′ is the estimated reliability of the X variable
ρyy′ is the estimated reliability of the Y variable |
For example, if the observed correlation between two variables was 0.2 and the reliability estimates were 0.5 and 0.7, respectively, for X and Y, then the correlation corrected for attenuation would be
This means that the correlation between X and Y would be 0.34 if both were measured perfectly without error.
Correlation is probably the most widely used statistical method to assess relationships among observational data (versus experimental data). However, caution must be exercised when using correlation; otherwise, the true relationship under investigation may be disguised or misrepresented. There are several points about correlation that one has to know before using it. First, although there are special types of nonlinear correlation analysis available in statistical literature, most of the time when one mentions correlation, it means linear correlation. Indeed, the most well-known Pearson correlation coefficient assumes a linear relationship. Therefore, if a correlation coefficient between two variables is weak, it simply means there is no linear relationship between the two variables. It doesn’t mean there is no relationship of any kind.
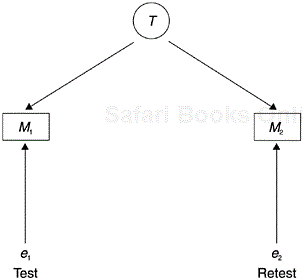
Let us look at the five types of relationship shown in Figure 3.6. Panel A represents a positive linear relationship and panel B a negative linear relationship. Panel C shows a curvilinear convex relationship, and panel D a concave relationship. In panel E, a cyclical relationship (such as the Fourier series representing frequency waves) is shown. Because correlation assumes linear relationships, when the correlation coefficients (Pearson) for the five relationships are calculated, the results accurately show that panels A and B have significant correlation. However, the correlation coefficients for the other three relationships will be very weak or will show no relationship at all. For this reason, it is highly recommended that when we use correlation we always look at the scattergrams. If the scattergram shows a particular type of nonlinear relationship, then we need to pursue analyses or coefficients other than linear correlation.
Second, if the data contain noise (due to unreliability in measurement) or if the range of the data points is large, the correlation coefficient (Pearson) will probably show no relationship. In such a situation, we recommend using the rank-order correlation method, such as Spearman’s rank-order correlation. The Pearson correlation (the correlation we usually refer to) requires interval scale data, whereas rank-order correlation requires only ordinal data. If there is too much noise in the interval data, the Pearson correlation coefficient thus calculated will be greatly attenuated. As discussed in the last section, if we know the reliability of the variables involved, we can adjust the resultant correlation. However, if we have no knowledge about the reliability of the variables, rank-order correlation will be more likely to detect the underlying relationship. Specifically, if the noises of the data did not affect the original ordering of the data points, then rank-order correlation will be more successful in representing the true relationship. Since both Pearson’s correlation and Spearman’s rank-order correlation are covered in basic statistics textbooks and are available in most statistical software packages, we need not get into the calculation details here.
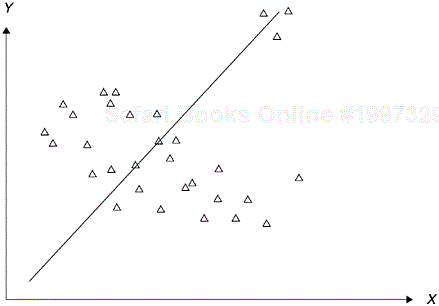
Third, the method of linear correlation (least-squares method) is very vulnerable to extreme values. If there are a few extreme outliers in the sample, the correlation coefficient may be seriously affected. For example, Figure 3.7 shows a moderately negative relationship between X and Y. However, because there are three extreme outliers at the northeast coordinates, the correlation coefficient will become positive. This outlier susceptibility reinforces the point that when correlation is used, one should also look at the scatter diagram of the data.
Finally, although a significant correlation demonstrates that an association exists between two variables, it does not automatically imply a cause-and-effect relationship. Although an element of causality, correlation alone is inadequate to show the existence of causality. In the next section, we discuss the criteria for establishing causality.
The isolation of cause and effect in controlled experiments is relatively easy. For example, a headache medicine was administered to a sample of subjects who were having headaches. A placebo was administered to another group with headaches (who were statistically not different from the first group). If after a certain time of taking the headache medicine and the placebo, the headaches of the first group were reduced or disappeared, while headaches persisted among the second group, then the curing effect of the headache medicine is clear.
For analysis with observational data, the task is much more difficult. Researchers (e.g., Babbie, 1986) have identified three criteria:
The first requirement in a causal relationship between two variables is that the cause precede the effect in time or as shown clearly in logic.
The second requirement in a causal relationship is that the two variables be empirically correlated with one another.
The third requirement for a causal relationship is that the observed empirical correlation between two variables be not the result of a spurious relationship.
The first and second requirements simply state that in addition to empirical correlation, the relationship has to be examined in terms of sequence of occurrence or deductive logic. Correlation is a statistical tool and could be misused without the guidance of a logic system. For instance, it is possible to correlate the outcome of a Super Bowl (National Football League versus American Football League) to some interesting artifacts such as fashion (length of skirt, popular color, and so forth) and weather. However, logic tells us that coincidence or spurious association cannot substantiate causation.
The third requirement is a difficult one. There are several types of spurious relationships, as Figure 3.8 shows, and sometimes it may be a formidable task to show that the observed correlation is not due to a spurious relationship. For this reason, it is much more difficult to prove causality in observational data than in experimental data. Nonetheless, examining for spurious relationships is necessary for scientific reasoning; as a result, findings from the data will be of higher quality.
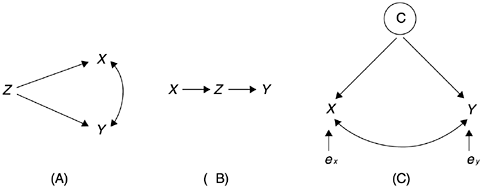
In Figure 3.8, case A is the typical spurious relationship between X and Y in which X and Y have a common cause Z. Case B is a case of the intervening variable, in which the real cause of Y is an intervening variable Z instead of X. In the strict sense, X is not a direct cause of Y. However, since X causes Z and Z in turn causes Y, one could claim causality if the sequence is not too indirect. Case C is similar to case A. However, instead of X and Y having a common cause as in case B, both X and Y are indicators (operational definitions) of the same concept C. It is logical that there is a correlation between them, but causality should not be inferred.
An example of the spurious causal relationship due to two indicators measuring the same concept is Halstead’s (1977) software science formula for program length:
where
N = estimated program length
n1 = number of unique operators
n2 = number of unique operands
Researchers have reported high correlations between actual program length (actual lines of code count) and the predicted length based on the formula, sometimes as high as 0.95 (Fitzsimmons and Love, 1978). However, as Card and Agresti (1987) show, both the formula and actual program length are functions of n1 and n2, so correlation exists by definition. In other words, both the formula and the actual lines of code counts are operational measurements of the concept of program length. One has to conduct an actual n1 and n2 count for the formula to work. However, n1 and n2 counts are not available until the program is complete or almost complete. Therefore, the relationship is not a cause-and-effect relationship and the usefulness of the formula’s predictability is limited.
Measurement is related to the concept or entity of interest and the operational definition of the concept. Depending on the operational definition, different levels of measurement can be applied: nominal scale, ordinal scale, interval scale, and ratio scale. The measurement scales are hierarchical; each scale possesses all properties of scales at lower levels.
Basic measures such as ratio, proportion, percentage, and rate all have specific purposes. Care should be exercised to avoid misuse. The concept of six sigma not only represents a stringent level of quality, it also includes the notions of process-variation reduction and product-design improvement. Its definition as used in the industry (shifted six sigma) is different from the statistical definition based on normal distribution (centered six sigma). Although meant for comparisons across different measurement units, in software the sigma levels cannot be compared across companies because of differences in operational definitions.
Validity and reliability are the two most important criteria of measurement quality. Validity refers to whether the metric really measures what it is intended to. Reliability refers to the consistency of measurements of the metric and measurement method. Validity is associated with systematic measurement errors and reliability with random measurement errors. Unreliability of measurements leads to an attenuation of correlation between two variables. When the measurement reliabilities of the variables are known, correction for such attenuation can be made.
Correlation is widely used with observational data, including software measurements. Correlation alone, however, cannot establish causality. To establish a cause-and-effect relationship based on observational data, three criteria must be met: (1) the cause precedes the effect in time or logically, (2) significant correlation exists, and (3) the observed correlation is not caused by a spurious relationship.
Measurement is the key to making software development a true engineering discipline. To improve the practice of software measurement, it is important to understand the fundamentals of measurement theory.