8
MAD SCIENTIST MIND GAMES
In this chapter, the Mad Scientist turns their attention to the source of their genius—the mind! First, you’ll learn about your nervous system by testing how long it takes to react to stimuli. You’ll then build a lie detector that measures galvanic skin resistance, one of the factors used in polygraph tests. Use it on your friends. If they get warm and sweaty when you question them, they might be lying to you!
EXPERIMENT 10: HOW FAST ARE YOUR NERVES?

Difficulty: Medium
People process stimuli with nerve cells, or neurons. Nerves are the wiring of the human body, carrying signals from the brain to the rest of the body and back. When you touch a hot stove, you seem to feel the pain right away. But compared to the copper wires in most electronics, nerves actually work pretty slowly.
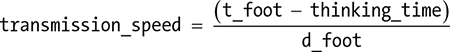
By measuring the time it takes your brain to respond to a signal, you can estimate how fast that signal travels through your nerves. In this experiment, you’ll press button A with either your hand or your foot whenever the micro:bit screen goes blank, and the micro:bit will measure the time it takes you to react.
We’ll make a cardboard pedal to go around the micro:bit so you can press the button without hiding the display (Figure 8-1).

Figure 8-1: Turning a micro:bit into a foot-operated switch

What You’ll Need
For this project, you’ll need:
Micro:bit
Piece of cardboard about 8 inches × 4 inches (20 cm × 10 cm) Thick, strong cardboard works best. It doesn’t need to be exactly these dimensions.
Craft knife To cut and score the cardboard
Blu-Tack adhesive putty To attach the micro:bit to the cardboard
Construction
We’ll start by creating a cardboard pedal that will fold in half around the micro:bit.
- Draw two parallel lines roughly halfway down the cardboard and about 1/4 inches (5 mm) apart, as shown in Figure 8-2. You’ll fold the cardboard along these lines. Also, mark the rectangular part of the cardboard you want to cut out. Make sure the hole you’ll make is big enough for the micro:bit’s screen.
- Draw your knife along the lines for the hinges, cutting only about halfway through the cardboard. This is called scoring the cardboard. Be careful not to cut all the way through. Then cut out the rectangle you marked.

Figure 8-2: Making the hinge and cutting out a place for the micro:bit display
WARNING Using a craft knife can be dangerous! For this part of the project, a responsible adult should use the craft knife or at least supervise.
- Place the micro:bit inside the folded cardboard so you can see its screen. Stick small pieces of Blu-Tack to the center of the micro:bit and then stick the micro:bit to the cardboard. When you gently press the top of the hinge, you should be able to feel button A click (see Figure 8-1). Check that when the switch is pressed, it doesn’t also accidentally press the Reset button on the back of the micro:bit. If it does, try using larger pieces of Blu-Tack.
- This experiment uses MicroPython only. Find the code at https://github.com/simonmonk/mbms/ The Python file for this experiment is Experiment_10.py. Open the file in Mu and load it onto the micro:bit.
Testing Your Nervous System
The program that controls this experiment uses Mu’s REPL to report results and give you instructions. (Revisit Chapter 1 if you need a refresher on how the REPL works.) Because it uses the REPL, this is one experiment where you’ll need to keep your micro:bit connected to your computer using the USB cable. We’ll use the micro:bit’s display and button A to measure reaction times.
Open Mu’s REPL. The instructions in the REPL area of the window will ask you to hold down button A whenever the micro:bit’s display shows a cross and release it as fast as you can when the display goes blank.
Here is what you might see in the REPL on a typical run. The instructions are broken into sections for clarity.
Hold the switch down while the cross is showing.
Release momentarily when the display blanks.
Repeat 5 times.
Press ENTER when ready to start the test
To start the first test run, hold down the switch with your dominant hand and press ENTER once on your computer. A cross should appear on the screen. After a random delay of between 3 and 7 seconds, the display will go blank. When it does, release the button as fast as you can. The REPL should show you the number of milliseconds between when the display went blank and when you released the switch. For example:
The cross should then light for another random period, so hold down the switch to try the test again. The experiment should repeat a total of five times.
If you let go of the switch before the display has blanked, the REPL should display the message You let go too soon. This will record a time of 0, invalidating the experiment, and you’ll have to restart the whole process. If this happens, reset the micro:bit by unplugging its USB cable and plugging it back in.
After you’ve completed the five tests, the micro:bit’s display should remain blank, and the REPL will show your individual reaction times as well as the average of all your times. For example:
264
264
282
The average time using your hand was 262.7999 ms
You should then be prompted to repeat the experiment using your foot. Move the micro:bit pedal onto the floor. This time, position your foot over the micro:bit and gently use it to press the switch. Getting this right may take a little practice.
Now repeat the test for your foot. Once you’ve captured five reaction times, the REPL should display the average, and you’ll be prompted to enter the following two measurements, as in this example:
Enter the distance from the back of your neck to your fingers in cm: 107
Enter the distance from the back of your neck to your toes in cm: 188
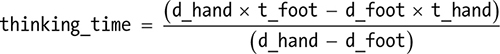
The program will use these measurements to calculate how long it took your brain to realize that the display had blanked in milliseconds—this is the thinking time. And it will calculate the speed at which the signal traveled to your hand or foot in meters per second—this is the transmission speed.
Transmission speed (m/s): 13.03703
“How It Works: Measuring Your Reaction Time” on page 191 will explain how these calculations are made and just how meaningful they are (or aren’t).
Code
We use a variable n to hold the number of reaction time readings to take for each test. In this case, five readings are taken.
import random
n = 5
def run_full_test():
print("TEST 1 - USING your hand")
t_hand = run_test()
print("The average time using your hand was " + str(t_hand)
+ " ms")
print("Now repeat the test for your foot")
t_foot = run_test()
print("The average time using your foot was " + str(t_foot)
+ " ms")
➊ d_hand = int(input("Enter the distance from the back of
your neck to your fingers in cm: "))
➋ d_foot = int(input("Enter the distance from the back of
your neck to your toes in cm: "))
thinking_time = (d_foot * t_hand - d_hand * t_foot)
/ (d_foot - d_hand)
transmission_speed = 10 * (t_foot - thinking_time) / d_foot
print("Thinking time (ms): " + str(thinking_time))
print("Transmission speed (m/s): " + str(transmission_speed))
The function run_full_test runs both the hand and foot test in turn. (We’ll define the code for both those tests in a bit.) The last four lines of the code are the calculations for the thinking time and transmission speed, explained in “How It Works: Measuring Your Reaction Time” on page 191.
This function also prompts you to enter the neck-to-hand and neck-to-foot distances using the input function. The program will be able to use that information because it stores the input in variables. We store the input for the neck-to-hand distance in d_hand ➊ and the input for the neck-to-foot distance in d_foot ➋.
The input function displays the string of text that you supplied as its parameter and then waits for you to enter some text. It returns whatever you type as a string, and the int function converts that string into an integer so we can use it in the calculation.
Here’s the code for the run_test function:
print("Hold the switch down while cross is showing and
release momentarily when the display blanks")
print("Repeat " + str(n) + " times.")
input("Press ENTER when ready to start the test")
total = 0
for i in range(0, n):
t = get_reaction_time()
if t > 10:
print(t)
total += t
else:
print("You let go too soon")
return total / n
The run_test function runs a single test, providing the necessary instructions and collecting the required number of reaction time readings by calling get_reaction_time. If the reaction time is less than 10 milliseconds, which would mean superhuman reflexes, the program tells you that you let go too soon. Otherwise, it displays your reaction time.
display.show(Image.NO)
sleep(random.randint(3000, 7000))
display.clear()
t0 = running_time()
while pin5.read_digital() == False: # Button A down
pass
t1 = running_time()
t = t1 - t0
return t
run_full_test()
The get_reaction_time function displays the cross image and then sleeps for a random period between 3 and 7 seconds. It then clears the screen and sets the variable t0 to the current running time so that the program knows when to start timing the reaction test.
When you release button A, the program exits the while loop and records the time at which it stops in t1. We calculate the reaction time by subtracting t0 from t1.
You might be wondering why the code checks for button A being pressed using pin5.read_digital rather than button_a.is_pressed. The answer is that the is_pressed function does not operate as quickly as read_digital and so would add some unwanted extra time to the reaction time measurement. We use pin5 because the micro:bit’s wiring connects pin 5 directly to button A. The micro:bit actually has a whole load of other pins than the pins 0 to 3 that we use with alligator clips. However, in this book we concentrate on the pins that are easy to access.
Things to Try
To perform further investigations into the human nervous system, try comparing different people’s results or conducting the test at different times of day.
How It Works: Measuring Your Reaction Time
When you see the cross vanish, two things happen in your body, each of which takes a certain amount of time:
- Your eyes and brain notice the change and decide to act on it.
- A signal passes from your brain, through your nerves, to the muscles that control your hand or foot, and the hand or foot comes off the switch.
For this experiment, we assumed that the thinking time, or the time it takes you to register the change, is the same whether you’re moving your hand or your foot.
We also assume that the nerve signal speed between brain and hand and brain and foot is the same. In reality, neither of these assumptions is exactly right, but the Mad Scientist can sort out those issues some other time.
Given those assumptions, the speed that the signal travels through your nerves is equal to the total reaction time minus the thinking time, divided by the distance the signal has to travel.
Taking the two distance measurements allows us to crudely calculate both the thinking time and the signal speed. Here are the variables we’ll use in the calculations:
t_hand The total reaction time (thinking + acting) for the hand
t_foot The total reaction time for the foot
d_hand The distance the signal has to travel along the nerve from the brain to the hand
d_foot The brain-to-foot distance
thinking_time The time it takes to register the event and start the message to the hand or foot
transmission_speed The speed of the signal through the brain to the hand or foot
Now for the math. For the hand, we can use this equation:
Similarly, for the foot, we can use this:

This means that we also know the following:

Now we can use algebra to rearrange things so that we can calculate the thinking time and transmission speed. We can multiply both sides by this:
(t_hand – thinking_time)
And we get this:
If we multiply both sides by the following:
(t_foot – thinking_time)
we get this:
d_hand (t_foot – thinking_time) = d_foot (t_hand – thinking_time)
Multiplying across the parentheses gives this:
d_hand × t_foot – d_hand × thinking_time
= d_foot × t_hand – d_foot × thinking_time
So:
d_hand × t_foot – d_foot × t_hand
= d_hand × thinking_time – d_foot × thinking_time
d_hand × t_foot – d_foot × t_hand
= thinking_time (d_hand – d_foot)
Finally, we can calculate the thinking time as the following:
Now that we have the thinking time, we can use it to calculate the speed the message travels along the nerves, like this:
This result will be in centimeters per millisecond. To convert the value into meters per second, we multiply by 1,000 and divide by 100. In other words, multiply by 10, and you’ve got the transmission speed.
PROJECT: LIE DETECTOR

Difficulty: Medium
The Mad Scientist doesn’t like surprise parties, and they want to figure out whether their lab assistants are planning one for their birthday. They’ll have to use their lie detector (Figure 8-3) to figure it out!
Figure 8-3: Lie detector
This project measures galvanic skin resistance (GSR), which is the resistance of the skin to the flow of electricity. To measure GSR, we’ll use a micro:bit, and a pair of metal spoons.
What You’ll Need
For this project, you’ll need the following:
Micro:bit
2 × Alligator clip cables To connect the spoons to the micro:bit
2 × Spoons
You’ll use the spoons to make contact with the palms of your hands. The alligator clips will attach to the spoons’ handles and might scratch them, so don’t use your best spoons!
Construction
- Go to https://github.com/simonmonk/mbms/ to access the book’s code repository and click the link for Lie Detector. Once the program has opened, click Download and then copy the hex file onto your micro:bit. If you get stuck, head back to Chapter 1 for a refresher on loading programs onto your micro:bit.
If you prefer to use Python, then download the code from the same website. For instructions for downloading and using the book’s examples, see “Downloading the Code” on page 34. The Python file for this experiment is ch_08_Lie_Detector.py.
- Use one alligator clip to connect the handle of one of the spoons to pin 2 and the other alligator clip to connect the other spoon to GND, as shown in Figure 8-3.
To use the lie detector, you need two people: an operator to ask the tricky questions and a subject to answer them. The subject needs to hold the spoons so that the curved side makes full contact with the palms of their hands.
When the operator presses button A, the dot on the micro:bit’s display should move to the center of the LED. If skin resistance falls because the subject gets sweaty, the dot will move up the screen. If skin resistance rises, the dot will move down.
If the dot seems to be stuck at the top or bottom, the operator needs to press button A to center the display. The readings will gradually drift, even without any difficult questions.
After asking a question, the operator should wait three or four seconds before checking the reading on the display.
Code
This project has both Blocks and Python code. The full explanation follows the Blocks code, so if you skip to the Python code now, make sure to return to read the explanation.
Blocks Code
Here is the Blocks code for this project.
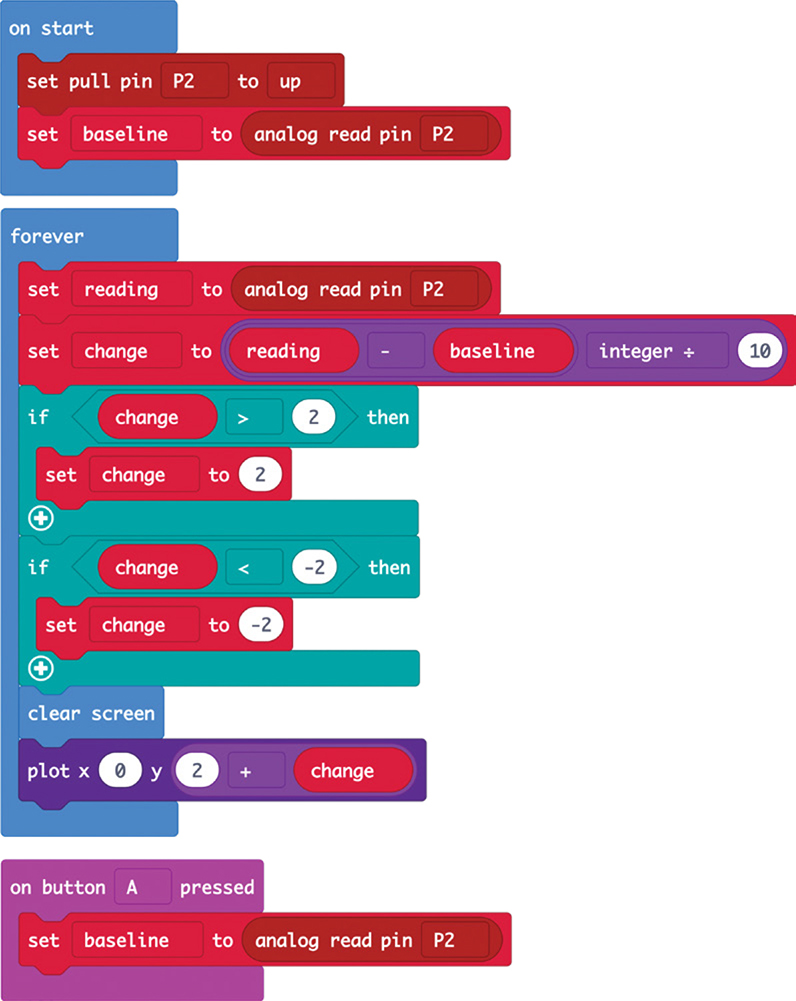
In the on start block, we place the block set pull pin, which enables the built-in 12kΩ pullup resistor. (The pullup resistor is disabled by default.)
Also in the on start block, we take a reading from pin 2, connected to one of the spoons, and store the result in the baseline variable. The program will compare any new readings against this baseline to see how much the subject’s skin resistance has changed.
We then use the forever loop to take a new analog reading from pin 2 that represents your subject’s GSR after answering a question you’ve asked. The loop subtracts the baseline reading from the new reading and divides the result by 10 to reduce it by about the right amount.
It uses this number to determine which of the five LEDs should light up. The number must fall within the range of –2 to 2 or an error will occur. Once this is done (using a couple of if blocks), the display is cleared, and the middle-column LED on the row 2 + change is lit using the plot block.
Pressing button A resets the baseline.

MicroPython Code
The MicroPython version of the code is shown here:
pin2.set_pull(pin2.PULL_UP)
baseline = pin2.read_analog()
while True:
if button_a.was_pressed():
baseline = pin2.read_analog()
reading = pin2.read_analog()
change = int((reading - baseline) / 10)
if (change > 2):
change = 2
if (change < -2):
change = -2
display.clear()
display.set_pixel(2, 2 + change, 9)
This works in much the same way as the Blocks code, with just a few differences. Here, we use the int function to convert the change in the reading values into an integer.
We then use the set_pixel method to tell the micro:bit display which LED to light up. This method is different from the plot block because it not only asks for the x and y coordinates but also requires you to provide a brightness level between 0 and 9. We choose 9 to make it as bright and visible as possible.
How It Works: Detecting Lies Through Sweat, Voltage, and Resistance
Skin resistance is one of the measurements used by polygraph lie detectors so often seen in movies.
If you flush or start to sweat, as you might when under pressure, your skin’s resistance to electricity changes. But testing for GSR might not always work. The questions you ask and how you ask them can influence a person’s reactions or make them feel nervous, and GSRs will differ from person to person. Conversely, people who are more detached from their feelings can learn how to defeat the polygraph. But for the Mad Scientist’s investigation into a possible surprise party, this lie detector is just the ticket.
This project converts readings of GSR into a voltage. Most metals have low resistance because metal conducts electricity well, whereas something like plastic has a high resistance because electricity does not generally flow well through plastic. We measure resistance using a micro:bit’s pin, which works as an analog input (see Chapter 1) and an arrangement of two resistors called a voltage divider (Figure 8-4).
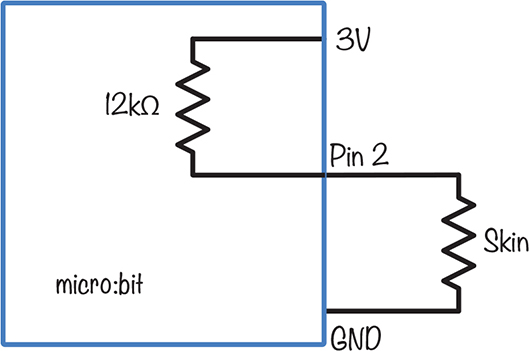
Figure 8-4: Schematic of a voltage divider
The unit of resistance is the ohm (Ω), and we normally abbreviate 1,000Ω to 1kΩ. In Figure 8-4, the 12kΩ resistor connected to pin 2 is a resistor built into the micro:bit’s processor. This resistor pulls the voltage at pin 2 toward 3V (think of the resistors in this diagram as springs); if you weren’t holding onto the spoons, this pull would be the only force acting on the pin, and the pin would register a maximum reading of 1023, or 3V.
However, as soon as the subject grasps the spoons, another resistor—the subject’s skin—comes into play. This counters the 12kΩ resistor by pulling the voltage at pin 2 back toward 0V. If your skin resistance was exactly 12kΩ, then the two resistances would be pulling equally, and the voltage at pin 2 would be 1.5V.
If the subject sweats, their skin resistance falls, pulling the voltage lower. Conversely, when they recover, their skin resistance increases, allowing the 12kΩ resistor to pull the voltage up.
SUMMARY
In this chapter, we conducted a few experiments on the human nervous system. The experiment and project we completed may have dubious scientific rigor, but hopefully you enjoyed yourself along the way.
In the next chapter, we’ll take measurements of the environment. Specifically, we’ll work with light and temperature, which are important to the Mad Scientist’s comfort.