

9
ENVIRONMENTAL MADNESS
The Mad Scientist loves to measure things. In this chapter, we’ll follow in the scientist’s footsteps by measuring the temperature. We’ll devise a temperature and light logger that will provide valuable insights into our environmental experiments. Then we’ll create a plant-watering project that uses a small pump to water a houseplant automatically when its soil starts to dry out.
EXPERIMENT 11: MEASURING TEMPERATURE

Difficulty: Easy
Owning no clothes besides lab coats and having skimped on the insulation budget for the Secret Laboratory, the Mad Scientist decided to build a custom heating system. To do this, they needed to know the exact temperature in every room of the lab. Unfortunately, they soon found the measurements taken with their micro:bit were not exact enough.
The micro:bit has a function named temperature in both the Blocks and MicroPython code that returns a temperature reading in degrees Celsius. However, the sensor itself is built into the micro:bit’s processor and thus is actually reporting the temperature of the micro:bit’s chip, not the temperature of the micro:bit’s surroundings.
At normal room temperature of around 20 degrees C (68 degrees F), if the micro:bit hasn’t been running for too long, the sensor gives a fairly accurate reading. However, we can’t be sure whether the temperature reading is correct if the micro:bit’s processor has been busy and started warming up.
In this experiment, you’ll investigate the difference between the temperature readings of a busy micro:bit and an idle micro:bit.
What You’ll Need
To do this experiment, you’ll just need two things:
Micro:bit
USB cable
You may also want a separate thermometer to check your readings against. The only other thing you’ll need is some patience, as you’ll need to leave this program running for half an hour to get good readings.
Construction
- This project uses Mu’s Plotter feature, which you’ll need Python for, so there’s no Blocks code for this. Find the code at https://github.com/simonmonk/mbms/. The Python file for this experiment is Experiment_11.py. Flash the program onto your micro:bit.. This code will take temperature readings every 20 seconds. It will also initiate micro:bit activity every 10 minutes and then idle for 10 minutes, letting you see the difference in temperature between when the micro:bit is busy and when it’s idle.
- Open both the REPL and Plotter views of Mu and press Reset on the micro:bit to start the reading process. A new temperature reading, and an indication as to whether the micro:bit has been busy or idle, are logged to the Plotter and REPL every 20 seconds. The busy/idle status of the micro:bit flips every 10 minutes. Figure 9-1 shows the result of logging the data for 40 minutes.
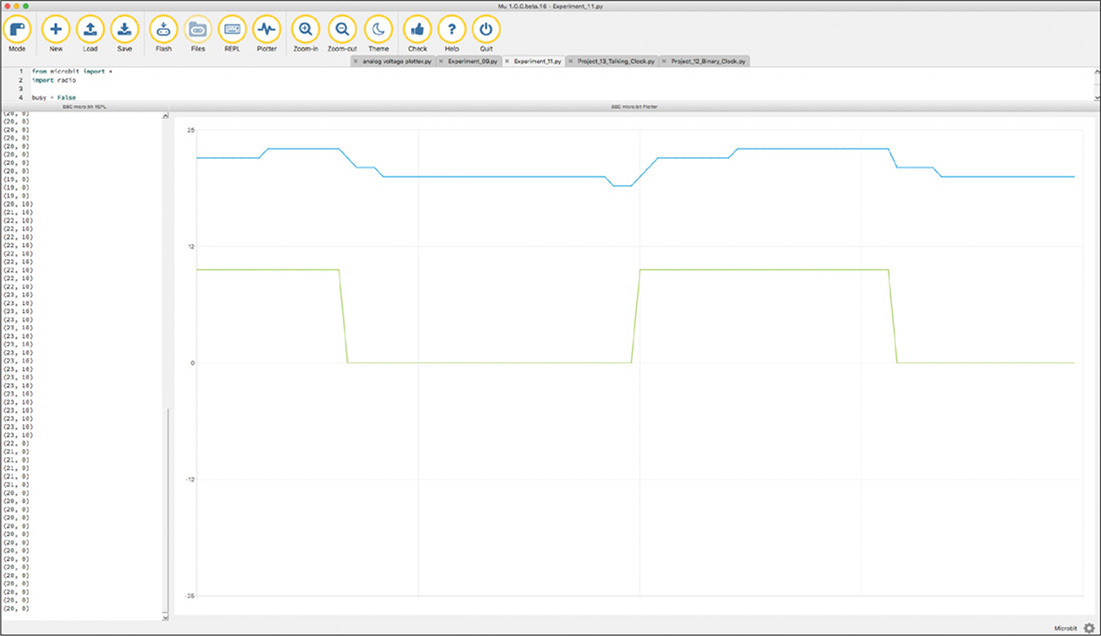
Figure 9-1: Plotting temperature readings and processor activity
The blue line shows the temperature reported by the temperature function, and the green line indicates whether the micro:bit is busy or idle. When busy, the micro:bit turns on the display and its radio interface, and it displays the message Busy over and over.
As you can see from Figure 9-1, when the micro:bit is in busy mode, the reported temperature rises by about 3 degrees C. When it goes back to idle mode, the temperature drops. Note that the temperature in the room, as measured by a separate thermometer, remained at 20.0 degrees C throughout the experiment.
Code
The MicroPython code for the experiment needs to do two things: flip the busy state (held in the variable busy) of the micro:bit every 10 minutes and report the temperature every 20 seconds.
Setting the Variables
Our code uses the variables last_busy_flip and last_log_time to record the last time these two things (flip and log) happened:
last_busy_flip = 0
busy_period = 600000
last_log_time = 0
log_period = 20000
The variable busy_period specifies the time in milliseconds between each flip between the busy and idle state; 600,000 milliseconds is equal to 600 seconds, which is 10 minutes. The variable log_period holds the time between temperature reports; 20,000 milliseconds is equal to 20 seconds. The code busy = False means the micro:bit starts off idle.
Making It Busy
If the micro:bit is in busy mode, both the display and radio are turned on and the message Busy is displayed. Otherwise, the radio and display are off.
if busy:
➊ display.on()
➋ radio.on()
display.show("Busy")
else:
display.off()
radio.off()
now = running_time()
if now > last_busy_flip + busy_period:
busy = not busy
last_busy_flip = now
now = running_time()
if now > last_log_time + log_period:
print((temperature(), busy * 10))
last_log_time = now
In a while loop, we say that if the busy variable is True, the micro:bit should turn the display ➊ and radio ➋ on. Otherwise, they should be switched off.
Then we have two tests to see whether either a flip of the busy status or a log to the REPL and Plotter are due: the code checks the current runtime against the values in the busy_period and log_period variables.
To easily see when the processor is busy on the same plot as the temperature (Figure 9-1), we multiply the True or False Boolean value of busy by 10. Python allows us to do this! Rather than reporting an error, Python interprets False as 0 and True as 1. Because Python treats the Boolean values as numbers, it lets us multiply them. Then, instead of being either 0 or 1, the value is plotted as either 0 or 10.
How It Works: Why Does a Processor Heat Up?
A processor chip, like the one used by micro:bit, contains tens or even hundreds of thousands of transistors. These transistors are electronic switches that are in either an on or off state (represented by 1 and 0 in binary). Transistors use a very small amount of current when they are in a particular state (either on or off), but require a small amount of additional energy to change states. This is why, when doing something processor intensive, your computer fans will rev up—they’re removing the excess heat generated by the large amount of switching.
A busy processor is a warmer processor. But other things can affect the processor temperature, too. In this experiment, the LEDs used by the display give off a little heat, as does switching the radio on and off. So, even though our definition of busy is a little misleading because it includes turning the radio and display on and off, the idea that the micro:bit’s temperature readings are influenced by what the micro:bit happens to be doing still stands.
PROJECT: TEMPERATURE AND LIGHT LOGGER

Difficulty: Medium
As a hopeless perfectionist and incorrigible botanist, the Mad Scientist wanted a way to measure the ideal location for all the plants in the laboratory. And so a logger of temperature and light was born.
In Experiment 7, we wrote acceleration readings into a file for later analysis. In that case, we wanted to take readings immediately. Here, we want to log values over a period of time, say over the course of a day.

Figure 9-2 shows the completed project. As you can see, we have built it into a transparent food container to protect it from the elements, in case we want to use it outdoors.

Figure 9-2: A temperature and light logger
You could use this logger to carry out a survey of your yard and determine the best place to grow different plants.
What You’ll Need
For this project, you’ll need the following items:
Micro:bit
Monk Makes Sensor for micro:bit Another temperature and light sensor would work as well.
4 × Alligator clip cables
AAA battery pack
Transparent plastic food container This is essential if you want to use the project outdoors. The container should be big enough to house the project, including the battery pack.
Construction
- This project uses the micro:bit’s local filesystem, which is not available in Blocks code yet. Therefore, this project can be done only in Python. Find the code at https://github.com/simonmonk/mbms/. The Python file for this experiment is ch_09_Logger.py. Flash the program onto your micro:bit.
- Connect the micro:bit to the sensor board, as shown in Figure 9-3.

Figure 9-3: Connecting the micro:bit to the Monk Makes Sensor
- Place everything into the food container, making sure that the sensor and micro:bit are at the top, near the lid. Fitting the alligator clips from the back of the boards will help.
- Turn on the battery pack. When you’re ready to start logging, press button A and then put the lid on the container. The display will change to show a single dot.
- The logger can hold about 2,000 readings, so at a rate of one sample per second, it can run for 33 hours before running out of memory. This is about how long a set of AAA batteries should last.
When you’re ready to stop the readings, press button A again. You can then connect the micro:bit to your computer and use Mu’s Files feature to transfer the file data.txt onto your computer, just as you did in Experiment 7 back in Chapter 5.
- To make sense of the data, you’ll probably want to import it into a spreadsheet and draw some charts like the one in Figure 9-4. See Experiment 7 in Chapter 5 for an example of importing data from the data.txt file into Google Sheets.
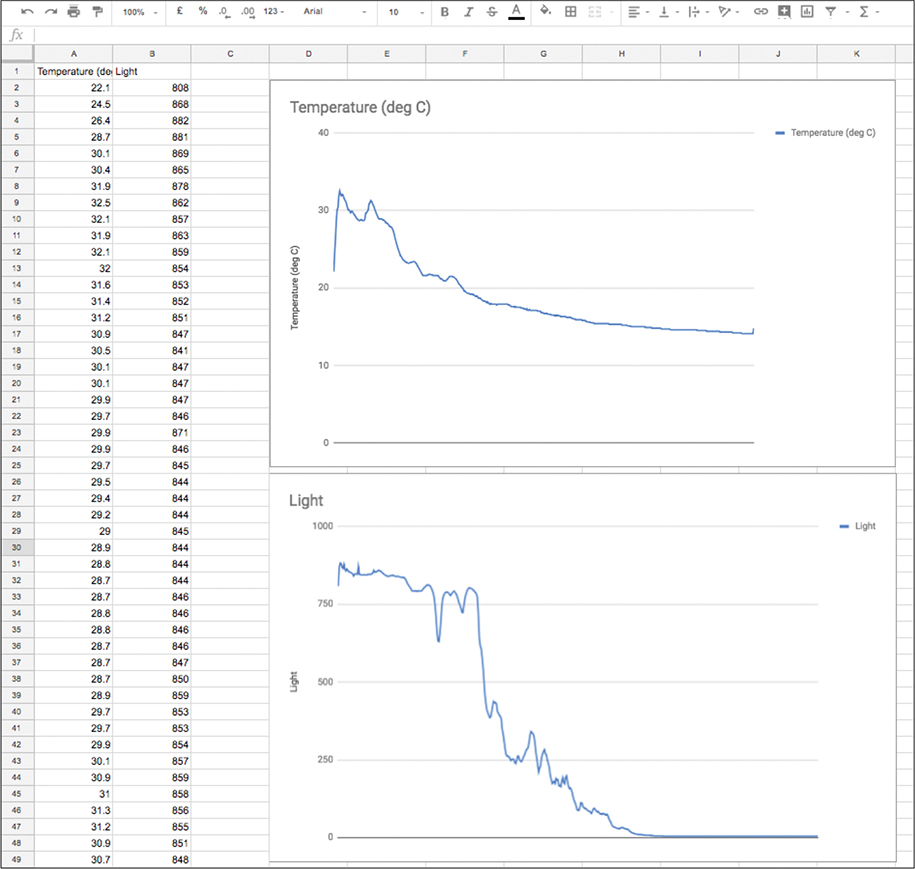
Figure 9-4: Charting temperature and light
In Figure 9-4, the steep drop of the line in the light chart indicates the nightfall.
Code
For this project, we’ll need to import the os library, which we’ll use to delete any data file that might already be on the micro:bit. We do this to make space for our new readings. We’ll also need log from the math library to write the code that calculates the temperature. Log (or logarithm) is a mathematical concept used in the Steinhart-Hart equation that converts the resistance measurement of a thermistor to a temperature. If you are into math, you might like to read more about logarithms here: https://www.mathsisfun.com/algebra/logarithms.html.
Setting the Variables
The code for this project waits for button A to be pressed and then repeatedly takes readings first of temperature then of the light level. Both readings are then written to a file so that when the logging is finished, they can be transferred a computer.
filename = 'data.txt'
temp_pin = pin1
light_pin = pin2
last_sample_time = 0
recording = False
display.show(Image.NO)
We set the variable sample_period to 60000 milliseconds, or 1 minute. This period tells the micro:bit to take a recording once a minute. By default, the recorded data will be saved into a file called data.txt. You can change the name of this file by changing the value of the filename variable.
We tell the micro:bit which two pins are connected to the temperature and light outputs of the sensor board in the temp_pin and light_pin variables. In the last_sample_time variable, we store the last time a reading of the environment was recorded.
We use the variable recording to keep track of the whether the project is recording or not recording. This variable is toggled between True and False every time button A is pressed.
Reading the Temperature
We create the function read_c to read the temperature. This involves quite a lot of math.
r0 = 100000.0
r2 = 100000.0
b = 4250.0
v33 = 3.3 # actual result is independent of this value
V = temp_pin.read_analog() * v33 / 1023.0
R = r2 * (v33 - V) / V
t0 = 273.15 # 0 deg C in K
t25 = t0 + 25.0 # 25 deg C in K
# Steinhart-Hart equation (google it)
inv_T = 1/t25 + 1/b * log(R/r0)
T = (1/inv_T - t0)
return round(T, 1)
We won’t go into the math in detail, but it’s here in case you want to look through it.
This function measures the voltage at the temp_pin (pin 1) and uses that to calculate the temperature in degrees Celsius. See “How It Works: Sensors” on page 211 for more information on how this works.
If you want your temperatures in Fahrenheit, use the function read_f, which calls read_c and converts the temperature to Fahrenheit:
return read_c() * 9/5 + 32
Reading the Light Level
The temperature readings are in units of Celsius or Fahrenheit. However, the light level is not expressed in any specific units. The light readings are just the direct analog readings from pin 2. In effect, we have defined our own units. You can give them a name if you like, perhaps lightiness?
Measuring light intensity in its standard unit of lux is difficult with this kind of sensor. But if you have a calibrated lux meter, you could carry out your own experiment to compare Lux and lightiness under different levels of illumination.
The while Loop
The main while loop (at the end of the code if you are following along in Mu) checks for a press of button A, toggling recording between True and False whenever the button is pressed. When recording starts, a single dot is displayed, and we delete the existing data file with os.remove. The remove command is contained within a try: except: Python structure. This makes sure that if an error occurs, probably because the data file isn’t there and can’t be deleted, the error is ignored and doesn’t crash the program. After we remove the old file, the new file is opened with a mode of w for writing.
When button A is pressed again, the NO image is displayed and the file closed.
In the main while loop, there is also an if block that writes the readings from the light and temperature sensors to the file as long as recording is True and enough time has elapsed since the last_sample_time.
if button_a.was_pressed():
recording = not recording
if recording:
display.show(".")
try:
os.remove(filename)
except:
pass
fs = open(filename, 'w')
else:
display.show(Image.NO)
fs.close()
now = running_time()
if now > last_sample_time + sample_period:
last_sample_time = now
if recording:
temp = read_c()
light = light_pin.read_analog()
fs.write(str(temp) + "," + str(light))
fs.write(' ')
How It Works: Sensors
Thermistors are a special type of resistor (see the lie detector project in Chapter 8) whose resistance changes as the temperature changes. The type of thermistor used in the Monk Makes Sensor for micro:bit is an NTC (negative temperature coefficient). The negative part means that when the temperature increases, the resistance decreases. We use the resistance to measure the temperature.
Our thermistor sensor measures temperature as electrical resistance. However, a micro:bit cannot measure resistance directly. Instead, resistance must first be converted into a voltage, and this can then be read by the micro:bit pin that’s acting as an analog input. To do this, we need to use a voltage divider as we did in the lie detector project of Chapter 8. However, this time a thermistor, rather than someone’s skin, will provide the variable resistance (Figure 9-5). Note that the Monk Makes Sensor for micro:bit board has the 100kΩ resistor built in.

Figure 9-5: Schematic diagram for using a thermistor to measure temperature
A thermistor’s resistance does not change every time there is a difference of some number of ohms, indicating a change of one degree. As you saw in the code earlier, the formula for calculating a thermistor’s resistance is complicated, involving the use of logarithms.
When you buy a thermistor, it will specify two parameters:
![]() The resistance of the thermistor at 25 degrees C (called r0 in our code and equal to 100kΩ for the sensor board)
The resistance of the thermistor at 25 degrees C (called r0 in our code and equal to 100kΩ for the sensor board)
![]() A constant called beta, or sometimes just B, that is different for different thermistors (In our code, this is called b. For the thermistor on the sensor board, b is 4,250. The value of beta will always be specified on the datasheet for the thermistor.)
A constant called beta, or sometimes just B, that is different for different thermistors (In our code, this is called b. For the thermistor on the sensor board, b is 4,250. The value of beta will always be specified on the datasheet for the thermistor.)
You can see how the calculation is made in the code. If you want to know more about this formula, search online for “Steinhart-Hart equation.”
Because the voltage at pin 1 depends on the ratio of the resistance of the thermistor to the fixed resistor, it is independent of the supply voltage. This is just as well, because the 3V connector of the micro:bit can be anything from 3.3V down to about 2V, depending how you are powering the micro:bit and how fresh the batteries are. This is why you will see the comment in the read_c function explaining that the variable v33 (3.3V) has no effect. In fact, it cancels out in the math. It is included only to make the math a bit easier to follow.
PROJECT: AUTOMATIC PLANT WATERER
Difficulty: Hard
Ever busy with conferences that take them away from the Secret Lab, the Mad Scientist has devised this automatic plant waterer. The project monitors the resistance of the soil to determine how wet it is. If the soil gets too dry, it turns on a water pump. Pressing button A gives a readout of the soil dryness, and pressing button B acts as a test, running the pump for 10 seconds.

Figure 9-6: The automatic plant waterer project
What You’ll Need
For this project, you’ll need the following items. See the appendix for more information on where to find these.
Micro:bit
Relay board for micro:bit To switch the pump on and off (You could also use a motor controller such as the Kitroniks board that we used in the rover project of Chapter 6.)
12V aquarium metering pump These pumps are slow but reliable.
Tubing and connectors To transfer the water from the reservoir to the plant pot
Large plastic bottle To serve as a water reservoir for the plant
12V power supply for the pump 12V at 1 amp or more
USB power supply for the micro:bit or a Monk Makes Power for micro:bit and AC adapter This is a long-term project, so you don’t really want to be running it from batteries. See the appendix for long-term micro:bit power options.
1kΩ resistor
Female DC barrel jack to screw terminal adapter To connect the relay and battery to the pump’s power supply
7 × Alligator clip cables To connect the nails to the micro:bit
Fold-back binder clips To keep the watering tube in place
2 × 5-inch nails To be used as electrodes in the plant pot (Note that 6-inch nails also work just fine. Galvanized (zinc-coated) nails are best because they don’t rust.)
Potted plant

The pump you need is a peristaltic pump, sometimes called a dosing pump. You can find one on eBay for a few dollars. These pumps usually come with short inlet and outlet tubes that you’ll need to extend so they can reach from the water reservoir to the pot. They are generally 4 mm in diameter, a common size for garden irrigation systems. You can find such tubing and connectors at eBay, a hardware store, a tropical fish store, or a garden center.
You’ll need longer alligator clip cables to connect the micro:bit to the nails. A good size would be about 1 foot (30 cm).
The water reservoir can be anything that will contain a reasonable volume of water (an old milk container would do fine).
Construction
You’ll need to take extra care when building this project, as it has both an electronic and mechanical component. What’s more, it pumps water around, so if you don’t connect the pipes correctly, you could cause quite a mess in your Secret Lab!
Figure 9-7 shows how the electronics are connected to give you an idea of what you are aiming for as you follow the step-by-step instructions.
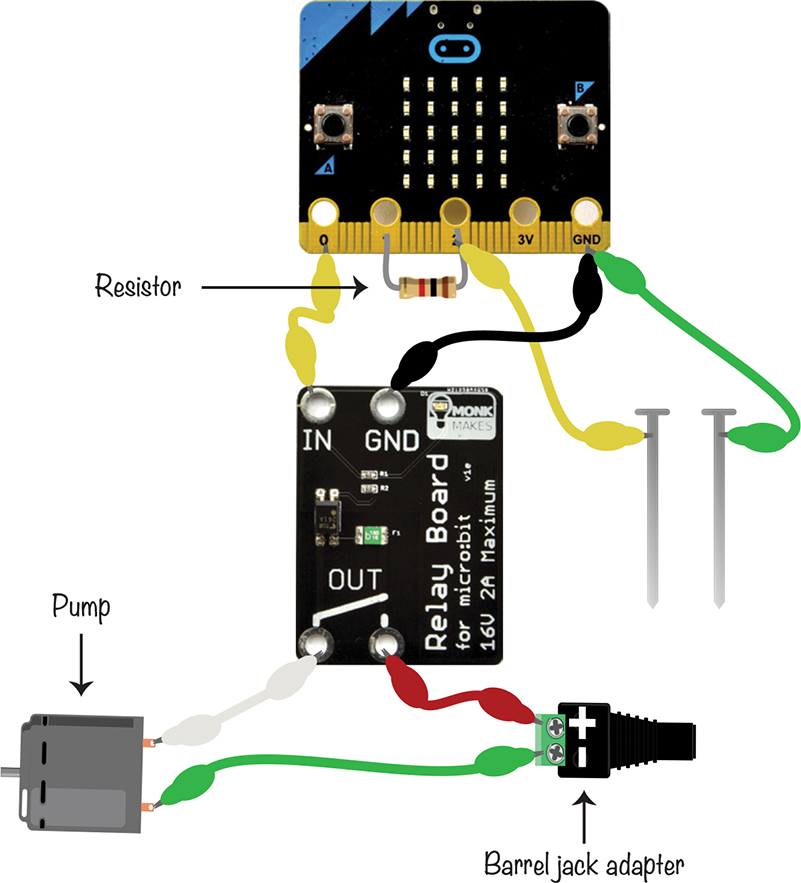
Figure 9-7: Wiring for the automatic plant waterer project
- Open https://github.com/simonmonk/mbms/ and click the link for Plant Waterer. Click Download and then copy the hex file onto your micro:bit. If you get stuck on this, head back to Chapter 1, where the process of transferring programs to your micro:bit is explained in full. The Python version of the code is in ch_09_Plant_Waterer.py.
- Wrap the 1kΩ resistor’s wires around pins 1 and 2 of the micro:bit.
- Using Figure 9-7 as a reference, wire up the alligator clips to the micro:bit, relay board, barrel jack, and pump. Don’t attach the yellow and green cables to the nails or connect the tubes to the pump just yet. To get the alligator clips to attach to the screw terminal ends of the DC barrel jack adapter, use a screwdriver to fully open the screw terminals. If your alligator clip jaws are too big to fit into the screw terminal holes, you can fit straightened-out paper clips into the screw terminals and then clip the alligator clips onto those.
- Plug the 12V power adapter into the barrel jack adapter and then press button B on your micro:bit. You should hear the pump run for 10 seconds and then stop. If it doesn’t do this, double-check your wiring.
- Push the nails into the soil of the plant pots spaced about 3 or 4 inches (8 to 10 cm) apart. Leave enough of the nail above the soil that you can attach the green and yellow alligator clips, as shown in Figure 9-8.
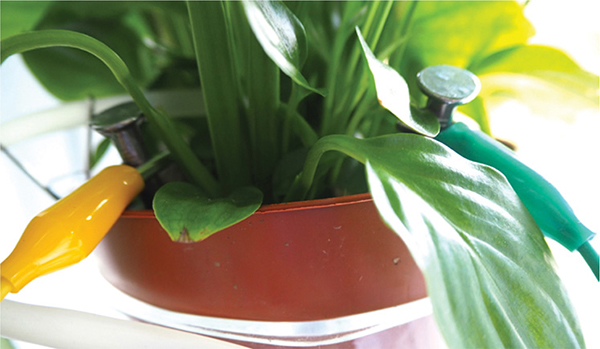
Figure 9-8: Positioning the nails in the soil
- Now, press button A on your micro:bit, and a number should scroll across the screen. This is a measure of the dryness of the soil. The drier the soil, the higher the number. Try adding a little water to the pot, wait for a few seconds, and then press button A again. You should see the number decrease. Don’t make the soil too wet, though, as it will take ages to dry out again and you won’t get to see the plant waterer in action.
You now need to give the plant the right amount of water. You may need to consult someone with a green thumb who knows about your particular plant. Once you’ve found out how moist your plant’s soil should be, keep adding small doses of water until the soil is damp enough. Then press button A and make a note of the number. This is your target dryness for the automatic plant waterer.
- We’re now ready for the wet part of this project. Start by measuring out suitable lengths of tubing from the pump. You want enough tubing that you can put one length through the top of the reservoir bottle and have it reach the bottom and the other will reach from the pump into the plant pot. Before attaching the tubing, you need to find out which nozzle of the pump is the inlet and which is the outlet. To do this, press button B and put a finger over each of the pump’s tubes. You will feel the inlet pump sucking at your fingertip. Make a note of which tube is which.
Use the tube connectors to attach these lengths of tubing to the pump’s short tubes.
- Clip the binder clips onto the side of the pot and push the tubing through the handles of the clip, as shown in Figure 9-9.
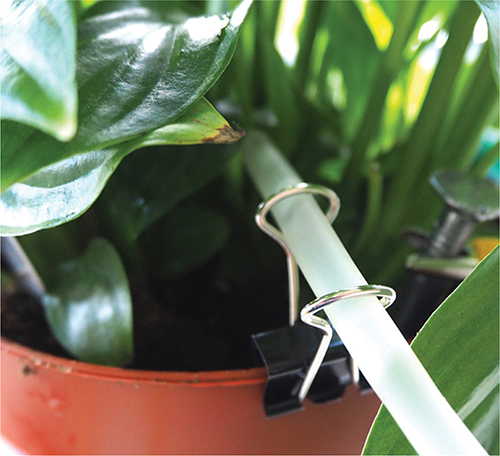
Figure 9-9: Securing the tube to the plant’s pot
- Fill up the reservoir bottle and push the extended inlet tube into the bottle, down to the bottom.
- Test the pump by pressing button B a couple of times. If the water finds its way to the pot without any dripping or leakage, the waterer is almost ready to go. If not, find and seal the leaks by adjusting the connections.
- The final step before you can let your plant waterer do its mundane work, leaving you free for more adventurous tasks, is to adjust the value of dry_threshold. Set dry_threshold to the value you recorded in step 6 and then flash the program onto your micro:bit again.
Code
The code for this project is quite complex. As well as monitoring the soil’s moisture content, it also has to handle button presses and make sure that the pump doesn’t get too carried away and flood the lab.
Blocks Code
Here is the Blocks code for the project.

In the on start block, we define three variables:
dry_threshold We put our value from step 6 here. If the plant gets dryer than this value, it will be watered.
on_time_ms This is the amount of time (in milliseconds) that the pump will run when watering. Keeping this value small (say 10 seconds) will keep the plant from being overwatered. It will also prevent accidents that might result in minor flooding!
check_period_ms The water needs a little time to spread throughout the pot and evenly wet the soil. This variable sets the delay between each dryness check. By default, it’s set to 3,600,000 (1 hour in milliseconds).
If we have an on_time_ms value of 10, the maximum watering time the plant can receive in one day is 24 × 10 seconds or 4 minutes. With this kind of pump, it will receive about a pint (500 mL) of water. That’s quite a lot, but if you have a really big pot, you may need to decrease check_period_ms or increase on_time_ms to allow the plant to get even more water. We’ll discuss this further in “Things to Try” on page 222.
Besides these three variables, we have two functions, check_dryness and water_the_plant. The check_dryness function updates the dryness variable with a new soil reading from pin 2. Notice that this function also turns on pin 1, but just while the reading is being taken. We’ll explain why in “How It Works: Measuring Soil Dampness” on page 222.
The water_the_plant function turns on pin 0 to activate the relay, turns on the pump for the time specified in on_time_ms, and displays the down arrow on the micro:bit to indicate that watering is in progress (a bit like it’s raining).
With the forever loop, we first check whether sufficient time has elapsed since the last check (by default 1 hour). If enough time has passed, the loop calls check_dryness and compares this reading to the dry_threshold. If the pot is too dry, water_the_plant is called.
Now that the check is complete, the dont_water_until variable is set to the current time plus the check_period_ms to schedule the next check. The dryness is then shown on the display using the plot bar graph of block. The higher the level of LEDs on the display, the drier the soil is and the closer it is to being given more water.
Then we have the code that checks whether button A is pressed and reacts appropriately. This code calls check_dryness and then displays it before showing the bar graph again. The handler for button B calls water_the_plant and then displays the dryness level.
MicroPython Code
Here is the MicroPython version of the code:
dryness = 0
dry_threshold = 500
on_time_ms = 10000
check_period_ms = 3600000
dont_check_until = 0
def water_the_plant():
pin0.write_digital(1)
display.show(Image.ARROW_S)
sleep(on_time_ms)
pin0.write_digital(0)
def check_dryness():
global dryness
pin1.write_digital(1)
dryness = pin2.read_analog()
pin1.write_digital(1)
def bargraph(a):
display.clear()
for y in range(0, 5):
if a > y:
for x in range(0, 5):
display.set_pixel(x, 4-y, 9)
while True:
if button_a.was_pressed():
check_dryness()
display.scroll(str(dryness))
bargraph(dryness / 200)
if button_b.was_pressed():
water_the_plant()
check_dryness()
bargraph(dryness / 200)
if running_time() > dont_check_until:
check_dryness()
if dryness > dry_threshold:
water_the_plant()
dont_check_until = running_time() + check_period_ms
bargraph(dryness / 200)
Because MicroPython has no equivalent of the plot bar graph of block, we use the bargraph function from the Shout-o-meter in Chapter 2 to display the dryness level.
Things to Try
Because the plant waterer keeps the moisture level of the plant more or less constant, you can measure the amount of water the plant is using by seeing how much water has left the reservoir.
Use a measuring cup when you refill the reservoir bottle and log how much water you need to fill it back up. Once you know how much water your plant typically needs per day, you can work out how long your reservoir should last before it needs a refill. This will be very important if you want to keep your plant alive when you go on vacation.
How It Works: Measuring Soil Dampness
Impure water (such as water in soil) has a much lower electrical resistance than air. In other words, the dryer the soil, the higher its electrical resistance, and the more water in the soil, the lower its resistance. By measuring the resistance between the two nails, we can measure the dryness of the soil.
If you look back at Figure 9-7, you can see that there is a resistor between pins 1 and 2. To make it easier to see what is going on, another way of visualizing the schematic is shown in Figure 9-10.
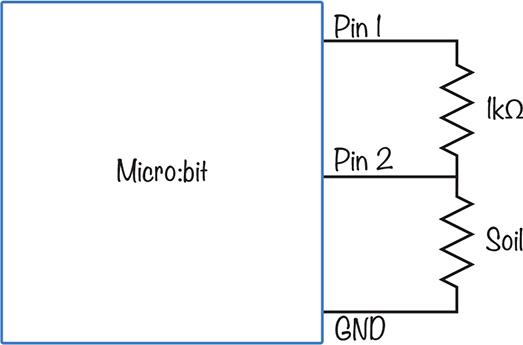
Figure 9-10: Schematic for measuring soil resistance
Notice that the diagram in Figure 9-10 is almost identical to the one in Figure 8-4 on page 198, where we were measuring skin resistance (rather than soil resistance) in the lie detector project. The one big difference is that rather than being connected permanently to 3V, the top of the fixed 1kΩ resistor is connected to pin 1. When we take a measurement of the soil dryness, we first set pin 1 high (to 3V) to take the reading and then set the pin back to 0V.
The reason for using Pin 1 instead of the 3V connection is that we want to allow electricity to flow through the soil only intermittently. If the resistor were attached to 3V, an electric current would always be flowing through the soil, messing up the readings and speeding up corrosion of the nails. This process is known as electrolysis. By only turning on pin 1 for the brief time that we take a reading, we avoid this problem.
SUMMARY
In this chapter, we explored how to measure temperature, created a temperature and light level data logger, and created an automatic plant waterer. In the next chapter, we’ll see how the Mad Scientist uses the micro:bit’s built-in radio library.