The IDE provides numerous tools beyond those featured in the editor to assist you in designing and writing code. In fact, there are so many tools and tips that I needed two parts to describe them all. Chapter 5 focuses on tools that are provided as a tool window. Chapter 6 focuses on tools that are either dialog boxes or Web pages.
The majority of the tools offered by the IDE exist as tool windows. Unlike a dialog box, where you can interact only with the tool when the dialog box is open, a tool window allows you to quickly toggle between your editor and the tool.
This section covers tips for the Command Window, Toolbox, Task List, Output window, and Object Browser.
The Command Window allows you to run Microsoft Visual Studio commands from what looks and feels like an operating system command prompt. For example, instead of going through the Find And Replace window UI to conduct a find, you can use the Command Window to perform the search.
Press Ctrl+Alt+A to open the Command Window, or go to View–Other Windows–Command Window. Now you can run various Visual Studio commands without having to go through the menus.
Examples of such commands include the following:
>File.Open c:samplesmyFile.txt. Opens a file without going through the menu
>Help vs.commandwindow. Opens a Help topic directly
>? i. Returns the contents of the variable i
>? i = 10. Sets the contents of the variable i
For more commonly used commands that take arguments for Visual Studio 2008, check out the following documentation: http://msdn2.microsoft.com/en-us/library/c338aexd(VS.90).aspx
Autocompletion is also provided for both the commands
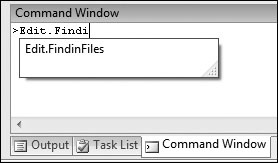
and their corresponding arguments.
Almost all Visual Studio commands can be run via the Command Window, scope willing. The next screen shot shows what the UI looks like when you type in the Edit.Find command via the Command Window.
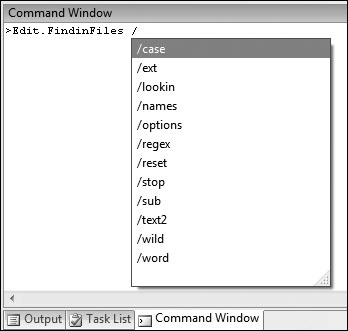
Here are the additional Command Window options:
>Edit.Find /options. Shows which options are currently set
>Edit.Find /reset. Clears all options
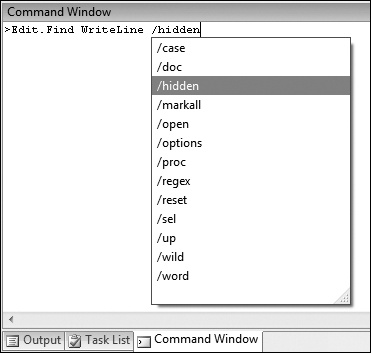
Examples of such commands include the following:
>Edit.Find MainForm /case /proc. This is a Quick Find command that matches case in the current procedure.
>Edit.Find MainForm /o /w /m /u /h. This is a Quick Find command that opens documents, matches a whole word, marks matches, searches up, and searches hidden regions, respectively.
>Edit.Replace Class1 Class2 /doc /all. This is a Quick Replace command that replaces all occurrences of Class1 with Class2 in the current document.
>Edit.FindInFiles Program /lookin:"c:UserssarafDocumentsVisual Studio 2008Projects" /ext:*.cs /text2. This is a Find In Files command that looks in the Projects folder for files with the .cs extension and shows results in the Find Results 2 window.
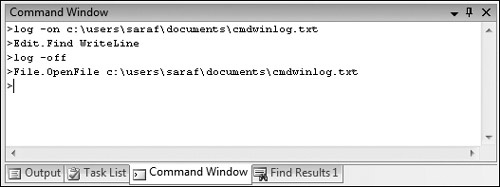
You can record your Command Window session via the log command. Type log -on <filename> to start recording. To finish logging, type log -off.
There is also an option to overwrite the existing file; if you don’t choose this option, the log command appends the text by default.
The command Tools.Shell runs an external executable out of process from Visual Studio—for example, Shell <executable>.
But of course, there are optional arguments. Following are examples of optional arguments for the Tools.Shell command:
Shell [/commandwindow] [/dir:folder] [/outputwindow] <executable> [/args]
/commandwindow ( or /c). Use this command to display the executable’s output in the Command Window.
/dir:folder. Use this command to specify the working directory.
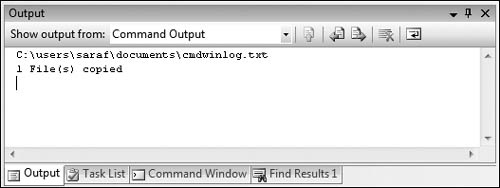
/outputwindow (or /o). Use this command to display the executable’s output in the Output window.
For example, Shell /o xcopy.exe c:userssarafdocumentscmdwinlog.txt c:userssaraflogfiles displays the xcopy output in the Output window.
To create an alias, open the Command Window and type alias ha Help.About.
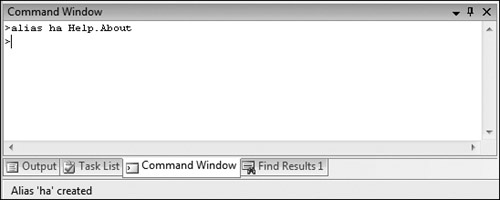
Now typing ha in the Command Window pops open the Help–About menu.
But let’s explore a more practical application. Consider creating the alias se for Solution Explorer, as shown here:
>alias se View.SolutionExplorer
The idea for this example is that while you are coding in the editor, you can press Ctrl+/ to jump to the Find window and type se.
Actually, you’ve probably already used one of the predefined aliases before. The command Debug.Print is alias to ?. To see the full list of aliases, type alias.
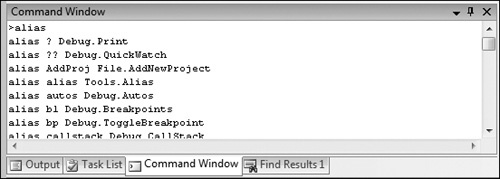
Finally, to reset your Command Window aliases back to defaults, type alias /reset.
Or you can simply use the /delete switch to delete a particular alias—for example, type alias se /delete to delete that se alias.
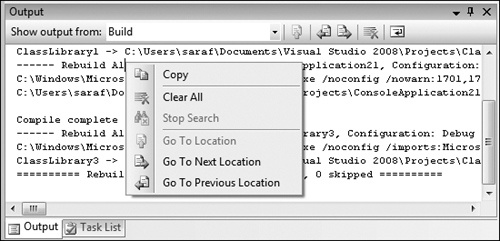
The Output window is commonly used to review the results of your build or to display debugging data. These tips review how you can customize and navigate the Output window.
F8 and Shift+F8 are bound to the commands Edit.GoToNextLocation and Edit. GoToPreviousLocation. If you have the Error List open, F8 and Shift+F8 take you directly to the error in question by highlighting that part of the code. If you have the Output window open, F8 and Shift+F8 put the cursor on each error listed.
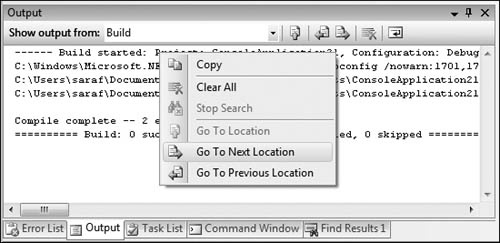
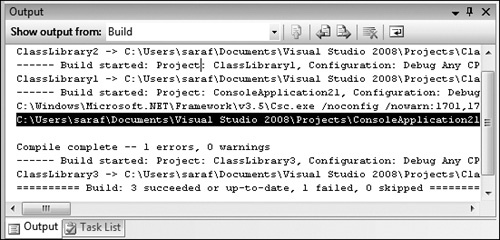
If you double-click any error or warning in the Output window, you jump directly to that location in the file or to the closest equivalent location.
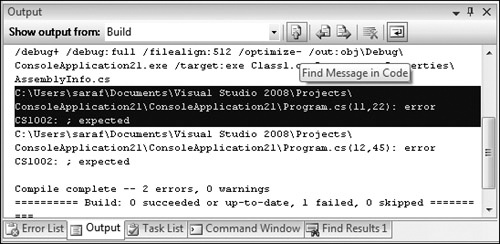
There’s also a button on the Output window toolbar that allows you to do the same thing, just in case you ever wondered what this Find Message In Code button did.
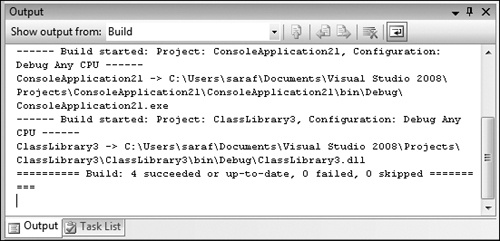
The Output window has a Show Output From drop-down list, as shown in the following screen shot, to move between various outputs views (or panes), such as Debug and Build. There’s a command called Window.NextSubPane that navigates to the next output pane.
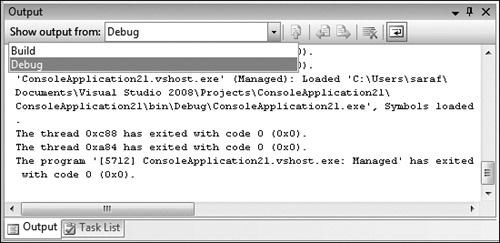
The command in itself isn’t that interesting, but you can bind it to a keyboard shortcut—for example, Ctrl+Shift+Alt+O, since Ctrl+Alt+O is the keyboard shortcut to use for the Output window under the General Development Settings.
Now you can toggle easily between Debug and Build views in the Output window by using a keyboard shortcut.
At some point, you’ll experience the Output window sliding out from its autohiding place during a build. If you want to fine-tune this experience so that the Output window shows only when you tell it to (maybe you just want to check the status bar for the build status or have the Error List pop up if errors occur), go to Tools–Options–Projects And Solutions–General. Check the option called Show Output Window When Build Starts.
Now the Output window will be displayed whenever a build is started.
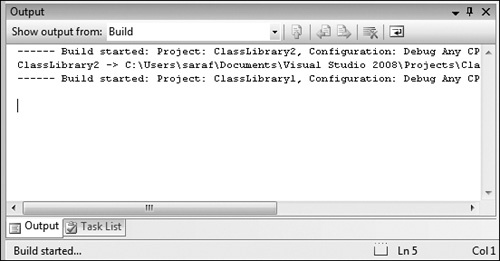
The Output window has an icon on the toolbar that allows you to enable word wrap.
Here is the Output window before pressing the Toggle Word Wrap button.
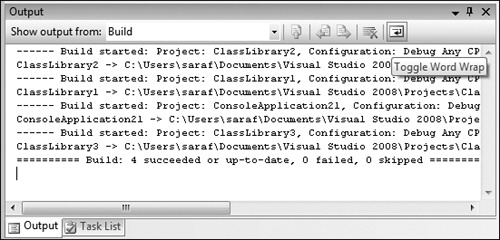
Here is the Output window after pressing the Toggle Word Wrap button.
On the Tools–Options–Environment–Fonts And Colors page, in the Show Settings For combo box, there’s an Output Window option.
When it’s selected, you’ll be able to customize the colors for the following types of text: Plain Text, Selected Text, and Inactive Selected Text. Additionally, you can customize the color of the Current List Location.
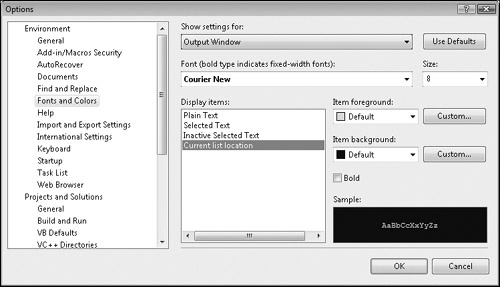
If you set the Item Background to Black and the Item Foreground to White, the Output window displays the visited line in the new color scheme.
Depending on your environment settings, such as the Visual Basic Development Settings, you may have noticed that the Output window’s debug content is redirected to the Immediate Window instead. Or maybe you want the Output window’s debug content to go to the Immediate Window.
Go to the Tools–Options–Debugging–General page. On this page, you’ll find the option Redirect All Output Window Text To The Immediate Window.
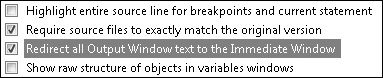
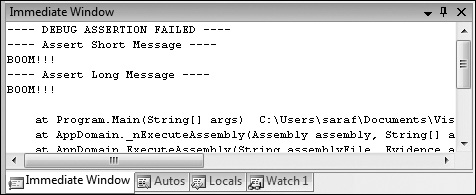
To illustrate, let’s say you have this option enabled and you hit an assert. You’ll see the assert information in the Immediate Window and not in the Output window.
The Toolbox is your one-stop shop for everything you can put into a designer or editor. These tips explore the ins and outs of your Toolbox, including how to use that General tab to quickly store a block of code.
This tip is especially helpful if you are going to write code in a presentation. Instead of having to type code in front of everyone, you can have it all typed up on the side, ready to go!
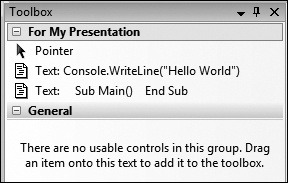
You’ve probably noticed the Toolbox General tab showing this information by default.
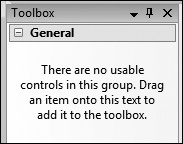
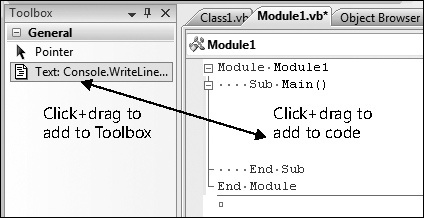
Probably one of the best-kept secrets is that you can actually drag and drop code onto the Toolbox. Just highlight some text and then Click+Drag and that text into the General tab. You’ll see the following:
But it gets better.
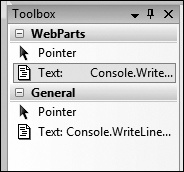
You can actually drag code to any tab on the Toolbox, including user-created tabs. Note that you may need to select Show All on the Toolbox context menu to display additional tabs so that you can drag the code onto the tab. But after that, the tab will appear whenever you can insert code.
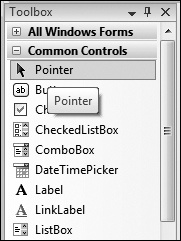
You’ve probably noticed how the Pointer control appears at the top of each tab group. This is because whenever a control is selected in the Toolbox, the mouse pointer automatically becomes a drag pointer for that control, meaning that you just have to put your mouse pointer onto the form and click, and the control is dropped. You don’t have to hold down any keys to do the actual drag.
But you may not actually want to use the drop function at this time. You can put the focus on the Pointer control to ensure that you don’t accidentally drop the item.
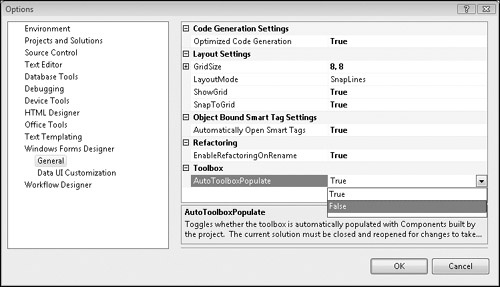
If you have a solution with lots of projects in it, and you notice the Toolbox is taking a long time scanning the solution for all possible Toolbox items, you can go to Tools–Options–Windows Forms Designer–General and set AutoToolboxPopulate to False.
Typing * expands everything in the Toolbox. Typing / collapses everything. (Just type the / key; do not use Shift+/ because that will produce a ?.)
Note that the * really does expand all items, including subnodes. In other words, I must warn you: do not, and I really mean do not, try to do this at your root c: directory. If you do, you’ll get to watch Windows Explorer expand every single folder on your machine, which may take a while.
You can also consider using + (plus sign) and - (hyphen), which work for all standard TreeView controls without expanding all or collapsing all. I just tend to use the standard Right Arrow key to expand and Left Arrow key to collapse so that I don’t have to reach as far.
To recap, typing * or + or pressing the Right Arrow key expands the tab.
And pressing / or - or pressing the Left Arrow key collapses the tab.
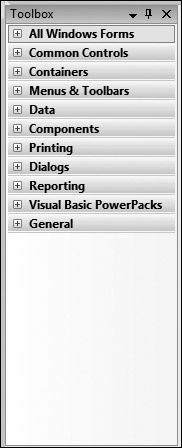
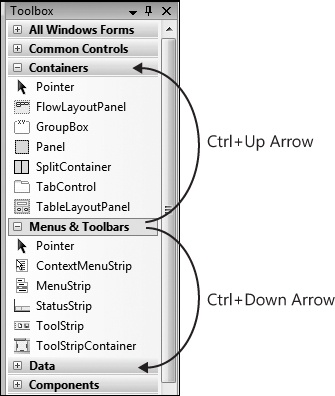
You could page up and down throughout the Toolbox to reach the previous or next control group, or you could just use Ctrl+Up Arrow or Ctrl+Down Arrow.
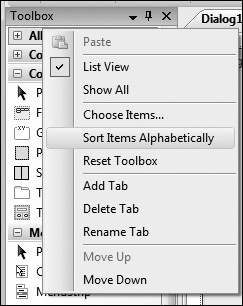
Most of the time, the controls are listed in alphabetical order. But if you ever need to do a reset, you can bring up the Toolbox context menu and select Sort Items Alphabetically.
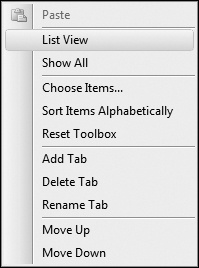
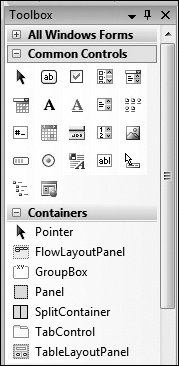
Here’s yet another action I had no idea you could use until someone showed it to me. By having just the Icon view open, you can save a lot of space within the Toolbox.
For each Toolbox grouping, you can customize whether to show the flat list of controls and their names or just show their icons. Right-click anywhere in the desired group, and toggle off List View.
What happens is that all the controls in the Toolbox are managed by the active designer. A designer is like an editor because it takes up the same region of space in the IDE, but it allows you to design UI rather than write code. You can recognize a designer by the [Design] in the file tab. So, if the currently active designer doesn’t support a particular control, you won’t see it when you add it to the Toolbox.
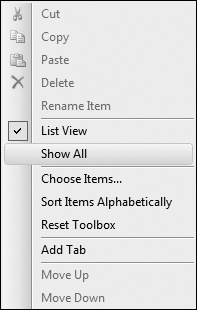
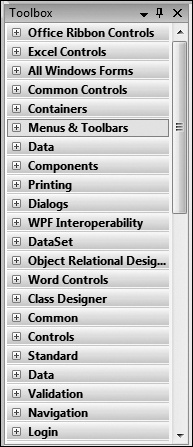
By choosing Show All, you can at least verify that your control was added. Now, how to get it active depends on the control and which designer is needed.
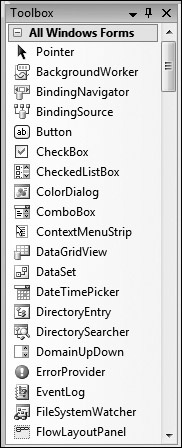
In the next screen shot, notice the scroll bar position on the right, showing just how many controls are now visible.
You can use the mouse to drag and drop controls to a new tab, and you can even use Ctrl+Drag to copy controls to a new tab. But did you know you can use the keyboard to achieve the same functionality?
Use the classic Ctrl+C to copy any Toolbox control, and use the classic Ctrl+V to paste into the desired tab location.
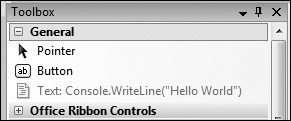
Note how the preceding image illustrates having both code and a button control within the General tab. Also note that I have the Show All option enabled to show the disabled code because when I took this screen shot, the WinForms designer was the active document in the IDE.
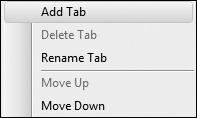
You can create your own Toolbox tabs to store practically whatever you want in them. For that upcoming presentation, you can create your own tab by choosing the Add tab on the Toolbox context menu and adding content by using either the mouse or keyboard to populate content into your new tab. (Yes, the keyboard works too for cutting and pasting code from the editor into the Toolbox.)
You can drag and drop Toolbox tabs to new locations in the list, and their location will persist.
The Task List is similar to the Bookmarks window, where you can leave notes about particular sections of code. However, the Task List generates its content from scanning the source code files. For example, suppose you have left TODO comments in the code for others on your team to look at or as reminders the next time you check out that file. These TODO comments will appear in the Task List. Note that the user tasks and shortcuts created in the Task List are not inserted into the code, so these will remain for your eyes only.
A user task is saved in the .suo file per user, unlike a TODO, HACK, or UNDONE comment that you type into your source code. A .suo file stores all of a user’s solution customizations, which you wouldn’t want checked into source control.
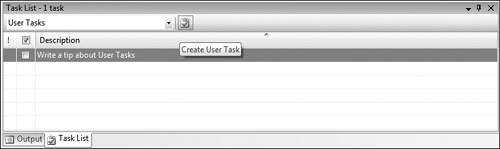
To create a user task, open View–Task List, make sure User Tasks is displayed in the combo box drop-down list, and then click the Create User Task button on the toolbar. Note that you can create the first task by directly editing the first row in the task list, but after that you need to press the button.
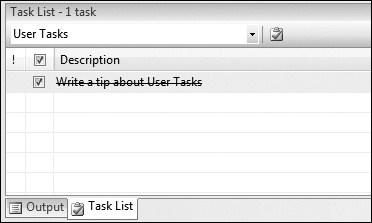
Then, as you finish your task, you can check the check box next to it to scratch it off.
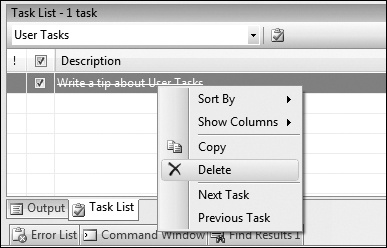
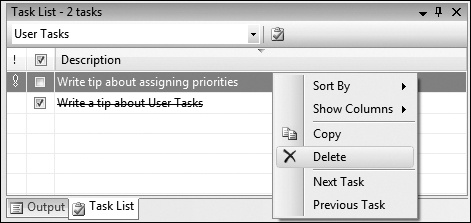
And to delete a task, simply right-click it and choose Delete.
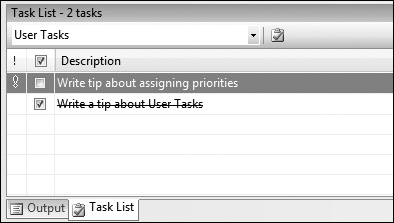
Now that you’ve created a user task, you can assign a priority. I call this out as a separate tip, as it is most likely not intuitive that you can do this.
Under the ! (exclamation point) column, you can click any cell to pop open the priority combo box.
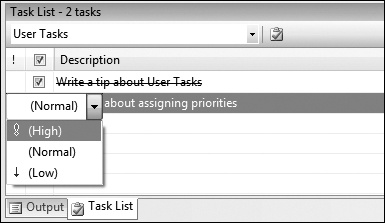
Then you’ll be able to view and sort your user tasks based on priority.
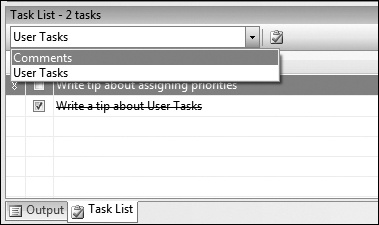
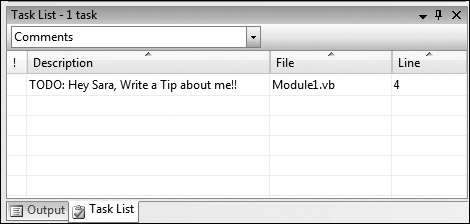
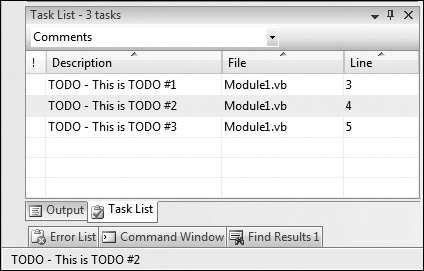
Let’s focus now on the other aspect of the Task List: the comments left in the code. You need to drop down the combo box at the top right to show Comments to be able to see your comment tokens (for example, UNDONE, TODO, and HACKS) in the Task List.
So let’s say that you have a TODO comment in your code as shown here.
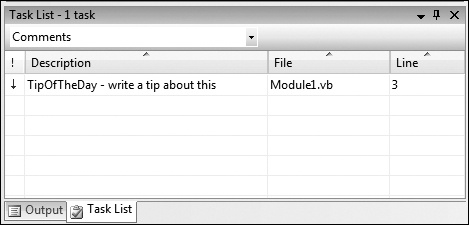
By going to the Comments view in the Task List, you can now see your TODO comment.
You can store shortcuts in your Task List, and you can even use them as tasks to scratch off, if you want. And just like user tasks, shortcuts are saved in your solution .suo file, so they won’t get checked into the source control.
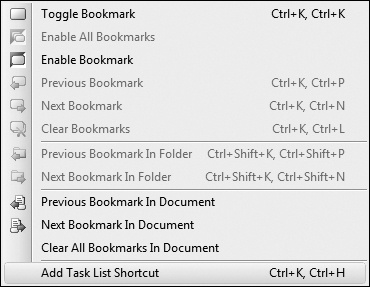
To create a Task List shortcut, go to the desired location in your editor (which can be any line of code or comment) and then go to Edit–Bookmarks–Add Task List Shortcut.
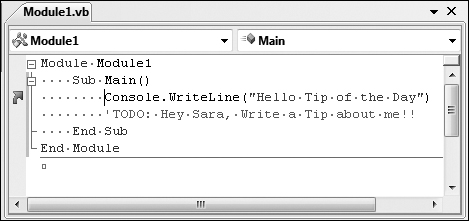
Now you’ll notice the shortcuts curved-arrow glyph appears in the indicator margin.
And now in the Task List, you’ll see a new category called Shortcuts.
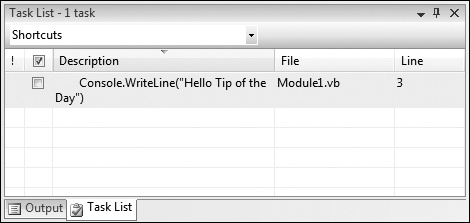
As illustrated in the preceding screen shot, you can also rename these shortcuts by double-clicking the description (or tabbing to the description field, for keyboard users) and then typing a new name.
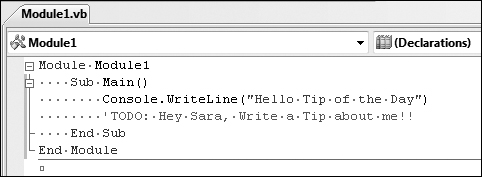
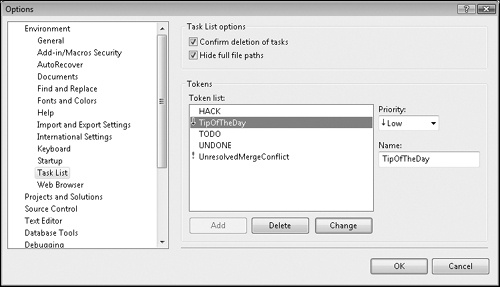
TODO comments are not the only thing you can display under Comments in the Task List. If you go to Tools–Options–Environment–Task List, you’ll see a Token List. By default, the Token List comes with HACK, UNDONE, and TODO, but you can create your own.
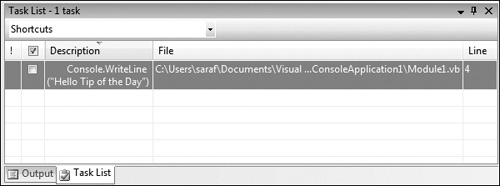
Using a user-created TipOfTheDay token, I can type a comment in my code using the ‘TipOfTheDay token format, as shown here:
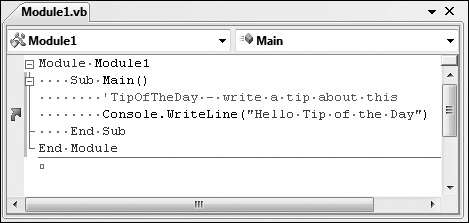
The TipOfTheDay comment now appears in the Task List.
If you’ve created a few tasks and deleted them over time, you may have found that delete confirmation prompt to be annoying. Here’s how you can disable it.
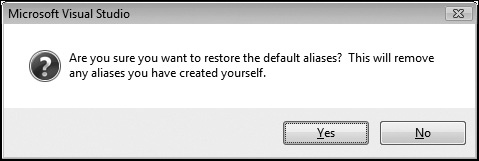
On each user task, you’ll see the Delete command on the context menu, as shown in the following screen shot.
And when you click it, you’ll get this prompt:
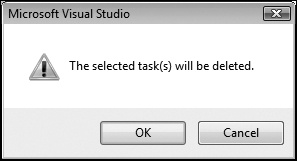
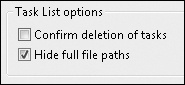
To disable this prompt, go to Tools–Options–Environment–Task List, and uncheck the Confirm Deletion Of Tasks check box.
This tip applies only to comments and shortcuts, as user tasks are not saved with a file.
Go to Tools–Options–Environment–Task List, and uncheck the Hide Full File Paths check box.
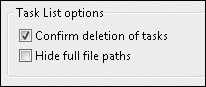
And now the Task List displays the full paths for shortcuts.
F8 and Shift+F8 are bound to the commands Edit.GoToNextLocation and Edit. GoToPreviousLocation. When the Task List is visible, these keyboard shortcuts navigate throughout all the tasks listed in a given category.
However, if you want to navigate at any time among your various TODO comments or other tasks, regardless of whether the Task List is open, the Task List comes with two commands for doing this: View.NextTask and View.PreviousTask.
Because we’ve already explored more than you ever wanted to know about the Task List, you now know that the Task List has several categories: User Tasks, Comments, and Shortcuts. These commands navigate only among items of a given category, so you won’t jump from Shortcuts to User Tasks.
Note that these commands are not bound to a keyboard shortcut by default in the General Development Settings, so you may need to bind them yourself, depending on your development settings.
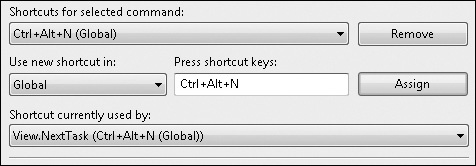
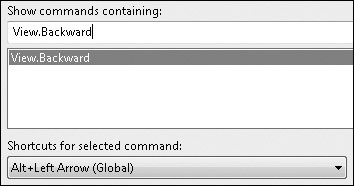
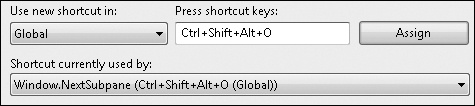
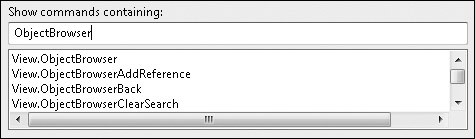
Go to Tools–Options–Environment–Keyboard, and in the Show Commands Containing edit box, type the command View.NextTask.
Do a sanity check for whether the settings you are using already have the command bound to a keyboard shortcut. If a command is already bound to a keyboard shortcut, you’ll see it in the Shortcut Currently Used By read-only combo box, which you can see in the preceding screen shot.
If the command is not bound to a shortcut, in the Press Shortcut Keys edit box, type your preferred shortcut and click Assign. If you want this command to work only in the editor and not anywhere else in the IDE, use the Text Editor scope under the Use New Shortcut In drop-down list.
Rinse and repeat for the View.PreviousTask command. For me, I used Ctrl+Alt+N, only because it wasn’t bound to anything in the General Development Settings. For the previous action, I highly recommend just adding the Shift key to whatever key combination you come up with for View.NextTask, since the standard convention for any backward navigation is to include Shift.
Also, something else to note, because we had to test for it, is that the Visual Studio status bar will update with the name of the comment when you use View.NextTask or View.PreviousTask.
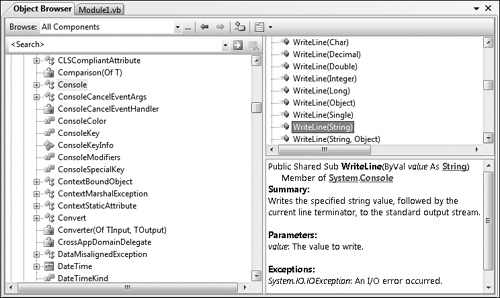
The Object Browser is your bird’s-eye view on every possible object or method the IDE knows about, whether it lives in your project or in the Microsoft .NET Framework.
You can use Ctrl+Alt+J to open the Object Browser window. The command is View.ObjectBrowser.
By default, the Object Browser shows you all the components in the latest .NET Framework version. But sometimes you don’t need to know about the entire world, and you just want to focus on the objects in your solution.
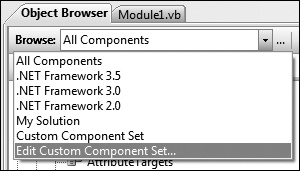
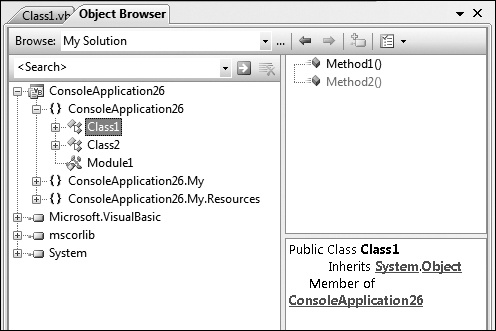
In the upper-right corner of the Object Browser, you’ll see a Browse combo box. If you drop down the combo box list, you’ll see the option for selecting My Solution.
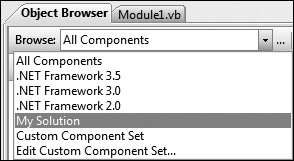
Now you’ll see only the objects being used within your solution.
You can create a custom components list for the Object Browser.
There are two ways to reach the Edit Custom Component Set dialog box. Either click that little "..." browse button next to the combo box or click the Edit Custom Component Set option in the Browse combo box.
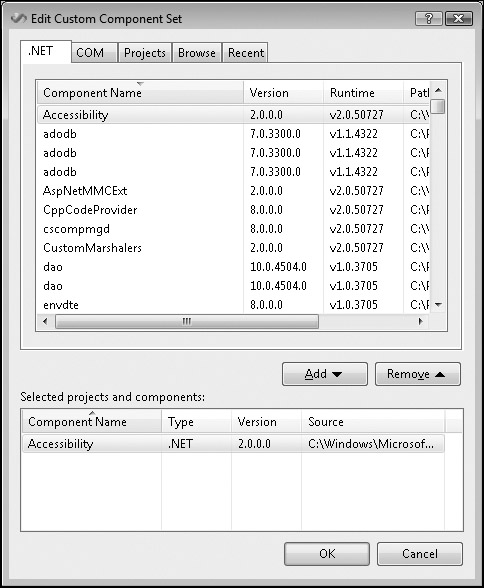
Now you’ll see the Edit Custom Component Set window, where you can add and remove components. And for old time’s sake, I’ve added an Accessibility assembly.
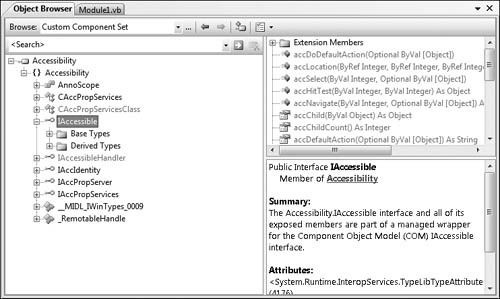
Finally, when returning to the Object Browser, you get the following view.
Let’s say that you find the component that you want to add to your solution. Typically, you go to Solution Explorer, right-click the project node and select Add References, bring up the Add Reference dialog box, and you know how the rest goes.
Within the Object Browser, there’s a toolbar button called Add To References located to the right of the "..." browse button and the forward/back navigation buttons.
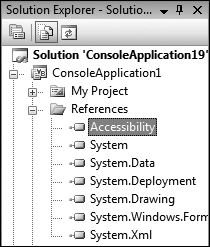
With the Accessibility assembly selected, click the Add To References In Selected Project In Solution Explorer icon to add the assembly.
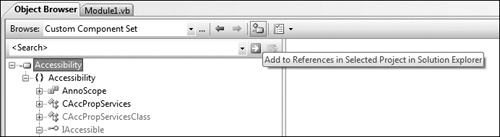
And now you’ll see the Accessibility assembly added to the project.
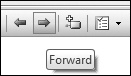
Another set of buttons on the Object Browser toolbar belongs to the Navigate Forward and Navigate Back actions.
The pages you visit within the Object Browser are saved in MRU (most-recently used) order.
This alone is somewhat exciting, but what really makes it exciting is a keyboard shortcut!
The commands are View.ObjectBrowserForward and View.ObjectBrowserBack. If you are using the Visual Basic Development Settings, you’ll see that the keyboard shortcuts are Alt+Minus for Back and Shift+Alt+Minus for Forward. If you use the Forward and Back functionality frequently and are not using the Visual Basic Settings, go to Tools–Options–Environment–Keyboard, and manually set the keyboard shortcuts there.
As far as binding View.ObjectBrowserAddReference to a keyboard shortcut goes, I’ll leave it up to you to decide how useful this is. Maybe the "keyboard shortcut for everything" users will enjoy it.
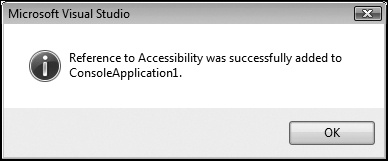
As long as some object has selection—meaning it doesn’t have to have focus (blue highlight) and has at least inactive selection (light gray highlight)—in the Objects pane (the leftmost pane), you’ll get the following message box when you press the keyboard shortcut.
And if there’s nothing selected (meaning you probably have absolutely nothing in the Object Browser) and you press the keyboard shortcut, Visual Studio will just stare at you.
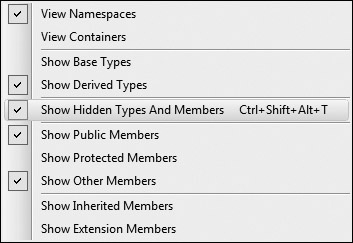
Over the next several tips, we’re going to take apart the Object Browser Settings menu that lists what appears in the Object Browser.
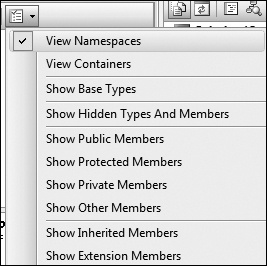
The first set of options control your view preference in the Object pane, which is either by namespace or by containers. Think of these two options as a set of radio buttons that are mutually exclusive. The rest of the options are more like check boxes, since you can have all the show options enabled.
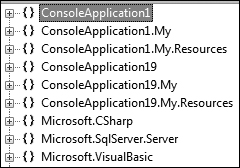
If you choose View Namespaces (which is the default), all components are shown based on their namespace, just as you would expect. The idea here is that namespaces stored in multiple physical containers are merged, as shown here:
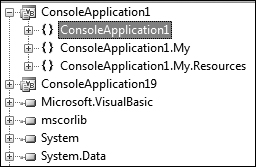
Now if you switch to View Containers, you’ll see the physical containers, and then a breakdown of the namespaces that are contained in each.
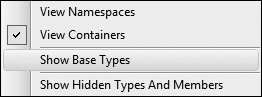
In the Object Browser Settings menu, there’s the Show Base Types option.
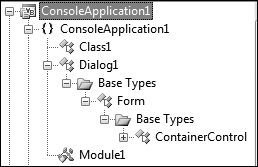
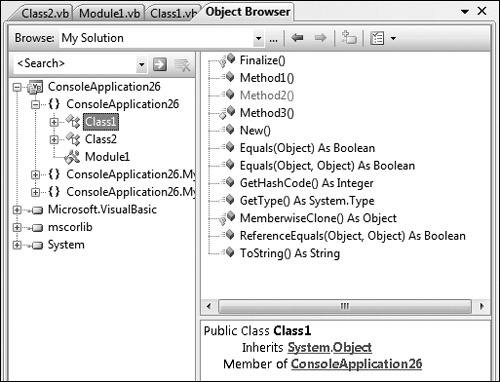
In the following example, Class1 inherits from ClassBase. When this option is enabled, under Class1 you’ll see the Base Types folder. If you’ve been wondering how to get rid of this (or have been wondering how to enable it), just toggle the setting.
This tip is about the Show Hidden Types And Members option on the Object Browser Settings menu.
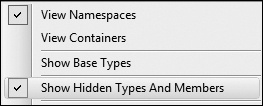
When this option is enabled, any hidden types and members will appear, but they’ll appear in a grayed-out state, as shown next in the Method1() and Method2() example, where Method2() is hidden.
Continuing from Tip 5.40: You can hide or show hidden members and types in the Object Browser, this tip is how to actually make something hidden or capable of being hidden.
In the System.ComponentModel namespace, there’s the EditorBrowseableAttribute class.
Going back to the previous tip’s Method1() and Method2() methods, you’ll see in the following example how Method2() doesn’t appear in IntelliSense, just like it doesn’t appear in the Object Browser.
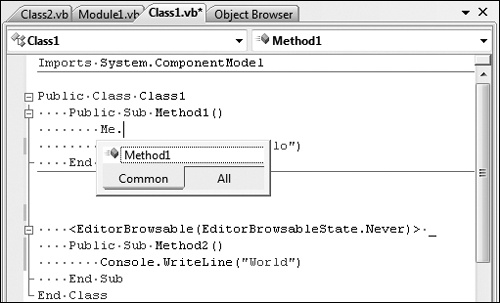
Of course, you can still complete the line just shown with Method2(), and everything will compile successfully.
The Other in the Show Other Members option represents members that do not have an access level of public, private, protected, or inherited. For example, access levels of Friend (in Visual Basic) and Internal (C#) fit into this Other category.
The Object Browser shows the Friend method with a blue diamond.
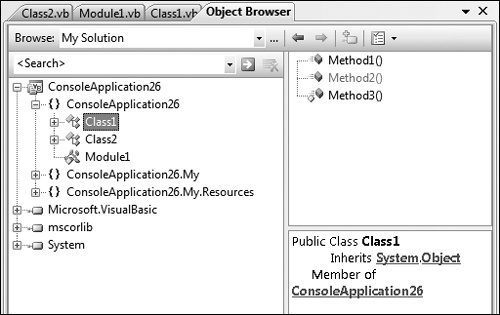
The next option in Object Browser Settings is Show Inherited Members.
When this option is enabled, you’ll see all inherited members, including those inherited from System.Object.
When this option is disabled, you’ll see only Method1(), Method2(), and Method3().
This tip is new for Visual Studio 2008. You can learn more about extension methods in the documentation located at http://msdn.microsoft.com/en-us/library/bb384936.aspx for Visual Basic and http://msdn.microsoft.com/en-us/library/bb383977.aspx for C#.
In Object Browser Settings, you’ll see the Show Extension Methods option.
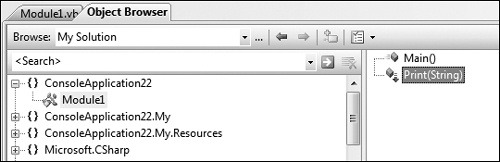
Now, when you have an extension method in your code (in my example, it’s a module because I’m using Visual Basic), you’ll see a downward-pointing arrow.
Now we’ll move to the second toolbar in the Object Browser, which is all about searching.
The search scope depends on what you have selected in the Object Browser Scope. For example, if you try to search for System.Web in a Console Application, you will not be very successful.
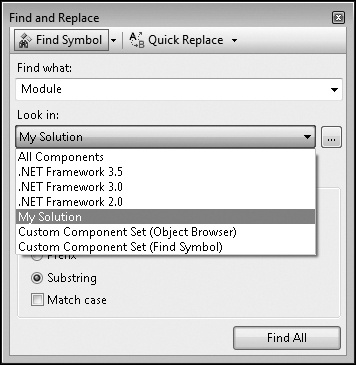
There’s also another way to search—it’s using the Find And Replace window’s Find Symbol functionality. You’ll notice the Find Symbol search closely resembles the Object Browser search functionality.
On the context menu of both the Member pane (right panel) and the Object pane (left panel), you’ll see the Go To Definition command. You can use this command to navigate directly into the code where whatever you have selected is defined (or you’ll get a nice error message).
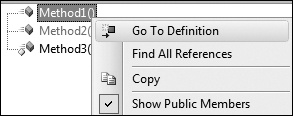
The Edit.GoToDefinition command is bound to F12. Pressing F12 in the image just shown takes you to where Method1() is defined in the code.
Just like the previous tip that talked about going to an object’s or function’s definition, you can find all the references of what you have selected in the Object Browser.
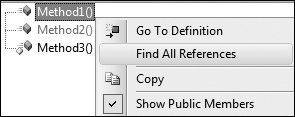
The command Edit.FindAllReferences is bound to Shift+F12. When you press Shift+F12, it brings up the Find All References window.
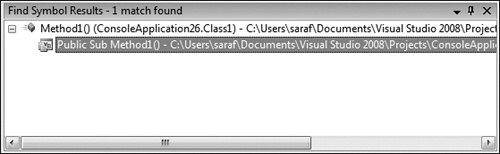
This is the same as using Find Symbol in the Find In Files window.
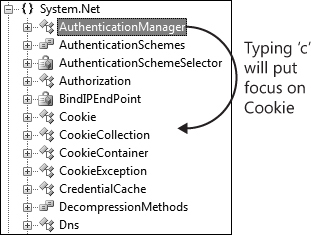
You may have tried this tip on your own, just hoping it would work. But in case you never thought about it, the Object Browser supports type-ahead selection.
Over these past several tips, we’ve taken a close look at customizing your Object Browser experience, from sorting to searching to filtering, among other options.
Your customizations can be saved to a .vssettings file via the Tools–Import And Export Settings dialog page, under General Settings–Object Browser Options.
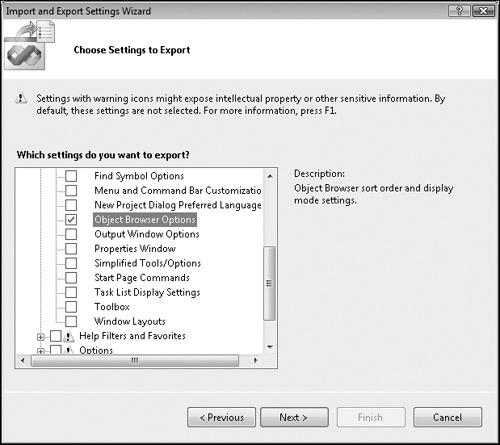
The good news is that the XML stored in the created .vssettings file for the Object Browser Settings is human readable, in case you need to make a quick tweak.
Technically, not all these commands need keyboard shortcuts. For example, the ability to sort objects by access level probably doesn’t need a keyboard shortcut. But since they do have shortcuts, let’s have some fun....
If you bind any of the Object Browser Settings options to a keyboard shortcut, you’ll see that shortcut in the drop-down menu. I didn’t know that until I started playing with this feature.
How can you take advantage of this? If you use the Object Browser a lot to search, you might find it meaningful to clear the search via the keyboard shortcut. The command View. ObjectBrowserClearSearch clears the search combo, thus clearing the Object Browser filter.
In Tip 5.36: How to use navigate forward and back in the Object Browser, I discussed how you can navigate forward and backward with the Alt+Minus and Shift+Alt+Minus keyboard shortcuts, which are scoped specifically to the Object Browser. But there are two other commands, View.Forward and View.Backward, that also work in the Object Browser, just like Alt+Minus and Shift+Alt+Minus.
View.Forward and View.Backward are global, meaning that other features within the IDE can use them. For example, Class View uses them in the same way as the Object Browser. But you’re probably most familiar with these commands as Web Browser Forward and Web Browser Backward.
If you are accustomed to using these commands elsewhere in the IDE, you’ll feel right at home in the Object Browser.