
Chapter 6
Threat Detection
Up to now, you’ve learned how to reduce the attack surface by addressing security recommendations using Microsoft Defender for Cloud, which is part of the overall enhancement of your security posture. However, protection is just one of the pillars of your security posture. You also need to enhance your detection and response, and for that, you need to use different plans available in Defender for Cloud.
On the detection front, Defender for Cloud constantly monitors your assets. When it identifies suspicious activities, it raises an alert, and it does that while reducing the false positives, which is very important for your security operations.
In this chapter, you will learn how to use the different Defender for Cloud plans provide threat detection for different workloads and how to investigate security issues as part of your incident response process.
Methods of threat protection
Defender for Cloud uses advanced security analytics and machine-learning technologies to evaluate events across the entire cloud fabric. The security analytics include data from multiple sources, including Microsoft products and services, the Microsoft Digital Crimes Unit (DCU), the Microsoft Security Response Center (MSRC), and external feeds. This is the core of Defender for Cloud threat detection, and on top of that, there will be different mechanisms of detection according to the plan. For this section, we will explore how Defender for Servers detection works.
Defender for Servers applies known patterns to discover malicious behavior, which is called behavioral analysis. It uses statistical profiling to build a historical baseline. An alert can be triggered when Defender for Server detects deviations from established baselines that conform to a potential attack vector. The result will be externalized in the dashboard via a security alert. A security alert contains valuable information about what triggered the alert, the resources targeted, the source of the attack, and suggestions to remediate the threat. Alerts generated by Defender for Server are also called Virtual Machine Behavioral Analysis (VMBA). These types of alerts use behavioral analytics to identify compromised resources based on an analysis of the virtual machine (VM) event logs, such as process-creation events, in memory only (fileless attack), and login events. While these examples were related to Defender for Server, other Defender for Cloud plans use different methods to identify suspicious activity and trigger an alert.
Defender for Servers also identifies suspicious activity in the network layer by collecting security information from your Azure Internet Protocol Flow Information Export (IPFIX) traffic and analyzes it to identify threats and trigger alerts, such as the Suspicious Incoming RDP Network Activity From Multiple Sources alert.
Understanding alerts
Before a Defender for Cloud plan triggers an alert, it needs to have a level of certainty that this alert is a true-positive. The intent is to reduce false-positive alerts and provide a high- quality alert level. To accomplish that, the following actions are done during the alert normalization, as shown in Figure 6-1.
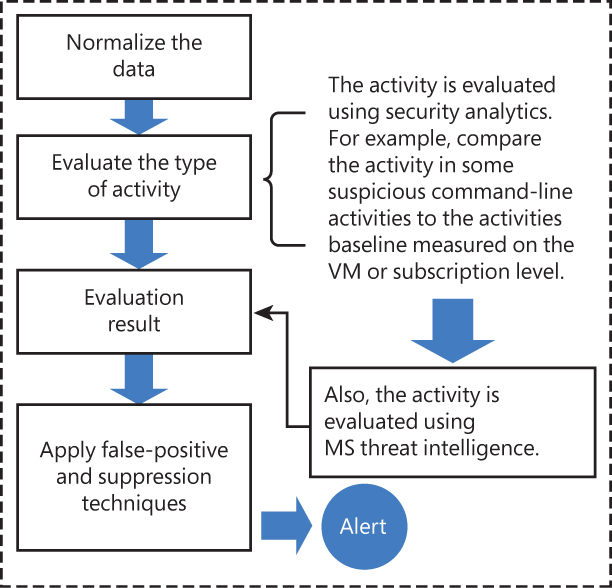
FIGURE 6-1 Activity evaluation before triggering an alert
When an alert is finally triggered, you will be able to answer five main questions that are important for your investigation. The questions are shown in the Security Alert blade, as shown in Figure 6-2.
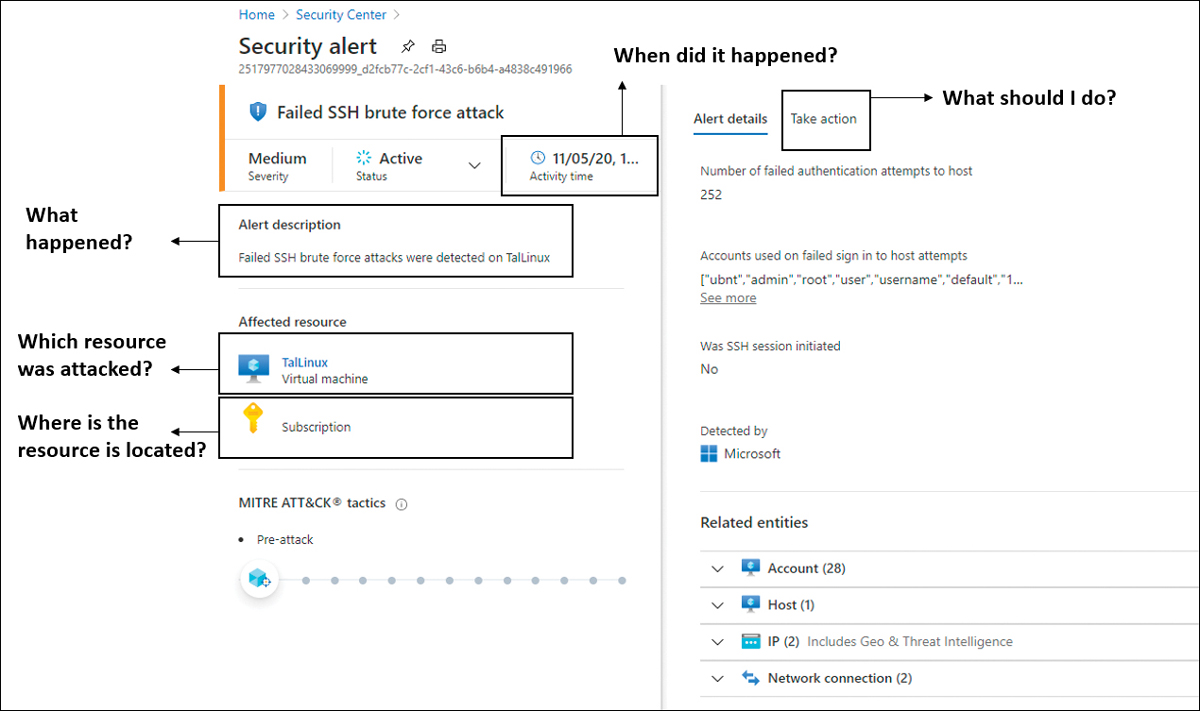
FIGURE 6-2 The Security Alert blade shows the answers to the major investigation’s questions.
It is important to emphasize that not all alerts will have the same level of information because it depends on the threat type and the analytics for that threat. Alerts will also differ in the time it takes for them to be triggered. Defender for Servers has three major detection engines that will dictate how long it takes for an alert to be triggered:
The event-based detection engine will trigger near-real-time alerts.
The query-based detection engine works on different events from different sources before triggering an alert, which, by nature, will take more time.
The batch-process detection engine runs massively parallel analytics on large-scale datasets, which can take even longer.
Accessing security alerts
The number of security alerts you see in the Security Alerts dashboard may vary depending on the number of resources that you are monitoring with Defender for Cloud and the business itself. Some organizations receive more attacks than others, and as a result, they have more security alerts. If you don’t have any security alerts in your environment, you can simulate an alert using this procedure:
Open Azure portal and sign in with a user who has Security Admin privileges.
In the left navigation pane, click Microsoft Defender For Cloud.
In the Defender for Cloud left navigation pane under General, click the Security Alerts option.
In the top-right corner, click the Sample Alerts option; the Create Sample Alerts (Preview) blade appears, as shown in Figure 6-3.
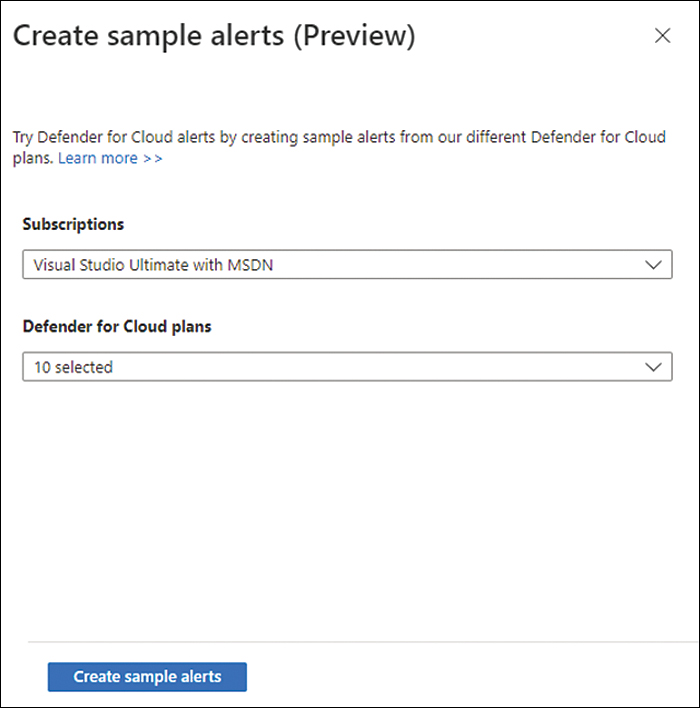
FIGURE 6-3 Creating a sample alert
In the Subscriptions dropdown menu, select the subscription on which you want to generate the sample alert.
Click the Defender For Cloud Plans dropdown menu and select only Virtual Machines.
Click the Create Sample Alerts button to generate the sample alerts.
After a few minutes, you will see that five sample alerts appear in the dashboard, as shown in Figure 6-4.
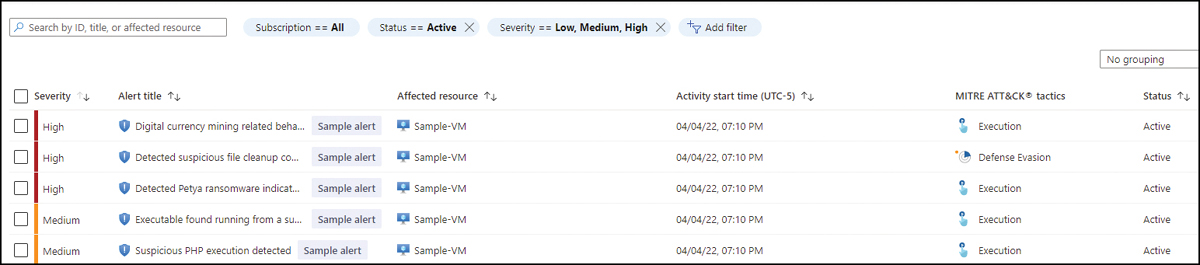
FIGURE 6-4 Security alert dashboard with the sample alerts for VMs
By default, the Security Alerts dashboard presents the alerts indexed by Severity, but you can use the filtering options to change the severities you want to see. You can also filter by
Subscription If you have multiple subscriptions selected, you can customize which subscriptions you want to see alerts from.
Status By default, only Active is selected. However, you can change it so you see dismissed alerts.
Time Allows you to configure the timeline of the alerts you can see for up to the previous three months.
Add Filter Allows you to add more filters.
In addition to the filters, you can also use the search box to search for Alert ID, Alert Title, or Affected Resource. Once you find the desired alert, you can click it, and the Alert Details page appears, as shown in Figure 6-5.
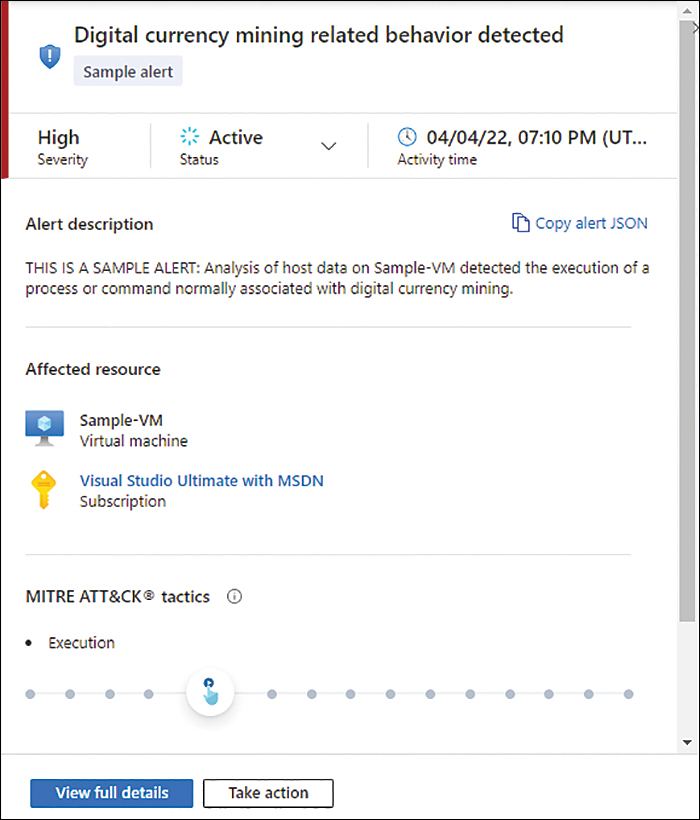
FIGURE 6-5 Alert details page
This page allows you to review the alert’s details and change the status from Active to Dismissed. You also have a graphical representation of where the alerts fit into the MITRE ATT&CK Tactics framework.
Note
You can learn more about this framework at https://attack.mitre.org.
After reviewing the alert’s details, you can obtain more granular information by accessing the alert’s full details page. To do that, click the View Full Details button; the full Alert Details page appears, as shown in Figure 6-6.
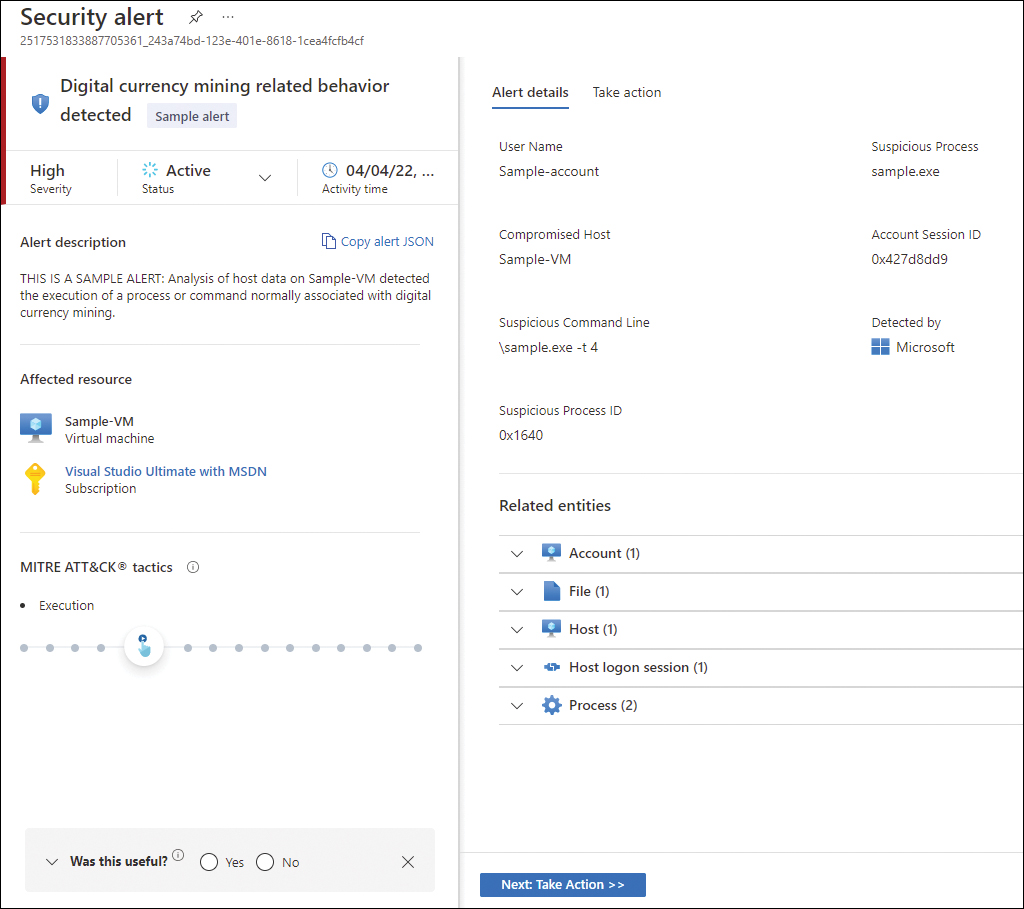
FIGURE 6-6 Full alert page
The right portion of the full alert page shows more details that are relevant for the alert. In the bottom part of the page are the Related Entities, which enumerate the relevant entities (Accounts, Files, Host, Host Logon Session, and Process) that were used during this attack. Keep in mind that the related entities will vary according to the alert type and whether those entities were used. Although the example shown in Figure 6-6 is from a sample alert, the fields shown are the same ones that you would see in a real live alert.
Another important option on this page is the Take Action tab, which contains relevant information to mitigate the threat highlighted in this alert (Mitigate The Threat), the recommendations that could be remediated to prevent future attacks (Prevent Future Attacks), the option to trigger a Logic App automation (Trigger Automated Response), and the option to create a suppression rule (Suppress Similar Alerts). Figure 6-7 shows the Take Action tab.
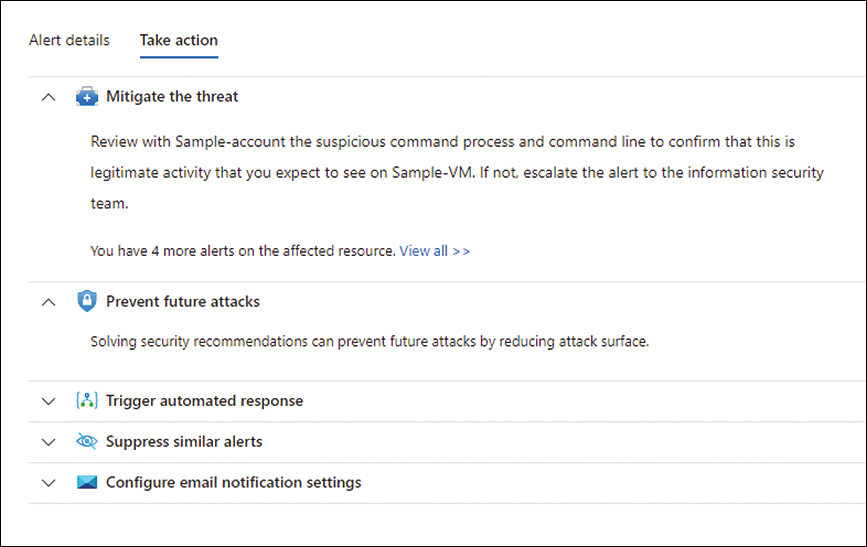
FIGURE 6-7 Take Action tab with the available options for an alert
Alert suppression
There are some scenarios in which you might want to dismiss an alert because it is a false-positive for your environment. A typical scenario is when an organization is going through a pentest (penetration testing) exercise conducted by their red team, and the organization wants to suppress some of the triggered alerts to avoid noise and alert pollution. You can leverage the alert suppression feature for that scenario.
Before configuring alert suppression, you should identify the exact alert you want to suppress and how long the suppression rule should be active. Establishing an expiration date for the rule is important because you don’t want to be blind to this alert forever. Usually, those suppression scenarios happen for a reason, and for the most part, they are caused by a temporary circumstance. Follow the steps below to configure an alert suppression rule:
Open Azure portal and sign in with a user who has Security Admin privileges.
In the left navigation pane, click Defender For Cloud.
In the Defender for Cloud left navigation pane under General, click the Security Alerts option.
In the Security Alerts dashboard, click the Suppression Rules option; the Suppression Rules page appears, as shown in Figure 6-8.
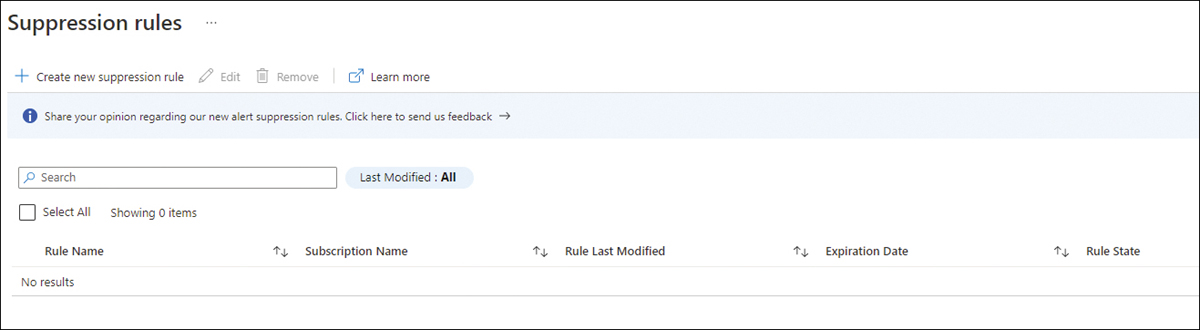
FIGURE 6-8 Suppression Rules page
Click the Create New Suppression Rule option; the New Suppression Rule blade appears, as shown in Figure 6-9.
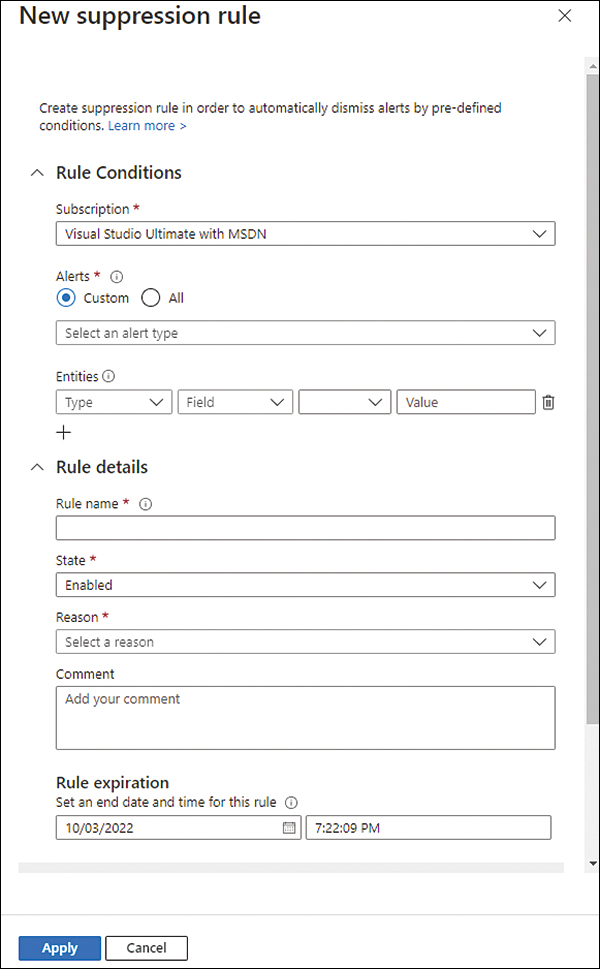
FIGURE 6-9 Creating a new suppression rule
In the Rule Conditions section, click the Subscription dropdown menu option and select the subscription on which you want to apply this rule.
Under Alerts, select Custom, and in the dropdown menu, select the alert you want to suppress. For this example, select the Suspicious PHP Execution Detected sample alert.
For the Entities option, you can make the suppression more granular by specifying the specific fields from the alert that should match the suppressed rule. Then, you can click the plus sign button (+) to add multiple entities. Just keep in mind that when you do that, the suppression rule will only apply if both conditions are true. In other words, there is an
ANDbetween each entity field. For this example, leave this selection as is.In the Rule Details section, under the Rule Name, type a name for this rule. The name cannot have space. For this example, type PHPSuppression.
Leave the State setting to its default option, Enabled.
Select the most appropriate option from the Reason dropdown menu. For this example, select Other, and in the Comment field, type Suppression for red team exercise.
Configure Rule Expiration for two months from the day you are configuring.
To validate the rule, click the Simulate button, and you will see the result right under the Test Your Rule option.
Click the Apply button to commit the change and create the rule.
The next time this alert is triggered, it will be automatically suppressed. It is important to mention that suppressed alerts are still available for you to see. You just need to change the filter in the Security Alerts dashboard to see the dismissed alerts. If you are using the Continuous Export feature to export all alerts to the Log Analytics workspace, the suppressed alerts will also be available in the workspace; you just need to run a query for dismissed alerts.
Alerts in Azure Resource Graph (ARG)
Starting in the last quarter of 2020, alerts also became available in the Azure Resource Graph (ARG). You can access ARG directly from the Security Alerts dashboard by using the Open Query option, which will open Azure Resource Graph Explorer with a query that represents the visualization you had configured in the Security Alerts dashboard, as shown in Figure 6-10.
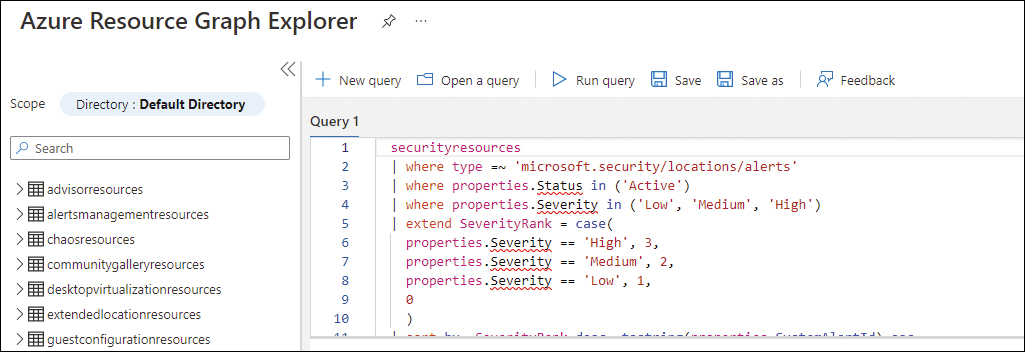
FIGURE 6-10 Azure Resource Graph Explorer
You can either click the Run Query option to see the results based on the current query, or you can customize the query, which uses the Kusto Query Language (KQL) format.
Defender for Servers
Defender for Servers is the first Defender for Cloud plan available in the price settings for the subscription. In 2022, this plan was split into two tiers called Plan 1 (P1) and Plan 2 (P2):
P1 P1 was created for scenarios where you only need to deploy Microsoft Defender for Endpoint (MDE) using the native integration of Microsoft Defender for Cloud. In this plan MDE licenses are charged per hour instead of per seat, lowering costs for protected VMs only when they are in use. MDE leverages the Defender for Cloud auto-provisioning capability to automatically deploy to all cloud workloads. Lastly, this plan also offers alerts and vulnerability data from MDE to appear in the Defender for Cloud dashboard.
P2 P2 does everything that P1 does, but it adds all other Defender for Servers capabilities, such as:
Threat detections for the operating system, network layer, and control plane
File integrity monitoring
Just-in-time VM access
Integrated Vulnerability Assessment
Adaptive application control
Adaptive network hardening
Network map
Regulatory compliance dashboard
500MB allowance in the Log Analytics workspace for specific data types
When enabling Defender for Server for the first time, you can select whether you want P1 or P2. Also, if you are in an environment that used Defender for Servers before this April 2022 change, the selection will automatically be P2. Follow the steps below to see which plan you are currently using:
Open the Azure portal and sign in with a user who has Security Admin privileges.
In the left navigation pane, click Defender For Cloud.
In the Defender for Cloud left navigation pane under Management, click the Environment Settings option.
Click the subscription for which you want to view the pricing settings.
On the Defender Plans page, under the Server Pricing, click the Change Plan option, and you will see the Plan Selection blade, as shown in Figure 6-11. Here, you can select Microsoft Defender For Servers P1 or Microsoft Defender For Servers P2.
Once you finish reviewing, you can click the Confirm button.
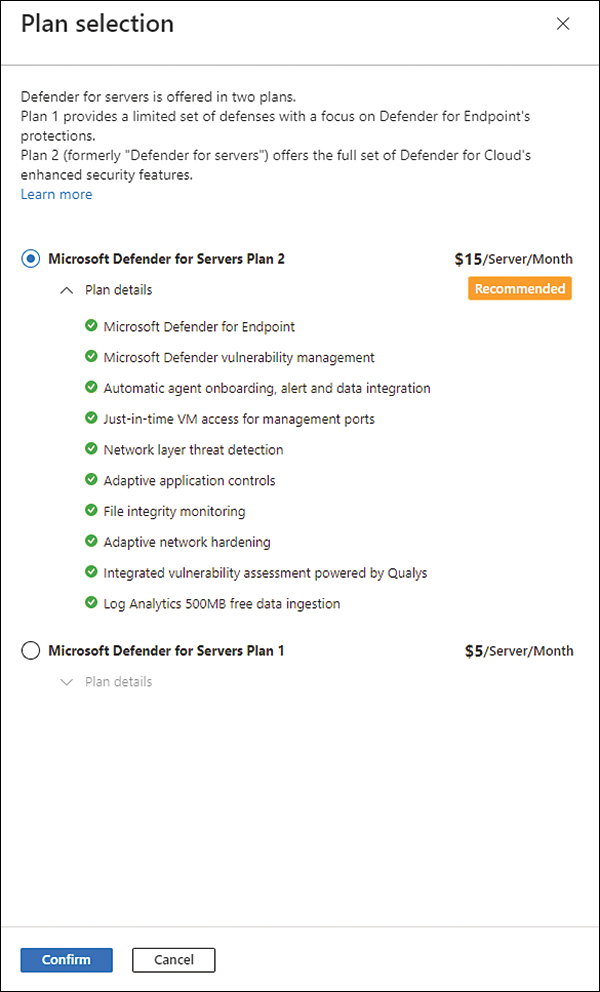
FIGURE 6-11 Defender for Servers pricing plan selection
Figure 6-11 shows the features available on Defender for Servers Plan 2, and while some of these features have already been covered in this book, others are covered in later chapters. The focus of this chapter is to cover the threat detection capabilities for each plan. Defender for Server has different threat detections for Windows and Linux, as shown in the following sections. You will learn more about the integration with MDE in Chapter 7, “Better together.”
Windows
Defender for Servers detection in Windows looks at many events, and once it finds something suspicious, it will trigger an alert. For example, if you execute the command below in a VM monitored by Defender for Servers, it will be considered a suspicious activity:
powershell -nop -exec bypass -EncodedCommand "cABvAHcAZQByAHMAaABlAGwAbAAgAC0AY
wBvAG0AbQBhAG4AZAAgACIAJgAgAHsAIABpAHcAcgAgAGgAdAB0AHAAcwA6AC8ALwBkAG8AdwBuAGwAb
wBhAGQALgBzAHkAcwBpAG4AdABlAHIAbgBhAGwAcwAuAGMAbwBtAC8AZgBpAGwAZQBzAC8AUwB5AHMAbQ
BvAG4ALgB6AGkAcAAgAC0ATwB1AHQARgBpAGwAZQAgAGMAOgBcAHQAZQBtAHAAXABzAHYAYwBoAG8AcwB0AC4
AZQB4AGUAIAB9ACIA"
PowerShell is a very powerful tool, and you can see on the MITRE ATT&CK’s techniques (https://attack.mitre.org/techniques/T1086/) page that PowerShell has been used in many attack campaigns. When Defender for Servers detects the PowerShell execution with the encoded command, it raises an alert for what the user is trying to hide. In this case, the command below is trying to download the sysmon.zip file from the SysInternals website and save it to the C: emp folder with the svhost.exe name:
powershell -command "& { iwr https://download.sysinternals.com/files/Sysmon.zip -OutFile
c:	empsvchost.exe }"
Using PowerShell encoding to download malware from a command-and-control is a common malicious pattern, so Defender for Servers will raise an alert.
Tip
You can test Windows Detections in Defender for Servers using the Playbook available at https://github.com/Azure/Microsoft-Defender-for-Cloud/tree/main/Simulations.
Linux
When Linux detections were first released, there was a dependency in AuditD to be installed in the Linux operating system. AuditD is a service that runs in Linux systems to collect and write logs for auditing purposes. While AuditD provides a lot of information that can be used to detect threats, not all Linux distros will have AuditD installed by default. For this reason, the latest change in behavior for Linux detections was to bake the necessary elements that will collect relevant data in the agent (the Log Analytics Agent) itself.
Tip
You can test Linux Detections in Defender for Servers using the Playbook available at https://github.com/Azure/Microsoft-Defender-for-Cloud/tree/main/Simulations.
Defender for Containers
Defender for Containers provides hardening assessment for Kubernetes clusters running on Azure Kubernetes Services (AKS), Kubernetes on-premises, IaaS, Amazon Elastic Kubernetes Service (EKS) and Google Kubernetes Engine (GKE). Also, it provides Vulnerability Assessment (VA) for images stored in Azure Container Registries (ACR) and running in Azure Kubernetes Service (AKS).
While these features are considered part of your security hygiene, Defender for Containers also has threat detection for nodes and clusters. The architecture shown in Figure 6-12 represents these capabilities.
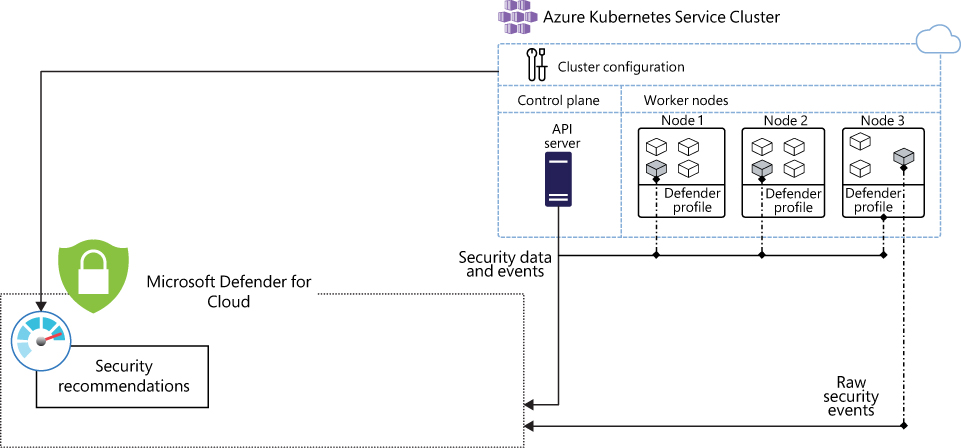
FIGURE 6-12 Defender for Containers
As you can see in Figure 6-12, two major components communicate with Defender for Cloud via the Defender for Containers plan:
Defender profile This profile is deployed to each node; it provides runtime protections, collects signals, and includes the
DaemonSet. For more information onDaemonSet, see https://kubernetes.io/docs/concepts/workloads/controllers/daemonset.Azure Policy add-on for Kubernetes This component is responsible for collecting cluster and workload configuration for admission control policies. It is deployed in one node of the cluster and also includes Gatekeeper. For more information about Gatekeeper, visit https://github.com/open-policy-agent/gatekeeper.
Tip
To enable this plan, you need to enable containers by going to the pricing page. (Use the same steps discussed earlier in this chapter in the “Defender for Servers” section.)
We recommend using the auto-provisioning capability when onboarding containers because auto-provisioning will automatically deploy Azure Arc. For example, when you are configuring a multi-cloud connector, if you configure the default auto-provisioning option to Off during the GCP connector onboarding process or afterwards, you will need to manually install Azure Arc-enabled Kubernetes, the Defender extension, and the Azure Policy extensions to each of your GKE clusters to get the full security value out of Defender for Containers.
Vulnerability Assessment
The Vulnerability Assessment (VA) performed by Defender for Containers appears in the Microsoft Defender for Cloud dashboard as a security recommendation, as shown in Figure 6-13.
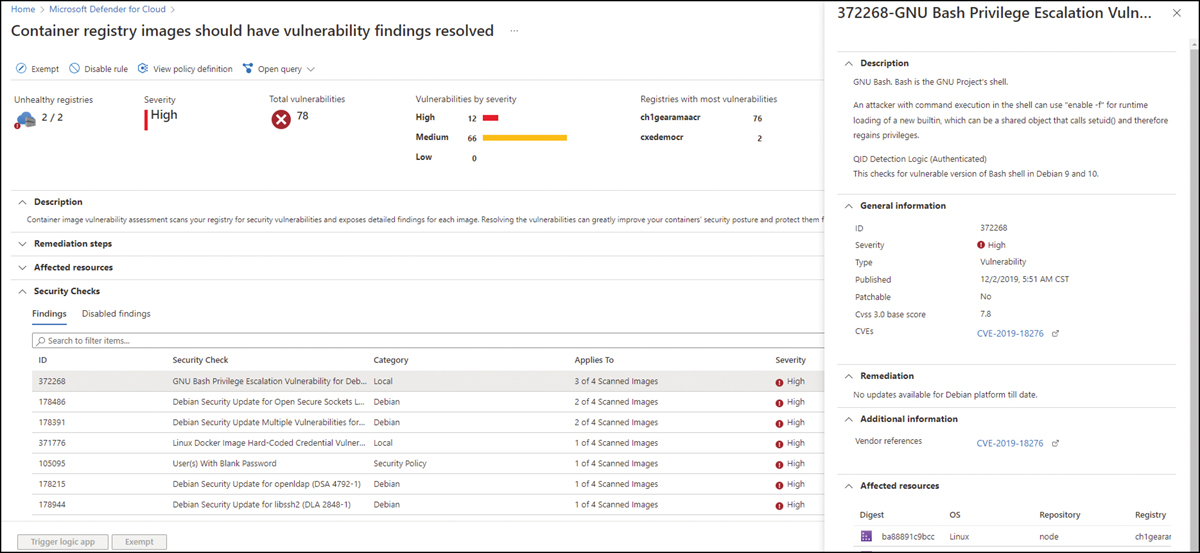
FIGURE 6-13 Vulnerability Assessment for Containers
When you open this recommendation, you will see the list of checks that ran; when you click each security check, you will see more information about the vulnerability, including remediation steps (if available), relevant Common Vulnerabilities and Exposures (CVEs), Common Vulnerability Scoring System (CVSS) scores, and more. Also, you can view the identified vulnerabilities for one or more subscriptions or a specific registry.
Threat detection
As shown previously in Figure 6-12, Defender for Containers uses threat detection on the cluster level and on the underlying cluster nodes by monitoring the control plane (API server) and the containerized workload itself. Figure 6-14 shows an example of an alert based on Kubernetes audit log analysis.
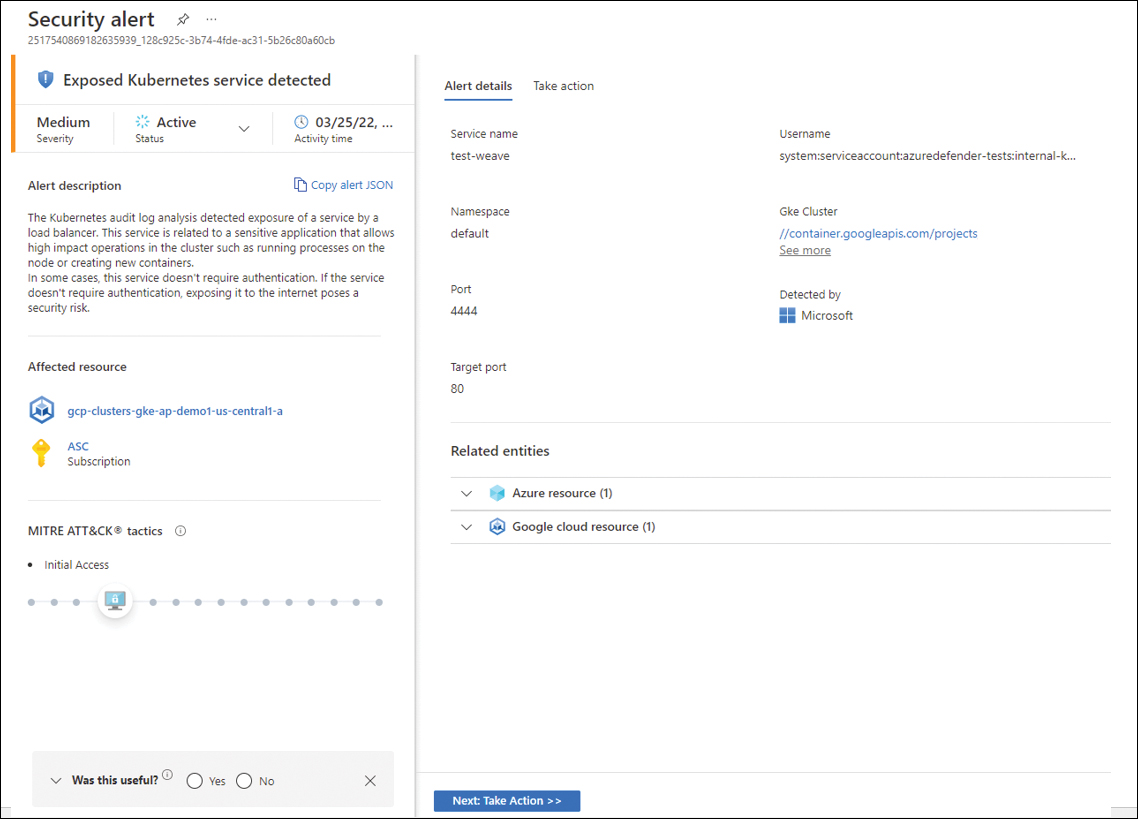
FIGURE 6-14 Threat Detection for Containers
To determine whether the alert is based on the control plane or the runtime workload in the clusters, use the Copy Alert JSON button shown in Figure 6-14, paste the content into a Notepad file, and check the suffix, as shown in the alertName field that appears in the raw JSON shown in Listing 6-1.
LISTING 6-1 Alert JSON
 "type": "Microsoft.Security/Locations/alerts",
  "properties": {
  "vendorName": "Microsoft",
  "alertDisplayName": "Exposed Kubernetes service detected",
  “alertName”: “K8S_ExposedService”,
  "detectedTimeUtc": "2022-03-25T13:11:21.736406Z",
  "description": "The Kubernetes audit log analysis detected exposure of a service by a
load balancer. This service is related to a sensitive application that allows high impact
operations in the cluster such as running processes on the node or creating new contain-
ers.
In some cases, this service doesn't require authentication. If the service doesn't
require authentication, exposing it to the internet poses a security risk.",
  "remediationSteps": "1. Find the external IP address of the service with the command:
kubectl get service [service name] -n [namespace]. The service name and namespace are in
the alert details.
2. Check whether the service is exposed to the internet by trying to
access to its IP address with the port listed in the alert details.
3. If the service is
exposed to the internet and is not protected by an authentication mechanism, escalate the
alert to your security information team.",
  "actionTaken": "Undefined",
  "reportedSeverity": "Medium"
If it is a control plane security alert, you will see the K8S_ prefix, as shown in the code above, and if it is a runtime workload in the clusters type of alert, you will see the K8S.NODE_ prefix.
Tip
You can see the list of all alerts that can be generated by Defender for Containers at https://aka.ms/azdforaks.
Defender for App Service
Azure App Service is a service for hosting web applications, REST APIs, and mobile back ends. It enables you to develop in many languages, such as .NET, .NET Core, Java, Ruby, Node.js, PHP, or Python. Applications run and scale on both Windows and Linux. Defender for Cloud leverages the scale of the cloud to identify attacks on App Service applications; it focuses on emerging attacks while attackers are in the reconnaissance phase and identifies vulnerabilities across multiple websites hosted on Azure.
Defender for App Service detects a multitude of threats by continuously monitoring the VM instance in which the App Service is running and its management interface. It also monitors the requests and responses sent to and from your App Service apps and the underlying sandboxes and VMs. Figure 6-15 shows an example of a Dangling DNS Alert, which is an analytic available in this plan to catch a DNS record that points to a recently deleted App Service resource.
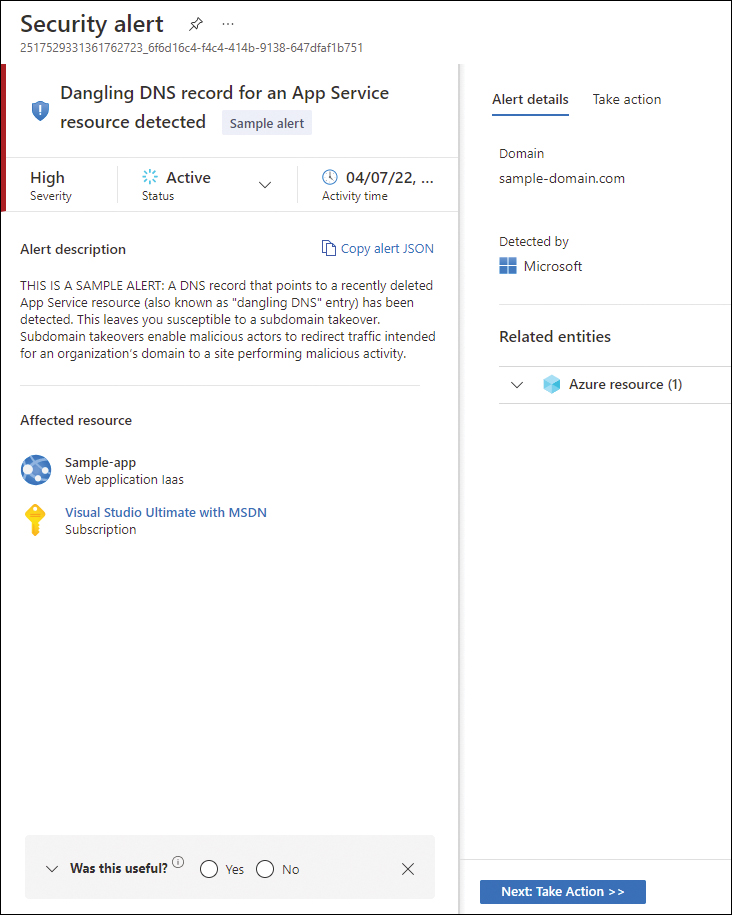
FIGURE 6-15 Dangling DNS Alert triggered by Defender for App Service
Although this is a sample alert generated by the Sample Alert feature, it gives you an idea of the metadata available for this analytic. This type of attack usually takes place when a website is removed, but the custom domain from the DNS registrar is not. In this case, the DNS entry points to a non-existent resource, which means the domain is vulnerable to a takeover. Although Defender for Cloud does not perform a scan DNS registrar for existing dangling DNS entries, it will still trigger an alert when an App Service website is decommissioned and its custom domain (DNS entry) is not deleted.
Important
This Dangling DNS Alert is available whether your domains are managed with Azure DNS or an external domain registrar. It applies to App Service on Windows and Linux.
Defender for Storage
Visibility and control of different workloads are critical when it comes to security hygiene. Exposed storage containers are a typical scenario targeted by threat actors utilizing custom scanners built specifically to identify public containers. Microsoft Defender for Storage is an Azure-native layer of security intelligence that detects unusual and potentially harmful attempts to access or exploit your storage accounts.
Defender for Storage can be enabled for data stored in Azure Blob Storage (Standard/Premium StorageV2, Block Blobs), Azure Files, and Azure Data Lake Storage (ADLS) Gen2. You can enable Defender for Storage on the subscription level just like any other plan, but you can also enable it only on the storage accounts you want to protect. The steps to enable this plan on the subscription level are the same as shown in the “Defender for Servers” section earlier in this chapter. If you only want to enable it on the storage account itself, you can use the Enable-AzSecurityAdvancedThreatProtection PowerShell command, as shown in the example below:
Enable-AzSecurityAdvancedThreatProtection -ResourceId "/subscriptions/
<subscription-id>/resourceGroups/<resource-group>/providers/Microsoft.Storage/
storageAccounts/<storage-account>/"
Defender for Storage works by continually analyzing the telemetry stream generated by the Azure Blob Storage and Azure Files services. If a potential malicious activity is detected, a security alert is generated. Defender for Storage provides alerts based on different types of threats, as shown below:
Unusual access to an account Alerts that fit this category include threats, such as access from a TOR exit node.
Unusual behavior in an account Alerts that are part of this category are the ones where the behavior is a deviation from a learned baseline, such as an unusual deletion of blobs or files.
Hash reputation-based malware detection As files are uploaded to the storage account, they are analyzed by the hash reputation system, which looks to Microsoft Threat Intelligence to determine whether the file is suspicious. It is very important to understand that this is not an antimalware feature because it only looks into the file hash and does not scan the file.
Unusual file uploads Alerts that fit this category are the ones where an upload deviates from the normal pattern, such as uploading cloud service packages and executable files.
Public visibility Alerts in this category are related to break-in attempts using public scanners.
Phishing campaigns Alerts in this category are related to scenarios in which a piece of content that is hosted on Azure Storage is identified as part of a phishing attack impacting Microsoft 365 users.
Figure 6-16 shows an example of the Access from an unusual location to a storage file share alert, where you can see more details about the attack.
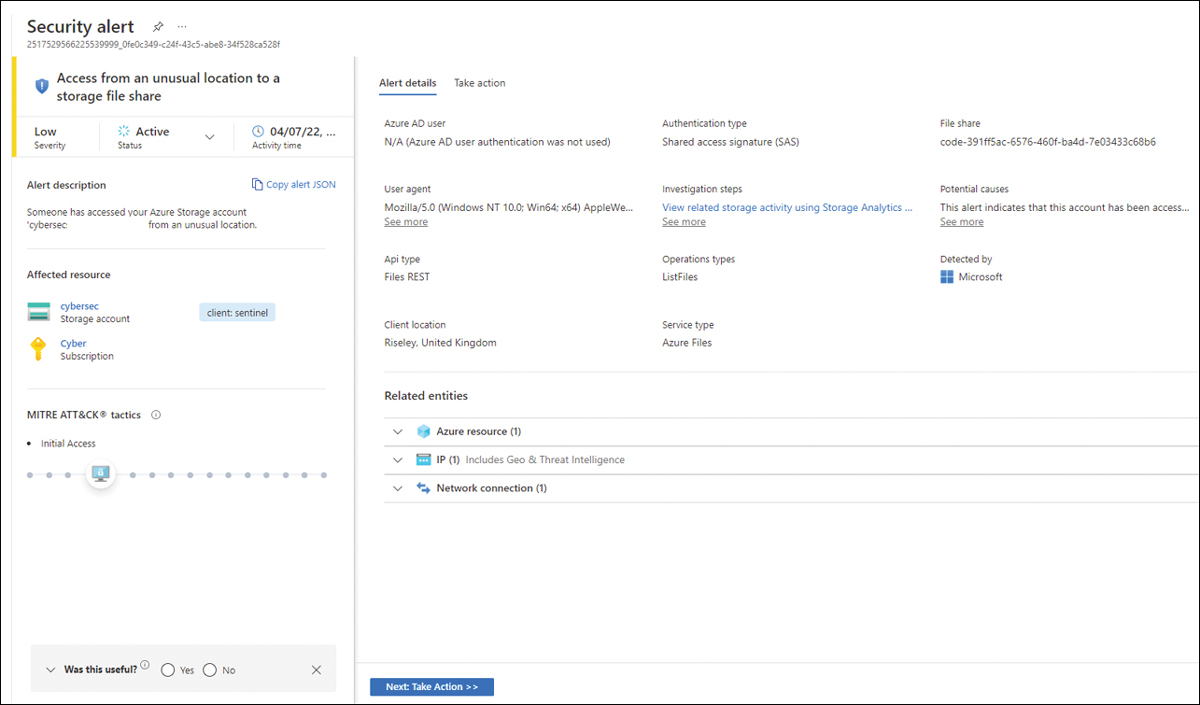
FIGURE 6-16 Access From An Unusual Location Alert generated by Defender for Storage
Considerations before enabling Defender for Storage
While our general recommendation is to keep Defender for Storage enabled across every type of storage account at the subscription level, some organizations that need to limit costs might need to prioritize what is most critical to them and enable those things only at the storage account level.
There is also a misunderstanding that storage accounts behind private links don’t pose a risk and therefore don’t need to have Defender for Storage enabled. The reality is that there are several threats to the storage account behind private links. The most prominent threats are
Malicious insiders
Compromised identities
When lateral movement occurs within the private network when a resource and access keys or access tokens have been compromised
When identity has been compromised and access privileges have been escalated
For these reasons, exclusively using this rationale is not a recommended approach. Before making this decision, it is important for your organization to perform a risk assessment that considers the following factors:
The type of information stored in the storage account
The potential impact if this data is compromised
Whether an attacker can leverage the storage account as an entry point into your organization
Based on this assessment and the cost estimation that you found using the estimation workbook, you can decide if you want to keep Defender for Storage enabled in the entire subscription or if you want to enable it only on critical storage accounts. Another outcome of this risk assessment is that you always want to have threat detection for all storage accounts but want to exclude storage accounts that don’t have critical data that needs to be monitored. If that’s the case, use the procedures from http://aka.ms/D4StorageExclusion to exclude only the desired storage accounts.
Defender for SQL
Defender for SQL is a protection plan that helps you mitigate potential database vulnerabilities and detect anomalous activities that might indicate threats against your databases. Defender for SQL has evolved over the years and currently has two major plans:
Defender for Azure SQL This plan includes Azure SQL Database, Azure SQL Managed Instance, and Dedicated SQL pool in Azure Synapse.
Defender for SQL servers on machines This plan includes the SQL Server running on VMs in Azure, on-premises, or in another cloud provider.
Defender for SQL provides threat detection for anomalous activities indicating unusual and potentially harmful attempts to access or exploit databases. Figure 6-17 shows an example of an alert triggered by this plan.
One important aspect of Figure 6-17 can be seen in the lower-left corner within the Data Classification field. This information is populated there because of the native integration with Azure Purview. You will learn more about this integration in Chapter 7, “Better together.”
Defender for SQL can be easily enabled on the subscription level of any Azure SQL database you want. No agent is required. However, to use the Defender for SQL servers on machines, you need to enable the plan on the subscription level, and you must onboard the server, which means provisioning the Log Analytics Agent on SQL Server. If your VMs are in Azure, you just need to use the auto-provisioning option in Azure Security Center to automatically onboard the Log Analytics Agent to your Azure VMs.
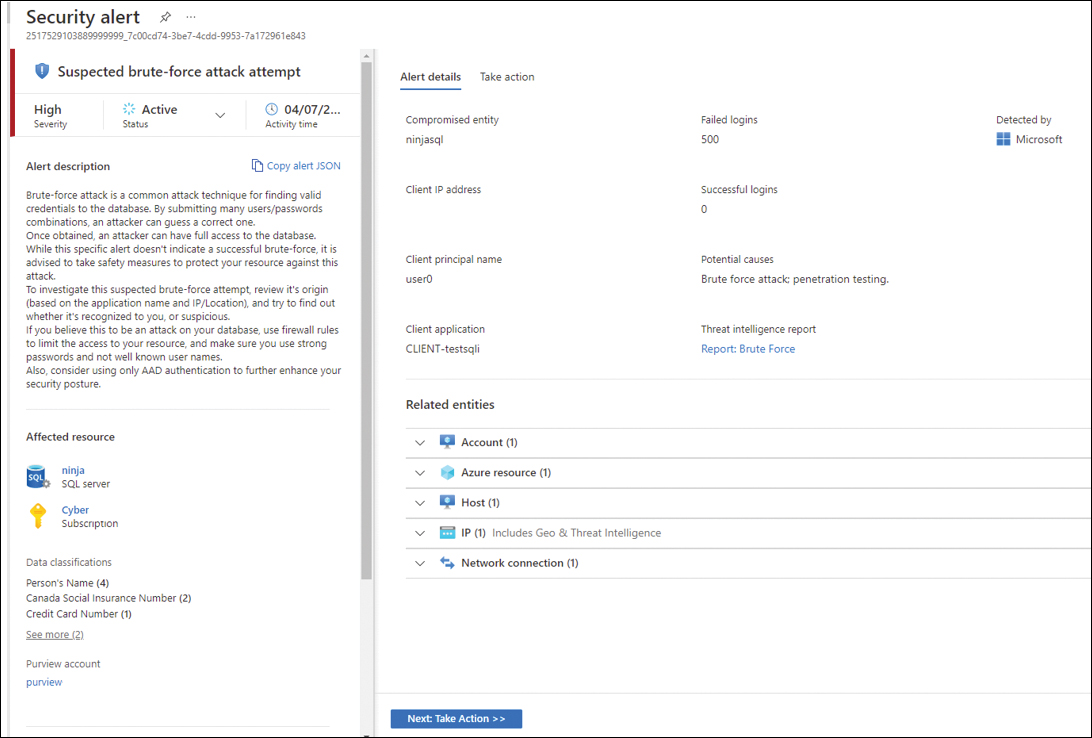
FIGURE 6-17 Brute-force attack attempt against an SQL database
As part of the onboarding process, you must also enable Azure Arc. We recommend that you use Azure Arc for your SQL servers that are on-premises or in different cloud providers (AWS and GCP), and once they are fully onboarded, you can deploy the Log Analytics Agent. In summary, follow the sequence below to fully onboard:
Enable Azure Arc on your machines. (Follow the steps at http://aka.ms/ASCbookEnableArc.)
Install the Log Analytics Agent to this machine. You can easily identify which machines are missing the agent by reviewing this Security Center recommendation:
Log Analytics Agent Should Be Installed On Your Windows-Based Azure Arc Machines.Enable the SQL Servers On Machines pricing plan on the Pricing & Settings page in Defender for Cloud. The plan will be enabled on all SQL servers and fully active after the first restart of the SQL Server instance.
Tip
You can quickly identify Azure Arc-enabled machines using the Inventory dashboard. Create a filter based on the Resource Type and change the criteria to see only servers – azure arc.
Vulnerability Assessment for SQL
Built-in Vulnerability Assessment (VA) is another important capability that comes with Defender for SQL. Defender for SQL will identify that you don’t have SQL VA enabled on your workloads and will trigger a recommendation suggesting you enable this feature. Once the feature is on, SQL VA scans your database and gives you a comprehensive list of items that need to be addressed. SQL VA employs a knowledge base of rules that flag security vulnerabilities. It brings awareness of deviations from security best practices, such as misconfigurations, excessive permissions, and unprotected sensitive data.
You can access the assessment from the SQL Databases Should Have Vulnerability Findings Resolved security recommendation, as shown in Figure 6-18.
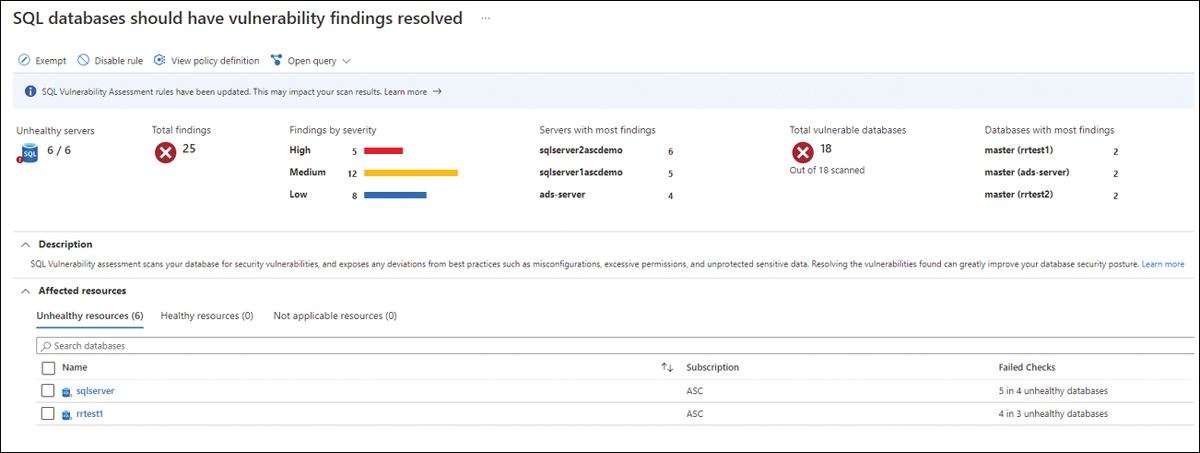
FIGURE 6-18 VA results in SQL
In this list, you can see all affected resources, and once you click a particular resource, you can visualize the affected databases and the security checks that were performed in more detail, as shown in Figure 6-19.
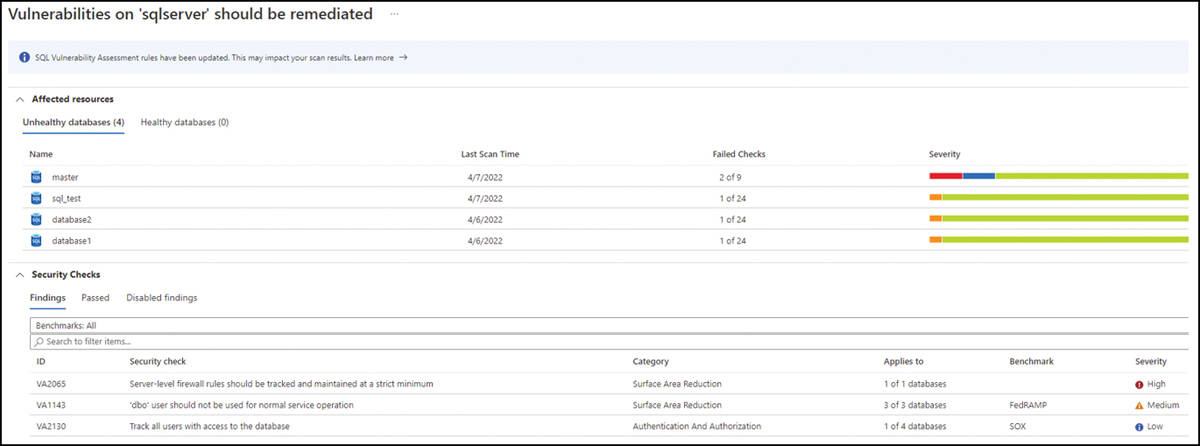
FIGURE 6-19 List of affected databases
Now that you have this view, you can start remediating each security check. To do that, click the security check you want to remediate, and a new blade with more details about the security check will appear, as shown in Figure 6-20.
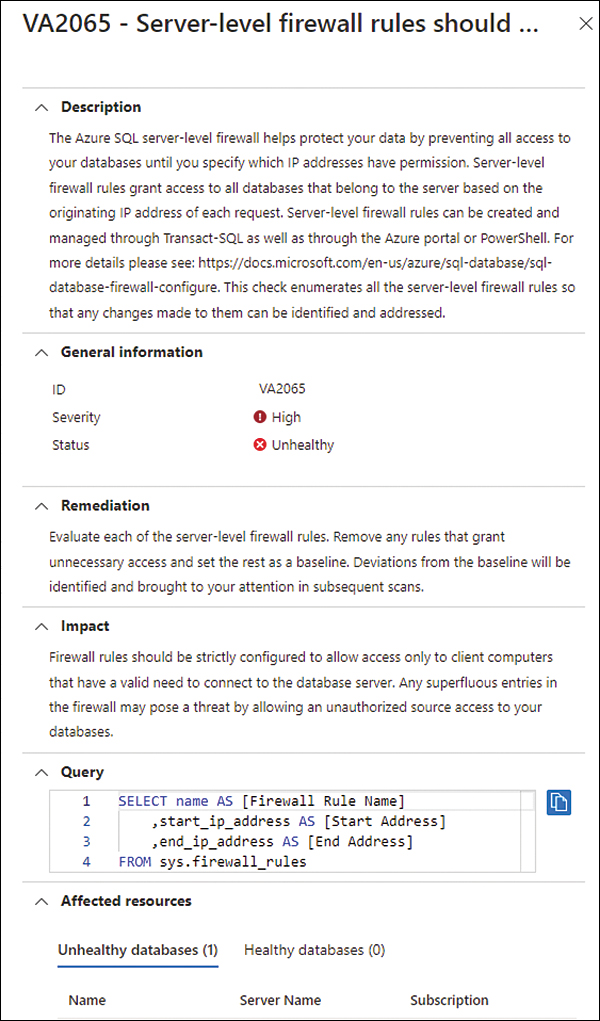
FIGURE 6-20 Details about the security check
After reviewing the details of the security check, you can click the affected database to implement the remediation.
So far, you have accessed SQL VA entirely from the Defender for Cloud dashboard. However, you can also view this information directly from the database. For example, you can go to the SQL Database dashboard, select the database you want to review, and in the left navigation pane, select Defender For Cloud. There, you have the consolidated view of all recommendations, alerts, and the Vulnerability Assessment relevant to the selected database, as shown in Figure 6-21.
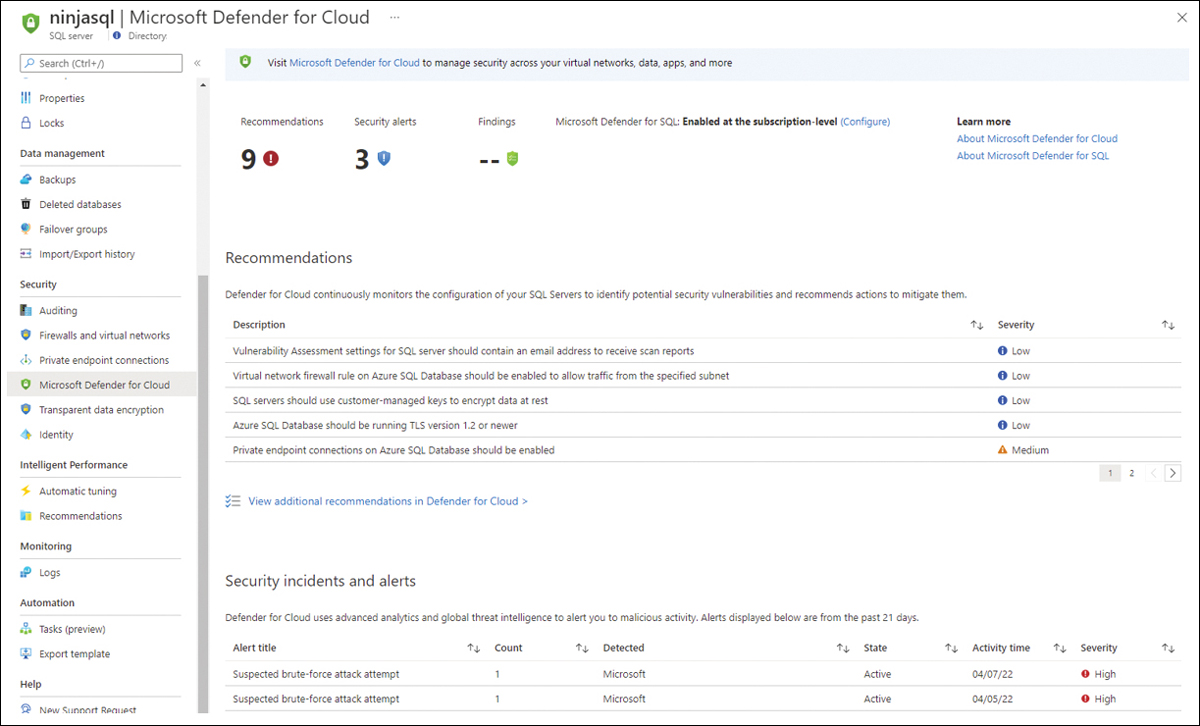
FIGURE 6-21 Microsoft Defender for Cloud blade integrated with Azure SQL
This is a good visualization for the database owner who needs to know more about the security-related events of the selected database.
Defender for Cosmos DB
Azure Cosmos DB is a fully managed NoSQL database for modern, fast, and flexible app development, capable of having single-digit millisecond response times, automatic and instant scalability, and multiple SDKs and APIs to support a variety of non-relational data models.
In June 2022, Microsoft released the Defender for Cosmos DB plan in general availability. The enabling process is very similar to SQL, where you can enable it on the subscription or resource levels. At the same time, another change was introduced to allow you to enable the database-related plan from a dedicated blade, available on the Defender Plans page, as shown in Figure 6-22.
Defender for Azure Cosmos DB monitors your Azure Cosmos DB accounts and detects various attack vectors, such as attacks originating from the application layer, SQL injections, suspicious access patterns, compromised identities, malicious insiders, and direct attacks on the database. Figure 6-23 shows a sample alert generated by Defender for Cosmos DB.
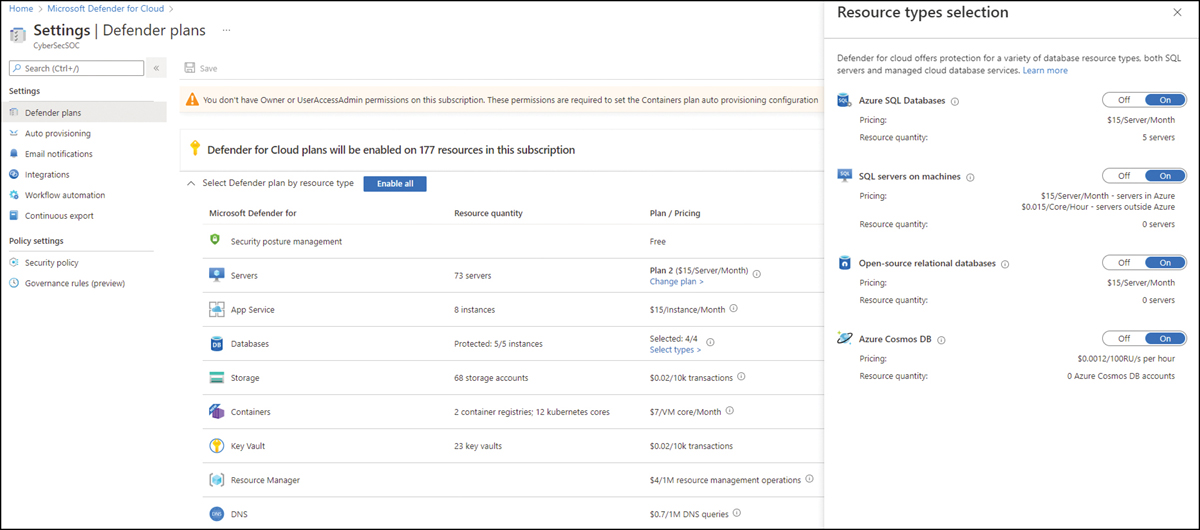
FIGURE 6-22 Database plan blade
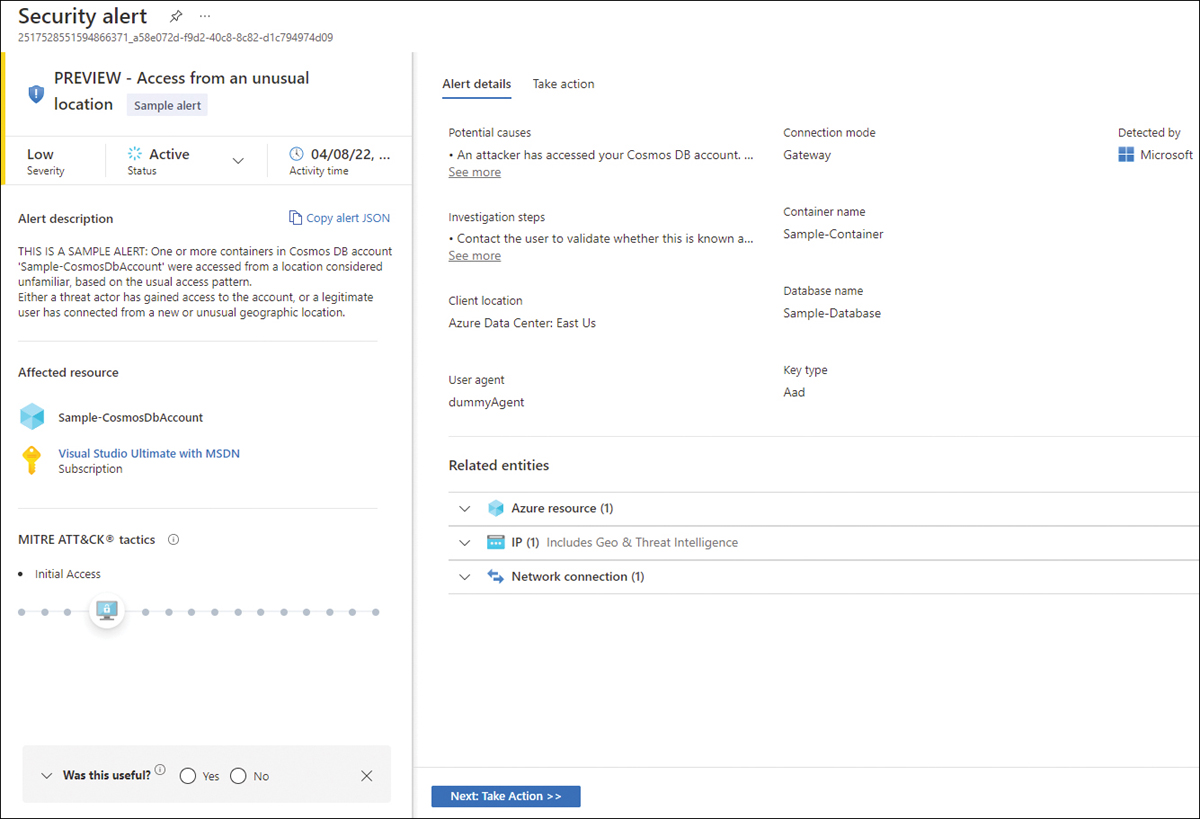
FIGURE 6-23 Access From Unusual Location alert
This sample alert is triggered in real scenarios when Defender for Cosmos DB identifies an Azure Cosmos DB account that was accessed from a location considered unfamiliar. This familiarity is based on the usual access pattern.
Defender for Open-Source Relational Databases
Another 2022 addition was the Defender for Open-Source Relational Database, which includes support for Azure Database for PostgreSQL, Azure Database for MySQL, and Azure Database for MariaDB. Just like the other database plans, Defender for Open-Source Relational Databases includes detection for anomalous activities indicating unusual and potentially harmful attempts to access or exploit databases. Enabling this plan is performed in the same way as shown previously in the “Defender for Cosmos DB section.” However, unlike Defender for SQL, this plan doesn’t include Vulnerability Assessment for open-source relational databases.
The alerts generated by Defender for Open-Source Relational Databases might have the same alert title across Azure Database for PostgreSQL, Azure Database for MySQL, and Azure Database for MariaDB. However, if you copy the alert in JSON format (as shown previously in this chapter), you will see that the alertName field is different. For example, the alert titled Suspected brute force attack using a valid user is the same for all three databases, but if you look at the JSON, the alertName is SQL.PostgreSQL_BruteForce, SQL.MariaDB_BruteForce, or SQL.MySQL_BruteForce.
Defender for Key Vault
Defender for Key Vault uses machine learning to detect unusual and potentially harmful attempts to access or exploit Key Vault accounts. When this chapter was written, the only option to enable Defender for Key Vault was to enable it on the entire subscription. Figure 6-24 shows an Defender for Key Vault sample alert.
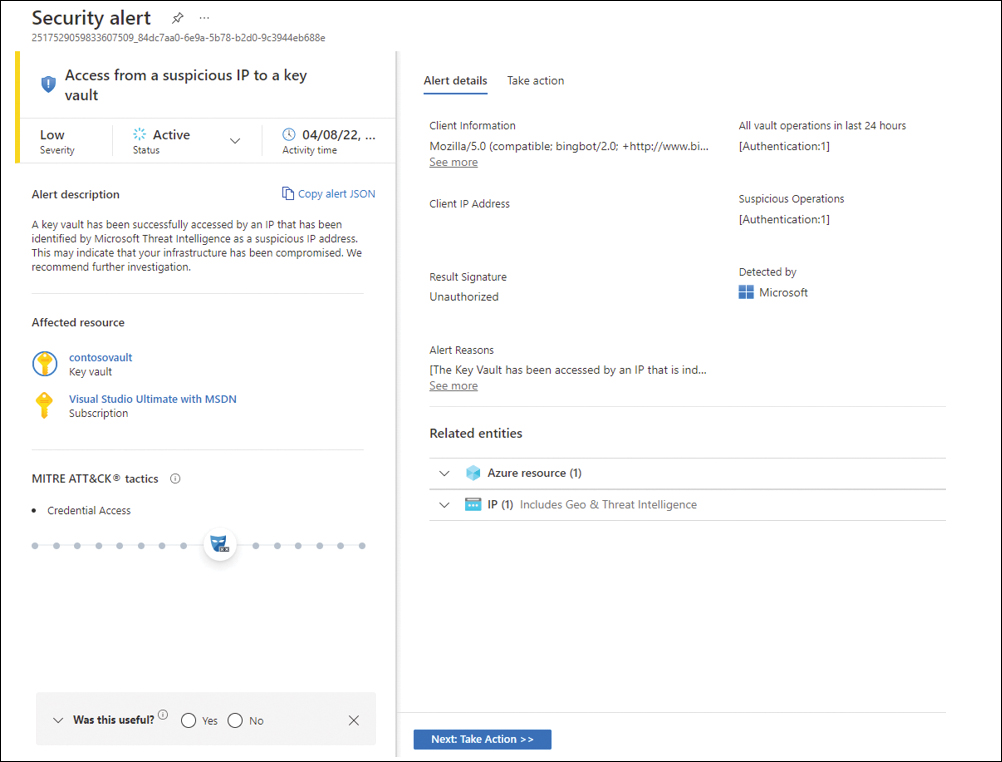
FIGURE 6-24 Access from a suspicious IP to a Key Vault
Defender for Resource Manager
Azure Resource Manager (ARM) is Azure’s deployment and management service. ARM provides a management layer that allows you to create, update, and delete resources in your Azure account. These operations can be done via the Azure portal, PowerShell, Azure CLI, REST APIs, and client SDKs.
Threat actors targeting ARM will most likely use toolkits such as Microbust to discover weak configurations and perform post-exploitation actions such as credential dumping. Defender for Resource Manager uses advanced security analytics to detect threats and trigger an alert when suspicious activity occurs. Also, Defender for Resource Manager can detect suspicious resource management operations, including suspicious IP addresses, disabling the antimalware, and executing suspicious scripts in virtual machine extensions. It can also detect lateral movement from the Azure management layer to the Azure resources data plane. Figure 6-25 shows an example of an alert generated by Defender for Resource Manager.
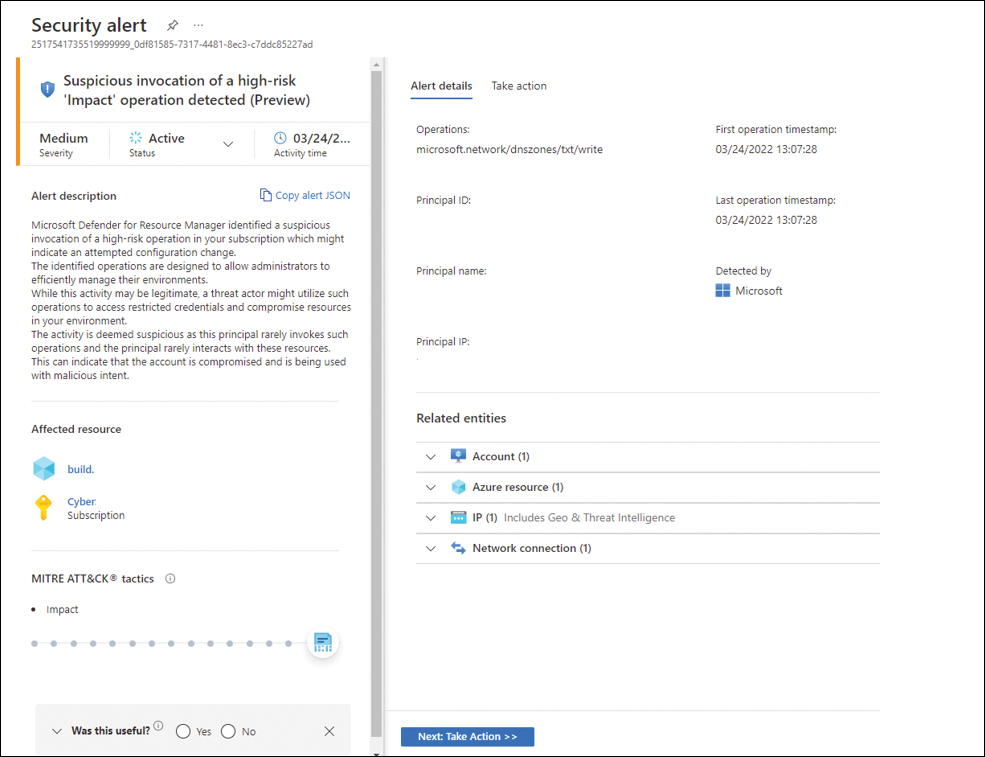
FIGURE 6-25 Defender for Resource Manager alert
Tip
If you open the JSON of an alert generated by Defender for Resource Manager, you will notice that the beginning of the name always has the suffix ARM_.
Defender for DNS
Defender for DNS is a threat detection that can be enabled if you are using Azure DNS. Azure DNS is a hosting service for DNS domains that leverages Microsoft Azure infrastructure to provide name resolution. According to the 2020 Global DNS Threat Report, in a study performed by the International Data Corporation (IDC), 79 percent of the surveyed organizations experienced a type of DNS attack, and DNS spoofing was the number-one type of attack (39 percent).
More Info
You can download the report from https://www.efficientip.com/resources/idc-dns-threat-report-2020/.
Defender for DNS can identify DNS Phishing attacks by analyzing DNS transactions, and it can identify a request for a possible phishing domain. Such activity is frequently performed by threat actors to harvest credentials to remote services. This activity is usually followed by exploiting credentials on the legitimate service. Also, Defender for DNS can identify the following:
DNS tunneling, which can be used to exfiltrate data from your Azure resources
Malware communicating with a command-and-control server
Communication with malicious domains for phishing or cryptomining
Communication with malicious DNS resolvers
Figure 6-26 shows a sample alert for a suspicious activity detected by Defender for DNS based on an analysis of DNS transactions.
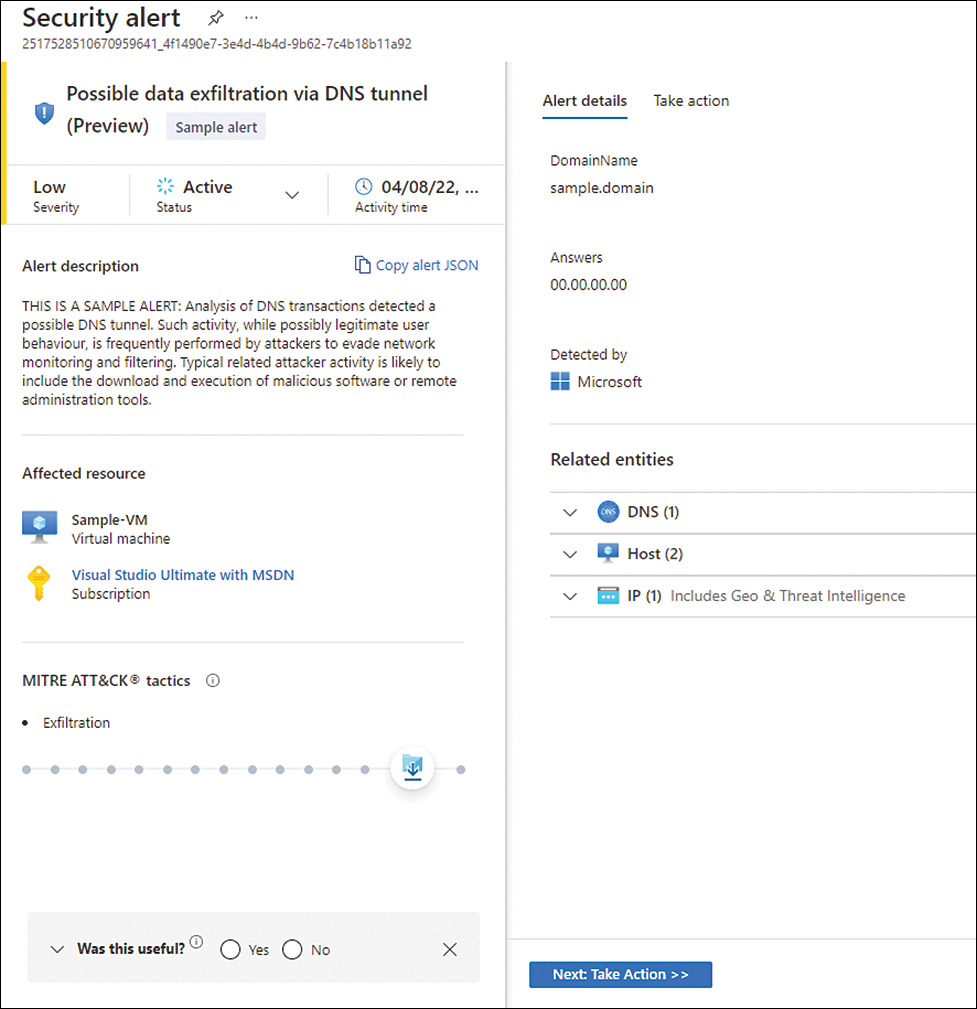
FIGURE 6-26 Defender for DNS alert
The cyberkill chain and fusion alerts
The cyberkill chain is a threat model described in 2011 by analysts from Lockheed Martin. The model was designed to help security teams and researchers organize their thinking about detecting and responding to threats. The model is now generally accepted and is part of the general lexicon of all security professionals.
The original cyberkill chain was divided into these phases:
Reconnaissance During this phase, the attacker identifies the best targets.
Weaponization Here, files are altered to make them weapons against a target system and are used to install malicious code.
Delivery At this point, weaponized files are placed on the target.
Exploitation During this phase, weaponized files are detonated; that is, they’re run on the victim system.
Installation At this point, a back door is installed on the compromised system, giving the attacker persistent access.
Command-and-control (C&C) Here, malware on the compromised system communicates with a C&C system that gives the attacker access to the resources required to carry out their objective.
Actions on objectives At this point, the attacker carries out their objectives, which might be predefined or might have evolved based on discovery. The cyberkill chain was defined when on-premises computing was the norm. Now that cloud computing is considered to be a better option, the cyberkill chain must be re-evaluated and updated. A reconfiguration of the cyberkill chain might include the following phases:
Active recon In this phase, the attacker uses numerous footprinting methods to identify the operating system or services being used, which will be the focus of the attack.
Delivery Because most public cloud assets lack a logged-on user, attackers will need to hack the system—typically by finding unpatched exploits that can be leveraged against the system or service.
Exploitation This phase focuses on problems on the server-side instead of the client-side.
Persistence Unlike client-side systems, which are rebooted often, server- and service-specific systems are rarely rebooted. The exploit code will need to remain in memory to remain persistent within the system. That is the focus of this stage.
Internal recon Attacks against cloud-based systems are server-based. Therefore, rather than installing new tools, the attacker can simply use the server’s built-in tools to conduct the attack. This helps the attacker remain undiscovered, as installing new tools could trigger an alert.
Defender has a type of alert called a security incident, which is raised in the dashboard whenever the system identifies multiple alerts that, when correlated with each other, indicate that those alerts belong to the same attack. A security incident uses the fusion capability to correlate the alerts that appear to be related to each other.
Figure 6-27 shows an example of what such an attack campaign might look like and what alerts might be raised at the various stages of a cyberkill chain. The figure shows a highly simplified version of the cyberkill chain (outlined in the previous steps) to make it easier to understand how fusion alerts work.
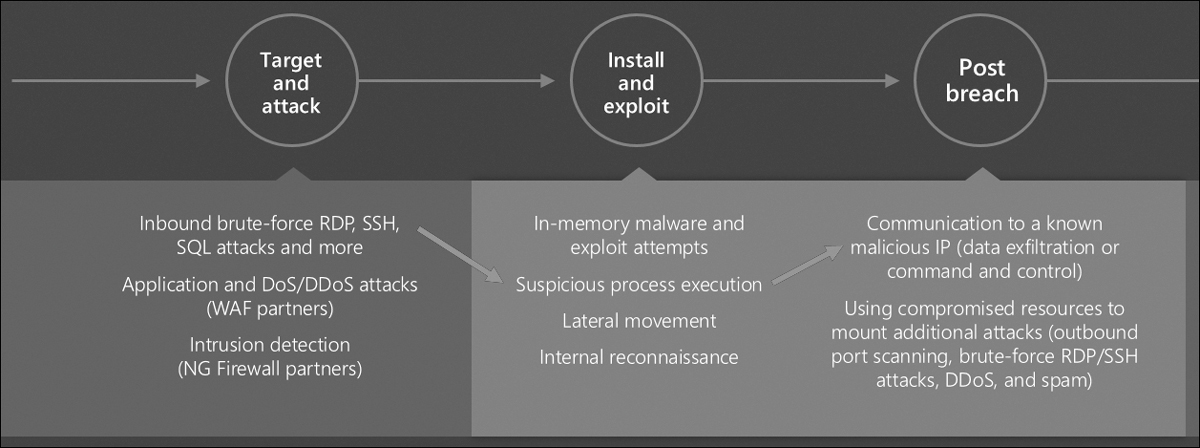
FIGURE 6-27 Microsoft Defender for Servers detections across the cyberkill chain
The sequence in Figure 6-27 goes like this:
Target and attack In this phase, Defender for Servers detects what appears to be a brute-force attack against the Remote Desktop Protocol (RDP) server on a VM. This determination is made by comparing a baseline of RDP connections to the VM, the current rate of RDP login attempts, and other factors related to RDP logins.
Install and exploit Here, Defender for Servers detects the execution of a suspicious process on the VM. This suspicious process could be predefined (known-bad malware), or it could be a process that wasn’t executed on the machine during previous baselines and is therefore unrecognized. (For example, maybe the process is launched by software recently installed by the admin.) You’ll have to correlate this event with other events to find out.
Post-breach At this point, Defender for Servers has detected what appears to be a communication channel established between the VM and a known-malicious IP address (probably flagged by a threat intelligence feed). There’s a very good chance that this is bad, but there is still a chance that it isn’t. For example, maybe a security researcher or a red-team member working for the customer connected to the address on purpose. Yes, a connection to a known-bad IP address is serious, but it doesn’t guarantee that the VM has been compromised.
Taken individually, each phase of the cyberkill chain indicates something bad might be happening but cannot offer complete certainty. However, when you correlate these findings, you can be almost 100 percent sure that a brute-force RDP attack has compromised the VM, the attacker has installed and run new malware on the machine, and the malware is communicating with a C&C server (likely identified by a threat intelligence feed). As a result, a security incident appears in the alert dashboard in the format shown in Figure 6-28.
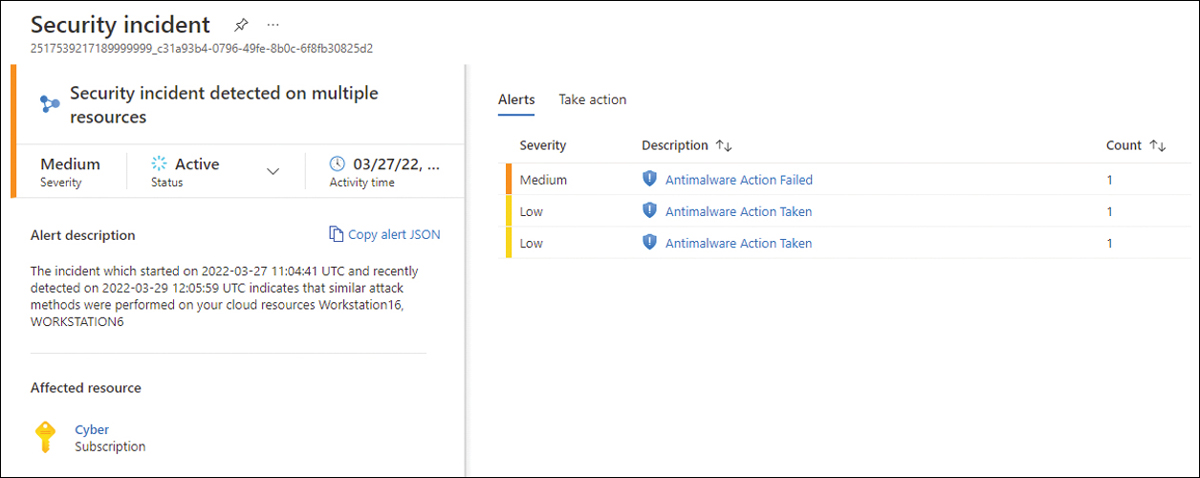
FIGURE 6-28 Security incident powered by fusion
On the right side of this dashboard are the individual alerts that are part of this security incident, which help you investigate the alerts (because now you know that there is a correlation between these alerts, and, most likely, they are part of the same attack campaign).
Threat intelligence in Defender for Cloud
As explained throughout this chapter, when a Defender for Cloud plan identifies a threat, it triggers a security alert containing detailed information regarding the event, including suggestions for remediation.
For some alerts, Defender for Cloud will also provide threat intelligence reports to facilitate your investigation. These reports contain information about the detected threats, including the following:
Attacker’s identity or associations (if this information is available)
Attackers’ objectives
Current and historical attack campaigns (if this information is available)
Attackers’ tactics, tools, and procedures
Associated indicators of compromise (IoC) such as URLs and file hashes
Victimology, which is the industry and geographic prevalence to assist you in determining if your Azure resources are at risk
Mitigation and remediation information
Keep in mind that this information is not always available for all types of alerts. It’s only available for the ones that Defender for Cloud can correlate with Microsoft Threat Intelligence and provide more insights to help during the investigation. The alert shown in Figure 6-29 shows an example of an alert that contains a threat intelligence report.
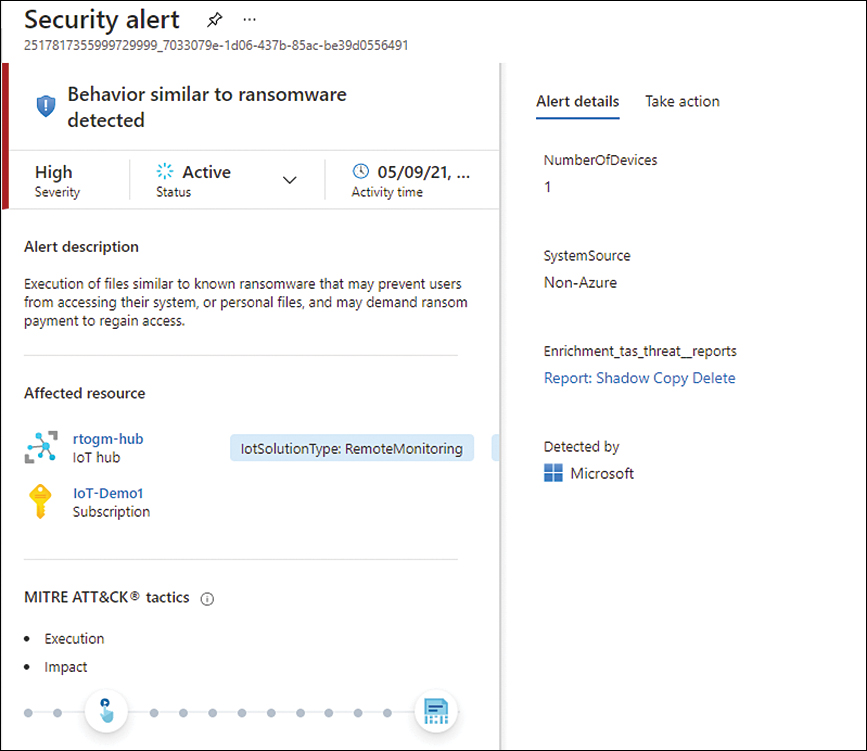
FIGURE 6-29 Alert with enrichment from a threat intelligence report
In the Alerts Details tab, there is a link for the report, which, in this case, is called Report: Shadow Copy Delete. By clicking this hyperlink, you can download the PDF containing detailed information about this threat, as shown in Figure 6-30.
FIGURE 6-30 Threat intelligence report
Responding to alerts
Throughout this chapter, you saw many examples of how the different Defender for Cloud plans can trigger alerts that are rich in details and information that can assist you in responding to that alert by taking corrective actions to remediate the issue. The approach to investigating each alert can be different according to the alert type and the resource itself. For this example, let’s use the Defender for Key Vault alert. Although it has some unique steps, most of the approach applies to most other alerts.
What is unique in a Defender for Key Vault alert is the fact that every alert includes an Object Identifier (ID), the User Principal Name (UPN), or the IP address of the suspicious resource. It is important to highlight that the availability of this information can also vary according to the type of access that occurred. For example, if an application accessed your Key Vault, you will not see the associated UPN, and if the traffic originated from outside of Azure, you wouldn’t see an Object ID. With that in mind, we can summarize the response process for an Azure Key Vault alert in the following steps, which are further explained in the coming sections:
Contact
Mitigation
Impact
Take action
Contact
In this step, you need to verify where the traffic is coming from—in other words, whether the traffic originated from within your Azure tenant. Verify whether you have Key Vault Firewall enabled. If you do, granting access to the user or application likely triggered the alert.
If you can identify the source of the traffic as coming from your own tenant, then contact the user or application owner. If, for some reason, you cannot verify the traffic’s source, skip to the next step.
Mitigation
In this step, you assume the access shouldn’t have been authorized because you couldn’t determine the source of the traffic in the previous step. If the traffic came from an unrecognized IP address, make sure to do the following:
Enable the Azure Key Vault firewall (if you don’t have it enabled already).
Configure the firewall to allow only trusted resources and virtual networks.
However, if the alert source was an unauthorized application or suspicious user, make sure to configure the Key Vault’s access policy settings to remove the corresponding security principal or restrict the operations the security principal can perform.
Another scenario is if the alert source has an Azure Active Directory role in your tenant. To respond to this scenario, you should start by contacting your administrator and then determine whether there’s a need to reduce or revoke Azure Active Directory permissions.
Impact
Once the attack’s impact has been mitigated, you need to investigate the secrets in your Key Vault that were affected. In this step, you will need to do the following:
Review the triggered alert.
Review the list of the secrets that were accessed and the timestamp.
If you have Key Vault diagnostic logs enabled, review the previous operations for the corresponding caller IP, user principal, or Object ID.
Take action
You’ve already compiled a list of the secrets, keys, and certificates accessed by the suspicious user or application. Your next immediate action is to rotate those objects.
Ensure that affected secrets are disabled or deleted from your Key Vault. If the credentials were used for a specific application, you would need to contact the administrator of the application and ask them to audit their environment for any uses of the compromised credentials since they were compromised. If the compromised credentials were used, the application owner should identify the information that was accessed and mitigate the impact.