
Chapter 7
Better Together
Microsoft Defender for Cloud can integrate with other Microsoft Security solutions to improve the overall security posture of the workloads and ensure threat detections are streamed to a Security Information and Event Management (SIEM) solution. Also, this integration provides the benefits of an Endpoint Detection and Response (EDR) solution.
In this chapter, you will learn how Defender for Cloud integrates with Microsoft Sentinel, Microsoft Purview, and Microsoft Defender for Endpoint (MDE).
Defender for Cloud and Microsoft Sentinel
Defender for Cloud alerts are published to the Azure Monitor, which enables you to use Event Hub to route Defender for Cloud alerts into an on-premises or cloud-based SIEM solution. The general process occurs in three major phases:
Create an Event Hub that will be the destination for your Defender for Cloud data.
Stream Azure Monitor logs into the Event Hub.
Install and configure the SIEM solution vendor’s connector to stream the data from the Event Hub to your SIEM solution.
Note
Also, you can utilize the Continuous Export feature in Defender for Cloud to export all alerts to a workspace and, from there, send them to your SIEM.
While this is the general process for most of the third-party SIEM solutions, the process is much simpler with Microsoft Sentinel. Microsoft Sentinel is a cloud-native Security Information Event Management (SIEM) and Security Orchestration Automated Response (SOAR) solution. Microsoft Sentinel delivers intelligent security analytics and threat intelligence across the enterprise, providing a single solution for alert detection, threat visibility, proactive hunting, and threat response.
Microsoft Sentinel enables you to collect data across devices, applications, and infrastructure, both on-premises and in multiple clouds. Microsoft Sentinel leverages Log Analytics’ workspace for data storage, as shown in Figure 7-1.
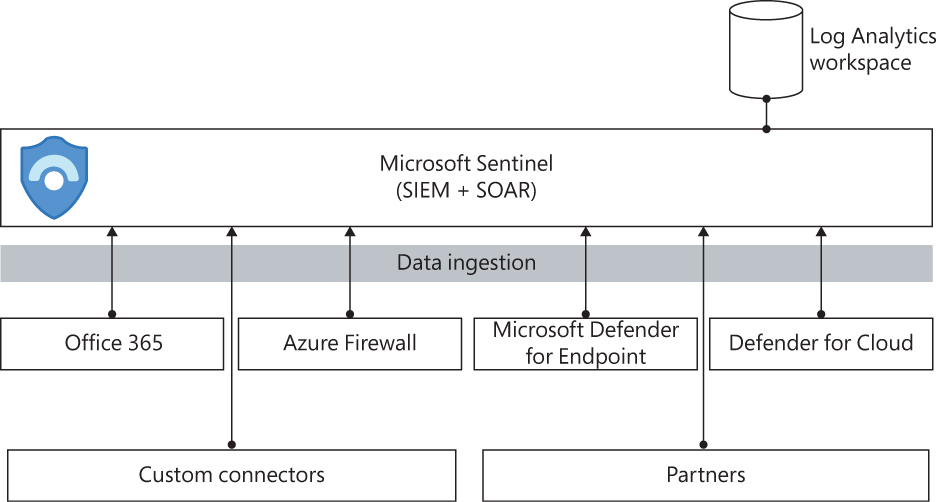
FIGURE 7-1 Microsoft Sentinel data ingestion and storage
To enable Microsoft Sentinel, you need an Azure Subscription, a Log Analytics Workspace, and contributor permissions on the subscription in which the Microsoft Sentinel workspace resides. Also, you need either contributor or reader permissions on the resource group to which the workspace belongs.
If you are using the default workspace created by Defender for Cloud, this workspace will not appear in the list when you try to enable Microsoft Sentinel. The rationale behind this is that default workspaces are managed by the service that created them (in this case, Defender for Cloud), and we want customers to have full control of their workspaces, including managing their retention periods and locations for Microsoft Sentinel. For this reason, you must create your own Log Analytics workspace.
Integration with Microsoft Sentinel
When you configure Defender for Cloud integration with Microsoft Sentinel, all security alerts generated in Defender for Cloud will be streamed to Microsoft Sentinel. Defender for Cloud must be enabled in the target subscription to configure this integration, and you need to be logged in with a user with global administrator or security administrator permissions on each subscription you want to connect. Follow the steps below to configure this integration:
Using the Azure portal, click All Services in the left navigation pane and type Sentinel.
Click the Microsoft Sentinel option.
The Microsoft Sentinel Workspaces blade appears for you to either select an existing workspace or create a new one. Because, in this case, you are configuring the integration with Defender for Cloud, the assumption is that Microsoft Sentinel has been already configured. So, select the workspace you are currently using.
The Microsoft Sentinel Overview page appears; in the left pane, in the Configuration section, click Data Connectors, as shown in Figure 7-2.
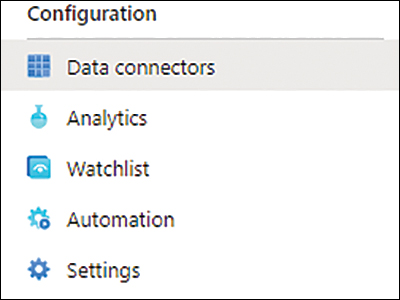
FIGURE 7-2 Configuration section in Microsoft Sentinel
The Microsoft Sentinel—Data Connectors blade appears. Select Defender For Cloud.
Click the Open Connector Page button, and the Instructions tab appears. The instructions are shown on the right side of the page (see Figure 7-3).
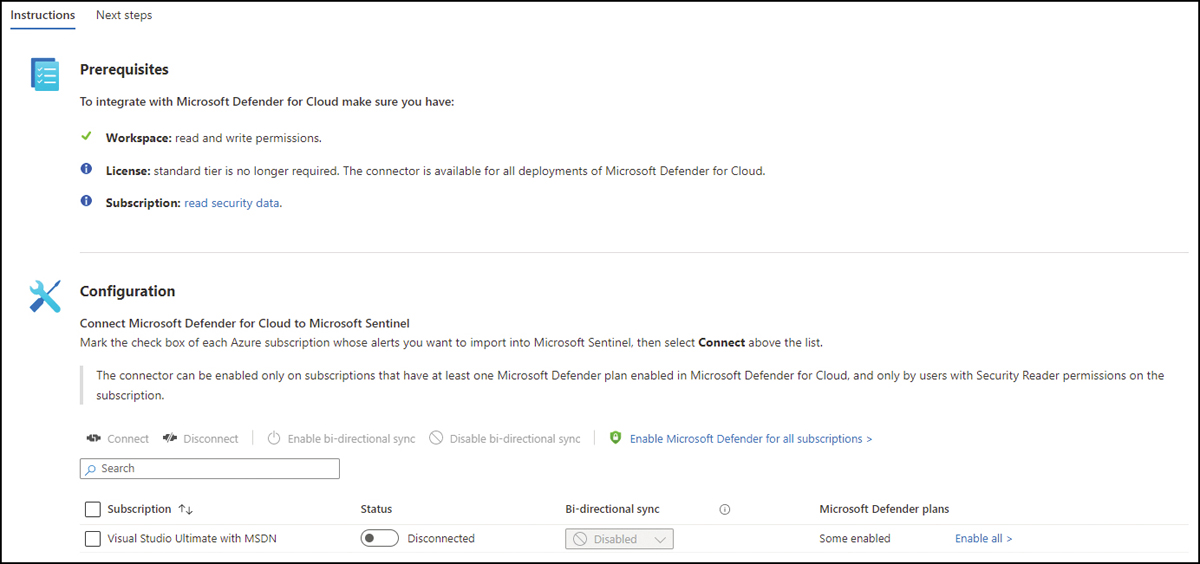
FIGURE 7-3 Instructions tab with the options to configure the connector
In the Configuration section, select the desired Subscription and click Connect. The status will change rapidly to
Connecting; once it finishes, it will show asConnected.If you scroll down on this page, you will see an optional step, Create Incidents— Recommended! to enable incident creation, as shown in Figure 7-4.
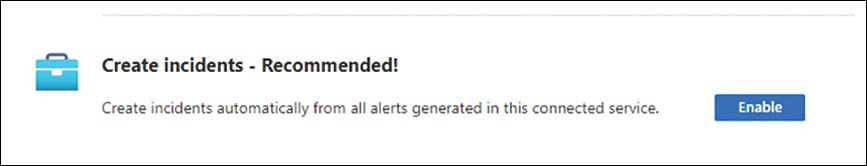
FIGURE 7-4 Optional step to automatically create incidents in Microsoft Sentinel
If you click the Enable button, the alerts from Defender for Cloud will automatically generate incidents in Microsoft Sentinel. For this example, you don’t need to enable it now.
Click the Close button to close the blade, and if the Defender for Cloud connector’s status doesn’t change to
Connected, click the Refresh button to update; the status should change, as shown in Figure 7-5.
FIGURE 7-5 Defender for Cloud connector status
At this point, the security alerts triggered in Defender for Cloud will appear in Microsoft Sentinel. When you connect Microsoft Defender for Cloud to Microsoft Sentinel, the status of security alerts is synchronized between the two services. If you want to validate this configuration, you can use the Defender for Cloud sample alerts (covered in Chapter 6) feature to simulate some alerts and see the alerts arriving in Microsoft Sentinel.
Accessing alerts in Microsoft Sentinel
As mentioned earlier, during the Defender for Cloud connector configuration, you could automatically enable the alerts generated by Defender for Cloud to generate incidents in Microsoft Sentinel. An incident is an aggregation of all the relevant evidence for a specific investigation, which can include multiple alerts coming from different data sources, as shown in Figure 7-6.
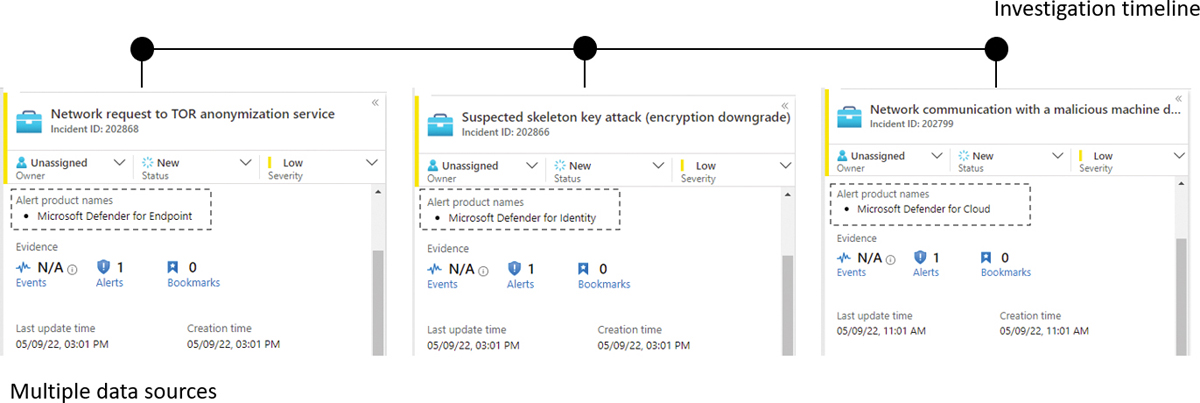
FIGURE 7-6 Microsoft Sentinel performs data aggregation using alerts from multiple data sources
In the Product Name field shown in Figure 7-6, the Network Communication With A Malicious Machine Detected alert was raised by Defender for Cloud. Because this alert is in the workspace used by Microsoft Sentinel, you can leverage the Microsoft Sentinel ability to search logs to obtain more information about this alert. Go to the Microsoft Sentinel main page, click Logs in the left navigation pane, click the Get Started button on the right blade, and close the sample queries window that appears. The Logs page appears, as shown in Figure 7-7.
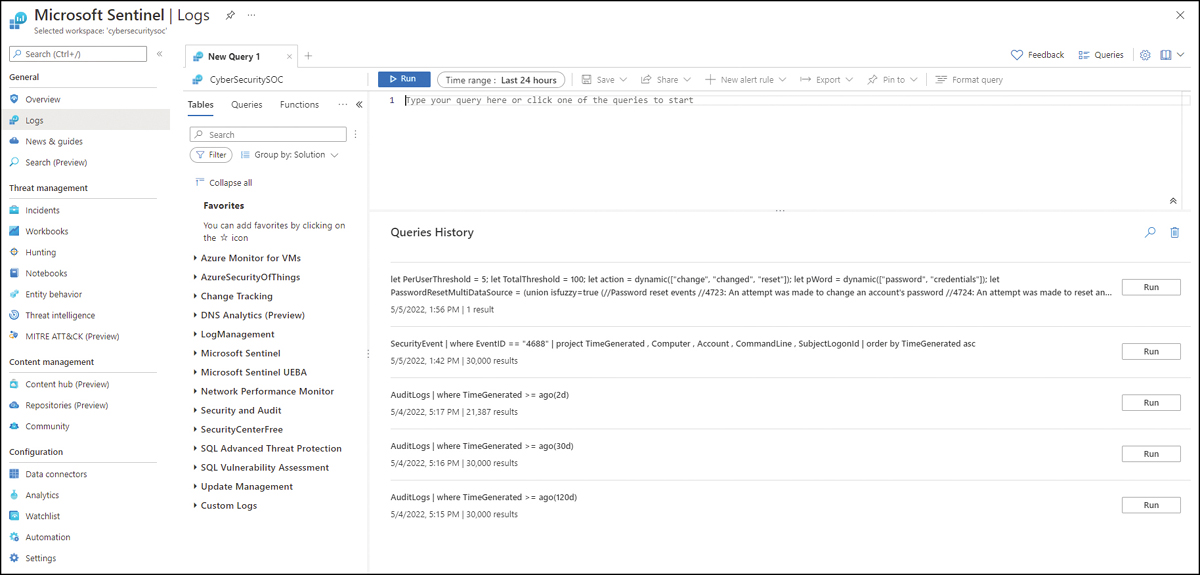
FIGURE 7-7 Microsoft Sentinel logs page
This search page uses Kusto Query Language (KQL) for queries. A Kusto query is a read-only request to process data and return results. The request is stated in plain text, using a data-flow model designed to make the syntax easy to read. The query uses schema entities that are organized in a hierarchy similar to SQL’s: databases, tables, and columns. Figure 8-6 shows the schema that is available for this workspace, which is located under the Tables tab, as shown in Figure 7-7.
You need to start your first query from a specific point of reference. You can use the Defender for Cloud alert about which you are trying to find more information. For this example, you could start a query looking for an alert that contains the "Network communication with a malicious machine detected" string in the description. The query looks similar to this:
SecurityAlert
| where Description contains "Network communication with a malicious machine detected l"
The result will appear in table format at the bottom of the page, as shown in Figure 7-8.
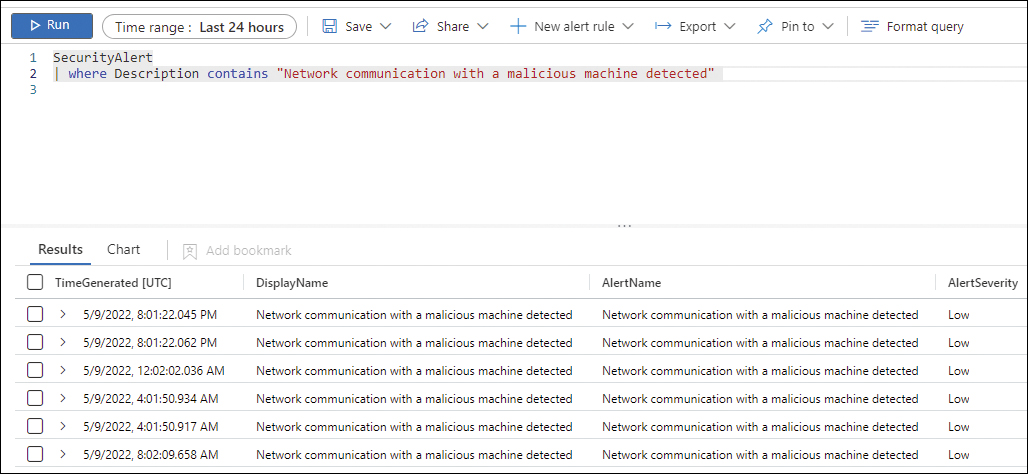
FIGURE 7-8 Query result
Note
If you want some Kusto Query examples, visit the Microsoft Sentinel GitHub page at https://github.com/Azure/Azure-Sentinel.
Defender for Cloud and Microsoft Purview
Microsoft Purview is Microsoft’s data governance service that provides rich insights into the sensitivity of your data in Azure. Microsoft Purview has automated data discovery, sensitive data classification, and end-to-end data lineage, which helps organizations manage and govern data in hybrid and multi-cloud environments.
When you have Microsoft Purview enabled on your Azure subscription, Defender for Cloud will automatically get additional metadata that will add information about any potentially sensitive data involved to alerts and recommendations. This information can be very useful to help triage an alert. For example, if you have two high-severity alerts for two storage accounts, which one should you prioritize for a response? You can use the insights from Microsoft Purview to understand which storage account has more critical data, such as personally identifiable information (PII).
Enabling Microsoft Purview is outside the scope of this book, so the steps below assume that you already have Microsoft Purview enabled on your Azure subscription:
Using the Azure portal, click All Services in the left navigation pane and type Defender for Cloud.
Click the Microsoft Defender For Cloud option.
In the main Overview dashboard, scroll down on the right side until you see the Information Protection tile. If Microsoft Purview is already configured, Defender for Cloud will show some statistics, as shown in Figure 7-9.
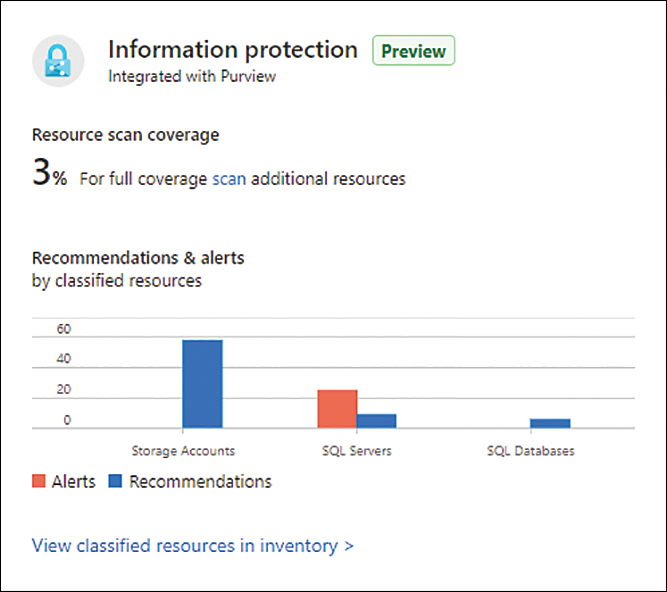
FIGURE 7-9 Information Protection tile
Click this tile, and the Inventory dashboard appears with a filter set for
Data Sensitivity Classification != Unclassified, as shown in Figure 7-10.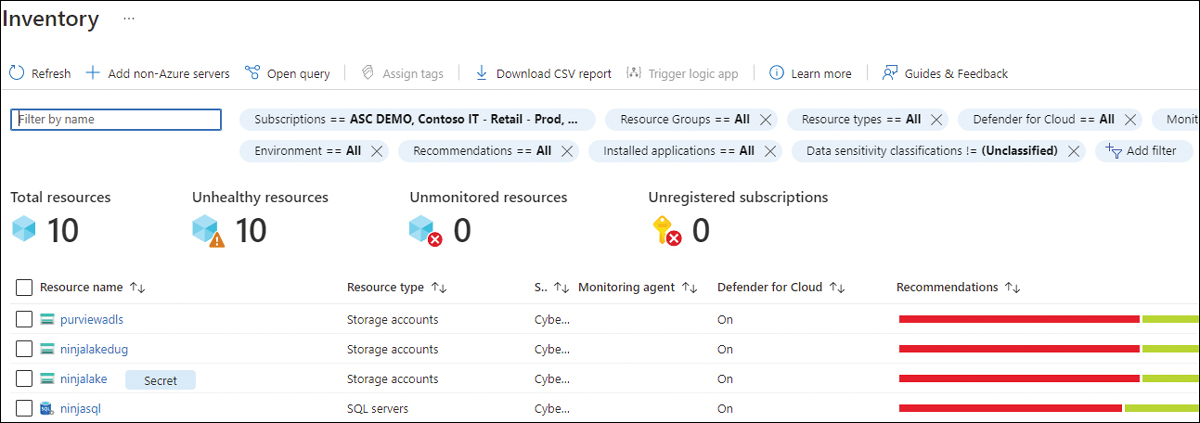
FIGURE 7-10 Inventory dashboard
Click the resource for which you want to see the insights. For this example, this resource will be a storage account, showing the insights in the left navigation pane, as shown in Figure 7-11.
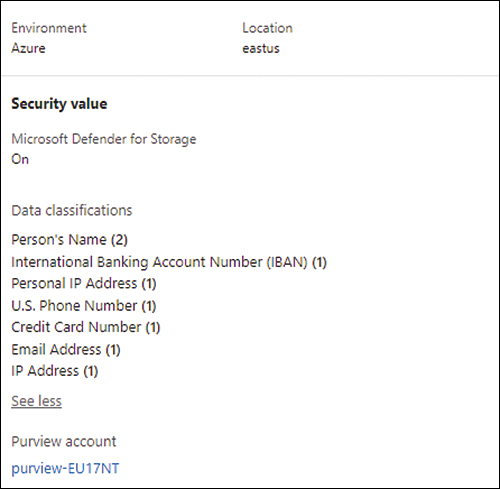
FIGURE 7-11 Resource Health page with Purview insights
On the Resource Health page, you can see the insights, recommendations, and alerts related to that resource. Using the insights from Microsoft Purview, you can prioritize which recommendations should be remediated first, such as deciding which is a proactive action to avoid a bigger problem. For example, you might choose between a threat actor exploiting a storage account that is open to the Internet and prioritizing an alert, which is a reactive action to expedite the proper response for containing the threat.
Defender for Cloud and Microsoft Defender for Endpoint
Microsoft Defender for Cloud integration with Microsoft Defender for Endpoint (MDE) is enabled by default in the subscription on which Defender for Cloud is enabled, but it requires Defender for Server (P1 or P2) to be enabled for this integration to work. With this native integration, you get the benefits of a leading Endpoint Detection and Response (EDR); the auto-deployment to all VMs in Azure, on-premises, or other cloud providers (AWS and GCP); and the synchronization of alerts from MDE to the Defender for Cloud Security Alerts dashboard. This integration supports servers running Windows and Linux operating systems. Figure 7-12 shows an architectural diagram for this integration with Windows Server 2019, Windows Server 2022, and Linux.
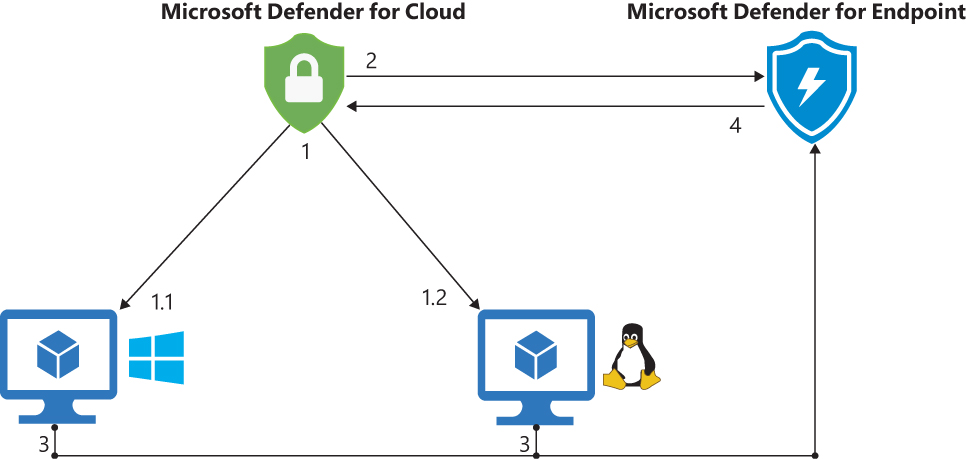
FIGURE 7-12 Architecture diagram for Defender for Cloud and MDE integration
Figure 7-12 shows the following steps:
During the onboarding process, Defender for Cloud runs the onboarding script to provision the MDE extension (
MDE.Windowsfor Windows andMDE.Linuxfor Linux).Defender for Cloud sends this information to the MDE, which extracts the relevant information to ensure these machines are also visible in the MDE Security Center portal and synchronized.
After the onboarding process is finished and MDE is monitoring the machine, MDE will trigger alerts when a suspicious operation occurs and send an alert to the MDE portal first.
These alerts will be synchronized with Defender for Cloud and appear in the Security Alerts dashboard.
Note
Defender for Servers P1 deploys the new MDE solution stack for Windows Server 2012 R2 and 2016, which does not use or require installation of the Log Analytics agent.
The alert generated by MDE gets streamed to Defender for Cloud, and it brings together all the insights you need to perform the initial investigation, as shown in Figure 7-13.
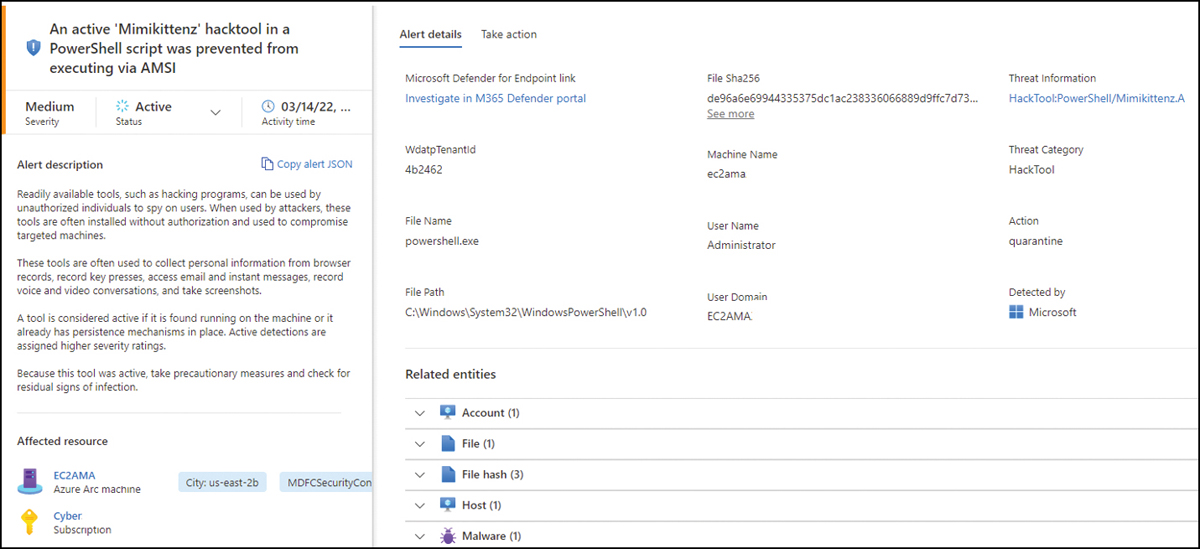
FIGURE 7-13 Security alert triggered by MDE
On the Alert Details tab is the Microsoft Defender For Endpoint link, which allows you to investigate this alert using the MDE Portal (also known as the M365 Defender Portal). This link redirects to https://securitycenter.microsoft.com/alert/<operationID>, which opens the details about the machine that triggered the alert.
The computer name and description are shown in the Affected Resources section. Notice that the icon represents an Azure Arc icon, which means this computer is located either on-premises or in another cloud provider (AWS or GCP). Azure Arc is a prerequisite for MDE integration to work on non-Azure machines. In other words, you need to onboard Azure Arc first, and then the MDE extension will be deployed.
If you need to disable this integration for some reason—for example, if you already have an EDR solution installed on your servers and don’t need MDE—then you should deselect the Allow Microsoft Defender for Endpoint To Access My Data checkbox in the Integrations section, as shown in Figure 7-14.
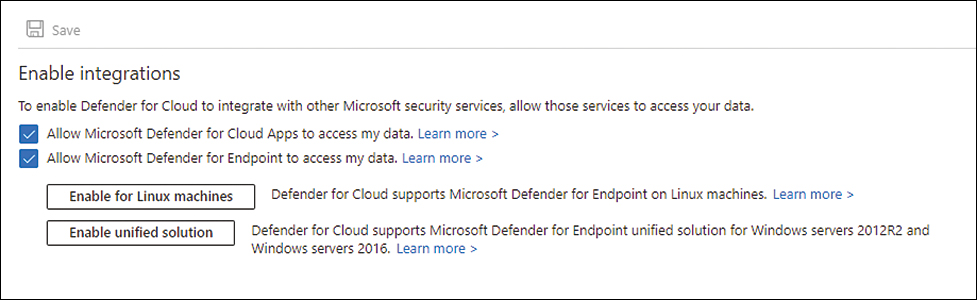
FIGURE 7-14 MDE in Defender for Cloud setting
Also on the Integrations page is the Enable For Linux Machines button. If you’ve already enabled the MDE integration for Windows (before summer 2021), you just need to click the Enable For Linux Machines button to trigger the deployment of MDE for Linux on all existing machines belonging to the subscription and all new machines provisioned in this subscription.
Also, if you’ve never selected the Allow Microsoft Defender For Endpoint To Access My Data option for Windows, when you enable it for the first time and save the changes, Defender for Cloud will automatically deploy MDE for all existing and new Windows and Linux machines.
Before June 2022, the MDE integration automatically included the installation of the new MDE unified solution for machines for Defender for Servers Plan 1 and multicloud connectors with the Defender for Servers Plan 2. Plan 2 for Azure subscriptions enabled the unified solution for Linux machines and Windows 2019 and 2022 servers only. Windows Servers 2012R2 and 2016 used the MDE legacy solution, which was dependent on the Log Analytics agent.
Figure 7-14 shows an example of the Integrations page after the June 2022 update, which includes the button Enable Unified Solution option. With this addition, Defender for Servers now supports the unified solution for all machines in both Azure subscriptions and multicloud connectors.