
Appendix
Define Excel tables
With Excel, you’ve always been able to manage lists of data effectively, so that you can sort your worksheet data based on the values in one or more columns, limit the data displayed by using criteria (for example, show only routes with fewer than 100 stops), and create formulas that summarize the values in visible (that is, unfiltered) cells. Excel 2019 provides those capabilities, and more, through Excel tables.
Manage data by using an Excel table
![]() Tip
Tip
Sorting, filtering, and summarizing data are all covered elsewhere in this book.
Excel can also create an Excel table from an existing cell range, as long as the range has no blank rows or columns within the data and there is no extraneous data in cells immediately below or next to the list. If your existing data has formatting applied to it, that formatting remains applied to those cells when you create the Excel table, but you can have Excel replace the existing formatting with the Excel table’s formatting.
![]() Tip
Tip
To create an Excel table by using a keyboard shortcut, press Ctrl+L, specify the range that contains the data, and then select OK.
Entering values into a cell below or to the right of an Excel table adds a row or column to the table. After you enter the value and move out of the cell, the AutoCorrect Options button appears. If you didn’t mean to include the data in the Excel table, you can select Undo Table AutoExpansion to exclude the cells from the Excel table. If you never want Excel to include adjacent data in an Excel table again, select Stop Automatically Expanding Tables.
![]() Tip
Tip
To stop Table AutoExpansion before it starts, select Options in the Backstage view. In the Excel Options dialog box, select Proofing, and then select the AutoCorrect Options button to open the AutoCorrect dialog box. Select the AutoFormat As You Type tab, clear the Include New Rows and Columns in Table check box, and then select OK twice.
You can resize an Excel table manually by using your mouse. If your Excel table’s headers contain a recognizable series of values (such as Region1, Region2, and Region3), and you drag the resize handle to create a fourth column, Excel creates the column with a label that is the next value in the series—in this example, Region4.
Excel tables often contain data you can summarize by calculating a sum or average, or by finding the maximum or minimum value in a column. To summarize one or more columns of data, you can add a Total row to your Excel table.

An Excel table with a Total row 518
When you add the Total row, Excel creates a formula that summarizes the values in the rightmost Excel table column. You can change the summary function by picking a new one from the partial list displayed in the Excel table or by selecting a function from the full set.
Much as it does when you create a new worksheet, Excel gives your Excel tables generic names such as Table1 and Table2. You can change an Excel table’s name to something easier to recognize in your formulas. Changing an Excel table name might not seem important, but it helps make formulas that summarize Excel table data much easier to understand. You should make a habit of renaming your Excel tables so you can recognize the data they contain.
If for any reason you want to convert your Excel table back to a normal range of cells, you can do so quickly.
To create an Excel table
Select a cell in the list of data you want to make into an Excel table.
On the Home tab, in the Styles group, select Format as Table.
In the gallery that appears, select the style you want to apply to the table.
In the Format As Table dialog box, verify that the cell range is correct.
If necessary, select or clear the My table has headers check box, and then select OK.
To create an Excel table with default formatting
Select a cell in the range that you want to make into an Excel table.
Press Ctrl+L.
In the Format As Table dialog box, verify that the cell range is correct.
Select OK.
To add a column or row to an Excel table
Select a cell in the row below or the column to the right of the Excel table.
Enter the desired data and press Enter.
To expand or contract an Excel table
Select any cell in the Excel table.
Point to the lower-right corner of the Excel table.
When the mouse pointer changes to a diagonal arrow, drag the Excel table’s outline to redefine the table.
To add a Total row to an Excel table
Select any cell in the Excel table.
On the Design tool tab in the ribbon, in the Table Style Options group, select the Total Row check box.
To change the calculation used in a Total row cell
Select any Total row cell that contains a calculation.
Click or tap the cell’s arrow.
Select a summary function.
Or
Select More Functions, use the Insert Function dialog box to create the formula, and select OK.
![]() SEE ALSO
SEE ALSO
For more information about using the Insert Function dialog box and about referring to tables in formulas, see “Create formulas to calculate values” in Chapter 6, “Perform calculations on data.”
To rename an Excel table
Select any cell in the Excel table.
On the Design tool tab, in the Properties group, enter a new name for the Excel table in the Table Name box.
Press Enter.
To convert an Excel table to a cell range
Select any cell in the Excel table.
On the Design tool tab, in the Tools group, select Convert to Range.
In the confirmation dialog box that appears, select Yes.
Practice tasks

The practice files for these tasks are located in the Office2019SBSAppendix folder. You can save the results of the tasks in the same folder.
The introduction includes a complete list of practice files and download instructions.
Define Excel tables
Open the CreateExcelTables workbook in Excel, and then perform the following tasks:
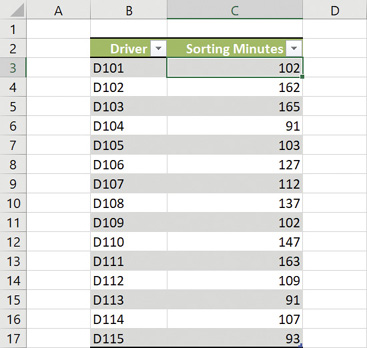
Create an Excel table from the list of data on the Sort Times worksheet.
Add a row of data to the Excel table for driver D116 and assign a value of 100 sorting minutes.
Add a Total row to the Excel table, and then change the summary function to Average.
Rename the Excel table to SortTimes.