Chapter 2
Introduction to Microsoft Sentinel
Given the threat landscape presented in Chapter 1, there is a clear need for a system that can collect data from different sources, perform data correlation, and present this data in a single dashboard.
Microsoft Sentinel delivers intelligent security analytics and threat intelligence across the enterprise, providing a single solution for alert detection, threat visibility, proactive hunting, and threat response. Microsoft Sentinel natively incorporates proven foundation services from Azure, such as Log Analytics and Logic Apps. Also, Microsoft Sentinel enriches your investigation and detection with Artificial Intelligence (AI) in conjunction with Microsoft’s threat intelligence stream.
In this chapter, you will learn more about the architecture, design considerations, and initial configuration of Microsoft Sentinel.
Architecture
Because Microsoft Sentinel is part of Azure, the first prerequisite to deployment is to have an active Azure subscription. As with any other security information and event management (SIEM), Microsoft Sentinel needs to store the data that it will collect from the different data sources that you configure. Microsoft Sentinel will store this data in your preferred Log Analytics workspace. Depending on your business needs and technology requirements, you can create a new workspace or use an existing one.
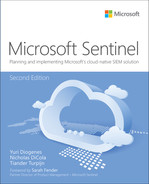
To help you to better understand Microsoft Sentinel’s architecture, you must first understand the different components of the solution. Figure 2-1 shows a diagram of the major Microsoft Sentinel components.
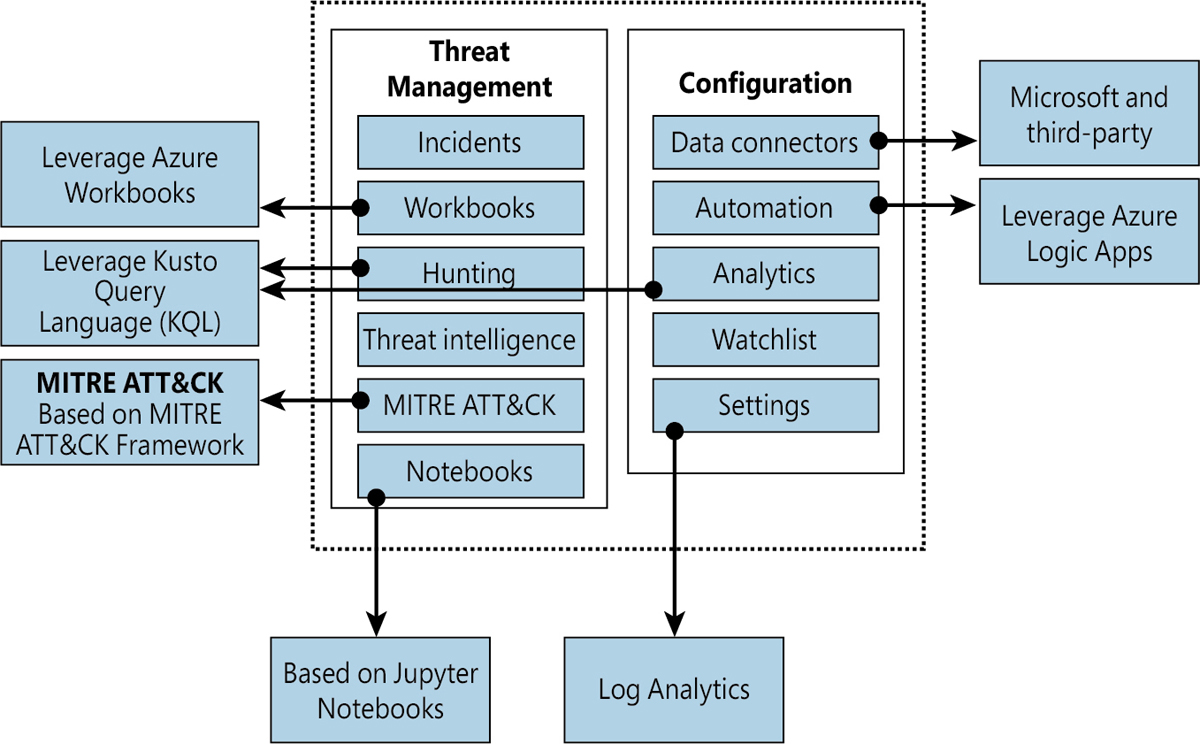
FIGURE 2-1 Major components of Azure Sentinel
The components shown in Figure 2-1 are presented in more detail below:
Incidents This is a centralized place to manage your security incidents. An incident will have relevant data that you can use to understand its impact. You will learn more about incidents in Chapter 4, “Incident management.”
Workbooks Built-in dashboards based on Azure Workbook that provide data visualization for your connected data sources. These Workbooks enable you to deep dive into the events generated by those services. You will learn more about Workbooks in Chapter 8, “Data visualization.”
Hunting This is a powerful tool for investigators and security analysts who need to proactively look for security threats. The searching capability is powered by Kusto Query Language (KQL). You will learn more about hunting in Chapter 5, “Hunting.”
Threat Intelligence Cyber threat intelligence (CTI) is an important capability leveraged by defenders to better understand the behavior of threat actors. This option allows Tier 2 and Tier 3 SOC analysts to curate their CTI within Microsoft Sentinel by tagging existing data. You will learn more about threat intelligence in Chapter 5, “Hunting.”
MITRE ATT&CK This page contains active scheduled queries and near-real-time (NRT) rules coverage according to the MITRE ATT&CK framework. You will learn more about MITRE ATT&CK in Chapter 5, “Hunting.”
Notebooks By integrating with Jupyter notebooks, Microsoft Sentinel extends the scope of what you can do with the collected data. The notebooks feature combines full programmability with a collection of libraries for machine learning, visualization, and data analysis. You will learn more about notebooks in Chapter 6, “Notebooks.”
Data Connectors Built-in connectors are available to facilitate data ingestion from Microsoft and partner solutions. You will learn more about data connectors later in this chapter.
Automations A collection of procedures that can be automatically executed when an alert is triggered by Microsoft Sentinel by leveraging Azure Logic Apps. This will help you to automate and orchestrate tasks/workflows. You will learn more about Playbooks in Chapter 7, “Automating response with Playbooks.”
Analytics Analytics enable you to create custom alerts using Kusto Query Language (KQL). You will learn more about analytics in Chapter 3, “Analytics.”
Watchlist This list allows you to correlate data from a data source you provide with the events in your Microsoft Sentinel environment. You will learn more about analytics in Chapter 3, “Analytics.”
Settings This section has a variety of configuration options, including the Log Analytics workspace. Microsoft Sentinel uses this workspace to store the data you collect from the different data sources. You will learn more about workspace configuration later in this chapter.
Roles and permissions
Microsoft Sentinel uses Azure role-based access control (Azure RBAC), which provides a set of pre-defined privileges to perform certain actions in the environment. These built-in roles can be assigned to users, groups, and services in Azure.
Microsoft Sentinel also adds its own roles to Azure that were designed to perform specific actions based on a scenario. All Microsoft Sentinel built-in roles grant read access to the data in your Microsoft Sentinel workspace. The Microsoft Sentinel built-in roles are:
Microsoft Sentinel Reader View data, incidents, Workbooks, and other Microsoft Sentinel resources.
Microsoft Sentinel Responder In addition to the actions enabled by Microsoft Sentinel Reader, it can also manage incidents (assign, dismiss, and so on).
Microsoft Sentinel Contributor In addition to the actions enabled by Microsoft Sentinel Responder, it can also create and edit Workbooks, analytics rules, and other Microsoft Sentinel resources.
Microsoft Sentinel Automation Contributor Allows adding Playbooks to automation rules. This is not a role that is meant to be used by user accounts.
Because many other scenarios are enabled by Microsoft Sentinel, you may need to use additional roles according to a given need. Use Table 2-1 as a reference for these scenarios:
TABLE 2-1 Microsoft Sentinel scenarios
SCENARIO | CONSIDERATIONS |
|---|---|
Automate responses to threats by leveraging Playbook capability | The Playbook capability in Microsoft Sentinel uses Logic Apps; in this case, you might need to add members of the team who are responsible for creating automated responses to the Logic App Contributor role. |
Connecting Microsoft Sentinel to an external data source | Regardless of the data connector source, the users responsible for creating connectors will need to have write permissions on the Microsoft Sentinel workspace. |
Temporary employee or guest assigning incidents | There might be scenarios where you will need to have temporary personnel in charge of triaging incidents and assigning them to the right team. In this case, in addition to assigning the user to the Microsoft Sentinel Responder role, you will also need to assign them to the Directory Reader role. |
Manipulating Workbooks | You might have a user who works with data visualization and oversees creating and deleting Workbooks in Microsoft Sentinel. In this case, you can either add this user to the Microsoft Sentinel Contributor role or the Microsoft Sentinel role with less privilege and add them to the Azure Monitor Workbook Contributor role. |
Be mindful of role aggregation scenarios in which a user has been assigned to a higher Azure role and a stricter Microsoft Sentinel role, which means the user will still be able to perform stricter operations. If you want to harden your user’s permissions to reflect their operation only in Microsoft Sentinel, you should carefully remove this user’s prior permissions, making sure you do not break any needed access to another resource. Figure 2-2 shows an example of how to organize your users according to their roles and Azure resources.
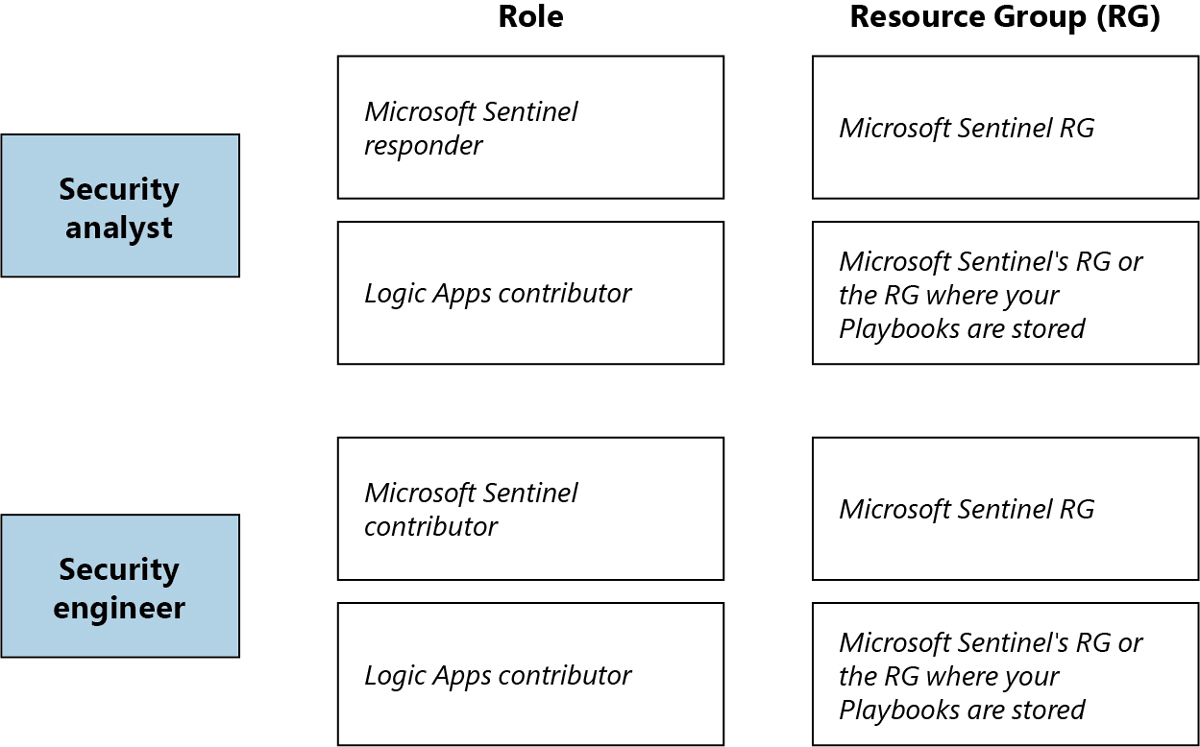
FIGURE 2-2 Role-based access control for different users
Workspace design considerations
Log Analytics workspace is the core foundation of Microsoft Sentinel. Later in this chapter, you will see that the first step to enabling Microsoft Sentinel is to select the workspace. A Log Analytics workspace provides a geographic location for data storage and data isolation by granting access rights to different users if necessary, as well as a set of configuration options.
One best practice is to always reduce the number of workspaces in use, but there are some specific scenarios that will lead you to have more than one workspace. The most common ones are listed below:
Data sovereignty requirements and regulatory compliance standards that the company needs to abide by
Data ownership requirements created by different company boundaries, such as subsidiaries and headquarters
Companies that have multiple Azure Active Directory tenants
Companies may need to use chargeback and have a more granular control over the Azure bill
Companies that need more granular access control
Companies that have different retention policies per subsidiary
A company is a Managed Security Service Provider (MSSP)
Keep in mind that you will first need to deploy Azure Lighthouse to provide visibility across tenants for a multi-tenant scenario. If your design process leads you to conclude that you must have multiple workspaces, Microsoft Sentinel allows you to see incidents on multiple workspaces, which facilitates central incident monitoring and management across multiple workspaces. The advantage of this centralized view is that you can manage incidents directly and see incident details seamlessly in the context of the originating workspace.
Microsoft Sentinel also supports querying multiple workspaces. This is done in a centralized view and a single query, which allows you to search and correlate data from multiple workspaces in a single place and in one single query. The list below provides the other Microsoft Sentinel features that support this cross-workspace ability:
Analytics rules
Workbooks
Hunting
Important
You can have up to 30 cross-workspace analytics rules, while you can view up to 100 cross-workspace incidents (in preview). Keep in mind that querying multiple workspaces in the same query might affect performance.
The data connector is what will send data to the workspace and is another important consideration when designing your workspace architecture. Connectors that are based on diagnostics settings (such as Azure Firewall, Azure Storage, Azure Activity, or Azure Active Directory) cannot be connected to workspaces that are not located in the same tenant as the source workspace. For additional considerations related to multiple workspaces, check the decision tree in this article, http://aka.ms/SentinelLAWDecisionTree, and the sample templates at http://aka.ms/SentinelLAWTemplates.
While Microsoft Sentinel can be utilized for multiple regions, your design requirements might require you to adopt one workspace per region. This can happen for numerous reasons, including regulations and data separation by team. For this type of scenario, you need to consider that egress costs apply when the Log Analytics or Azure Monitor agent is required to collect logs (for example, a VM). You also need to consider the bandwidth costs, which vary depending on the following factors: source and destination region and collection method.
While there are scenarios that will require you to have multiple workspaces, you may also find scenarios where the same workspace will be shared by Microsoft Sentinel and Microsoft Defender for Cloud. For best practices on how to design your solution for this requirement, see http://aka.ms/LAWBPD4CSentinel.
Hardening considerations
To improve the security hygiene of your Microsoft Sentinel and its Azure environment, it is recommended that you use the security baseline provided by Azure Security Benchmark. This benchmark provides security recommendations for the following areas:
Network security
Identity management
Privilege access
Data protection
Asset management
Logging and threat detection
Posture and vulnerability management
Backup and recovery
Additional considerations
Before enabling Microsoft Sentinel, you should have a good understanding of which data sources you will use to connect with Microsoft Sentinel. If you are unsure, you can always start with the free data connectors, which are: Azure Activity Logs, Office 365 Audit Logs, including all SharePoint activity, Exchange admin activity, and Teams, Security alerts (including alerts from Microsoft Defender for Cloud, Microsoft 365 Defender, Microsoft Defender for Office 365, Microsoft Defender for Identity, Microsoft Defender for Endpoint), Microsoft Defender for Cloud and Microsoft Defender for Cloud Apps alerts.
Another important consideration during this design exercise is to identify if you will need to have a partner or custom connector. This will require you to configure Syslog and CEF connectors with the highest priority first.
Once you finish defining the use cases, data sources, and data size requirements, start planning your budget, considering cost implications for each planned scenario. Make sure to include in your budget the cost of data ingestion for both Microsoft Sentinel and Azure Log Analytics and any Playbooks that will be deployed.
Important
For the latest information on Microsoft Sentinel pricing, visit https://azure.microsoft.com/en-us/pricing/details/microsoft-sentinel.
Enabling Microsoft Sentinel
Now that you have finished planning your Microsoft Sentinel adoption, it is time to enable the service. Remember that you need an active Azure subscription before enabling Microsoft Sentinel. Follow the steps below to enable Microsoft Sentinel in your subscription:
Open the Azure portal and sign in with a user who has contributor permissions on the subscription and in the resource group where the workspace resides.
In the search bar, type Sentinel and click the Microsoft Sentinel; the Microsoft Sentinel blade appears, as shown in Figure 2-3.
FIGURE 2-3 Microsoft Sentinel initial page
Click the Create Microsoft Sentinel button. Because there is no workspace selected, a page similar to Figure 2-4 appears.
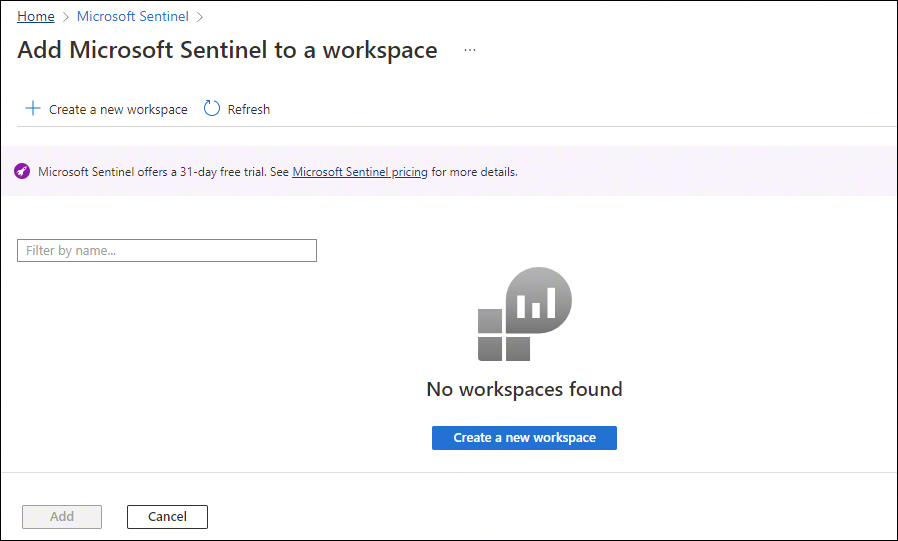
FIGURE 2-4 No workspaces available
Click the Create A New Workspace button.
You will be redirected to the Create Log Analytics Workspace page, as shown in Figure 2-5.
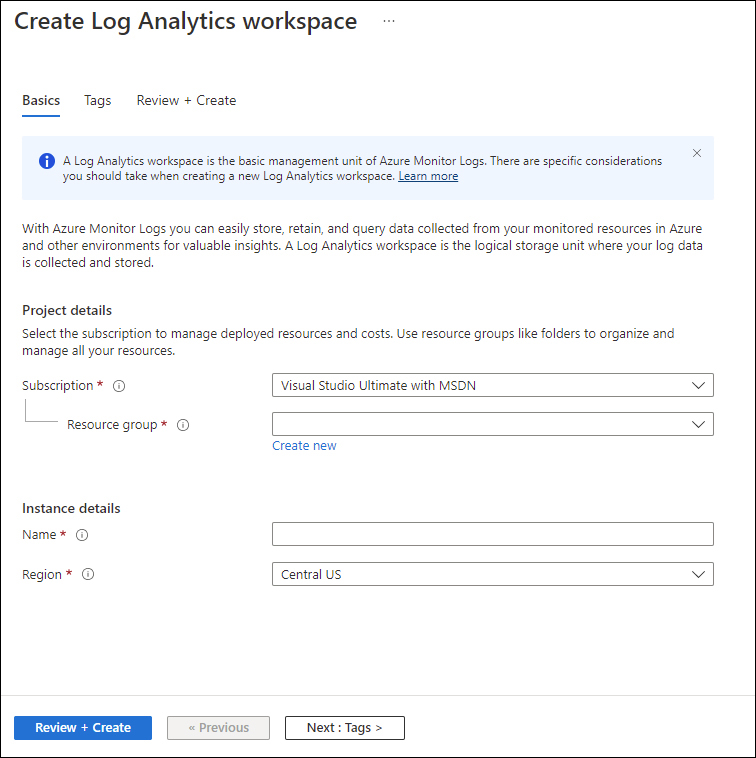
FIGURE 2-5 Create Log Analytics Workspace
Follow the steps on the screen to create a new workspace using the default selections. When you finish filling those options, click the Review + Create button.
Once you see a green check mark indicating that the validation has passed, you can click the Create button to conclude.
You will be redirected to the Add Microsoft Sentinel To A Workspace page. If the screen doesn’t refresh, click the Refresh button, and you should see the workspace and the Add button. Click the Add button to continue. Because this is the first time you have used Microsoft Sentinel in this brand-new workspace, you will receive a notification similar to the one shown in Figure 2-6. (Be mindful that the date range will change according to the date you created your workspace.)
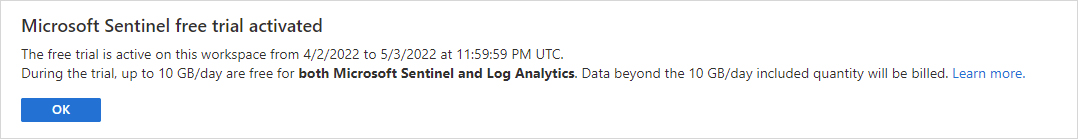
FIGURE 2-6 Trial activation notification
Click the OK button to continue, and you will see the Microsoft Sentinel News & Guides page, as shown in Figure 2-7.
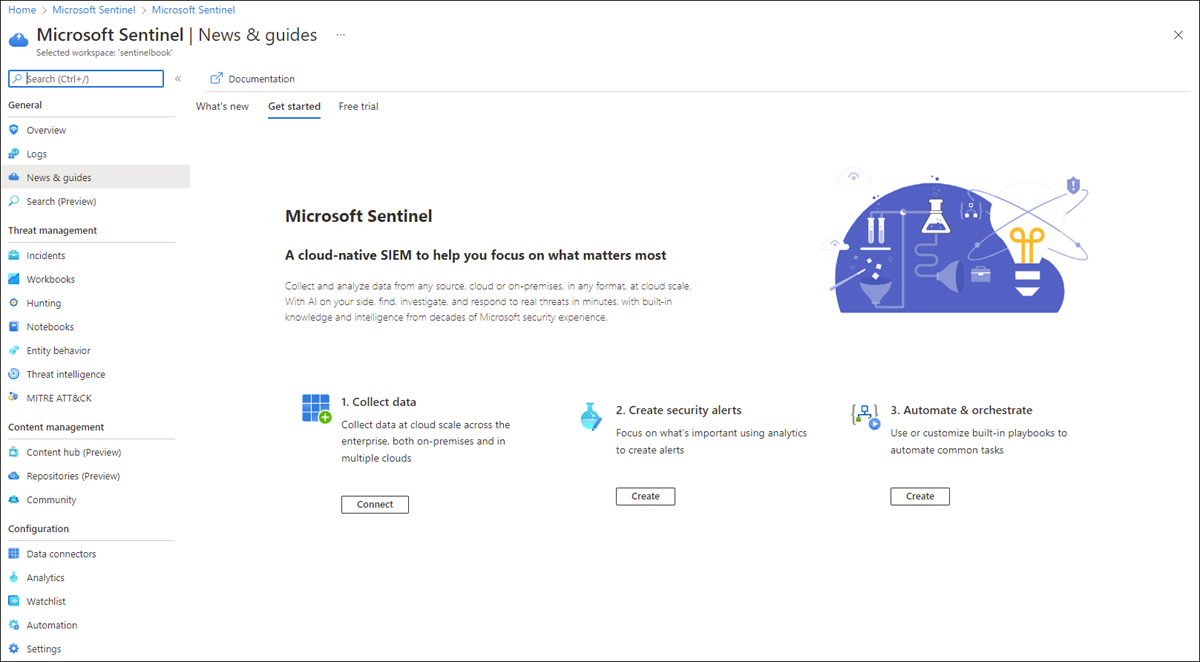
FIGURE 2-7 Microsoft Sentinel News & Guides page
At this point, you have a workspace, and Microsoft Sentinel is enabled on it. Next, you need to start ingesting data, and as mentioned before, you can start by ingesting data from the free connectors.
Ingesting data from Microsoft solutions
One way to quickly start validating Microsoft Sentinel’s data ingestion is to start the configuration by using Microsoft built-in connectors. Each data connector will have its own set of prerequisites, including the type of license for the service from which you are trying to ingest data.
Start with the Azure Activity Log to visualize data from the subscription-level events that have occurred in Azure, which includes data ranging from Azure Resource Manager (ARM) operational data to updates on service health events. Follow the steps below to connect with the Azure Activity Log:
In the Microsoft Sentinel dashboard, click Data Connectors in the left navigation pane under the Configuration section. The Data Connectors page appears, as shown in Figure 2-8.
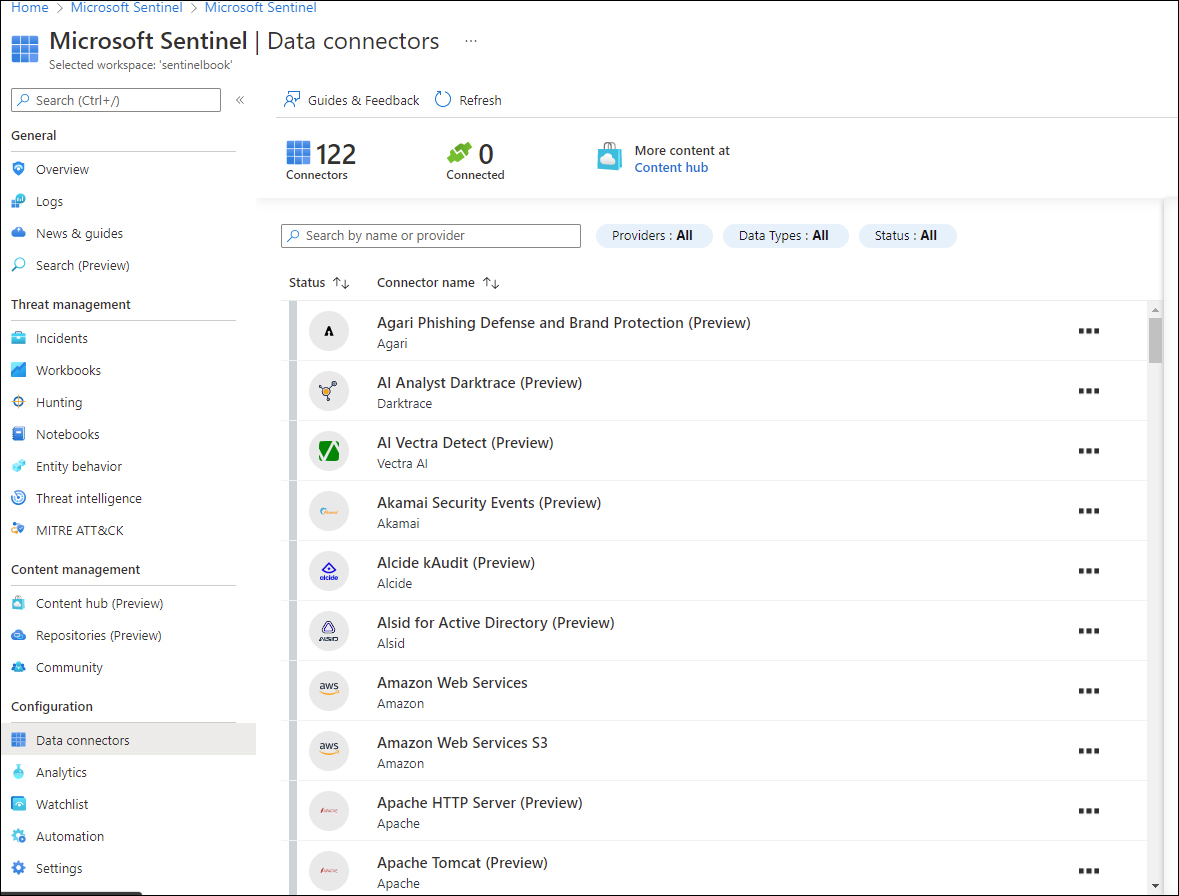
FIGURE 2-8 Data Connectors
In the search bar, type Azure Activity.
Click Azure Activity, and the Azure Activity blade appears on the right side, as shown in Figure 2-9.

FIGURE 2-9 Azure Activity blade
Click the Open Connector Page button, and on the Instructions tab, click the Launch Azure Policy Assignment Wizard button. The Configure Azure Activity Logs To Stream To Specified Log Analytics Workspace page appears, as shown in Figure 2-10.
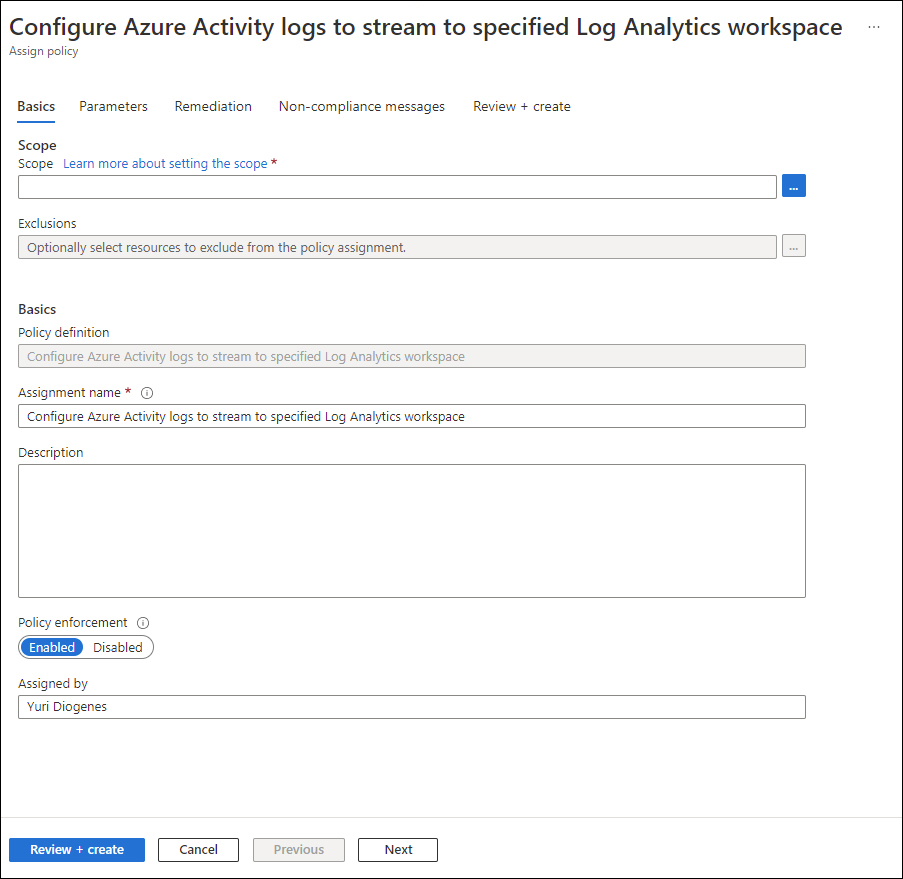
FIGURE 2-10 Enabling Azure Activity logs via Azure Policy
Under Scope, select the subscription, leave the other settings as is, and select the Parameters tab. On this tab, you will select the workspace that you created earlier.
Click the Remediation tab and select the Create A Remediation Task checkbox and leave the other options as is.
Click the Review + Create button, and then click Create to conclude.
Because this setting is deployed via Azure Policy, it may take several minutes to update the screen. You can close the connector’s page and return to the main Microsoft Sentinel dashboard.
Connecting Microsoft Defender for Cloud
If you have Microsoft Defender for Cloud enabled in your subscription, you can start ingesting the Security Alerts generated by Defender for Cloud, which provides a rich set of threat detections.
Defender for Cloud will generate alerts according to the enabled plans. Follow the steps below to connect to Defender for Cloud and start streaming security alerts to Microsoft Sentinel:
In the Microsoft Sentinel dashboard, in the left navigation pane, click Data Connectors in the Configuration section.
In the search bar, type Defender for Cloud, click the Microsoft Defender for Cloud option, and the Microsoft Defender for Cloud blade appears on the right side. In this blade, click the Open Connector Page button, and the Instructions tab appears selected, as shown in Figure 2-11.
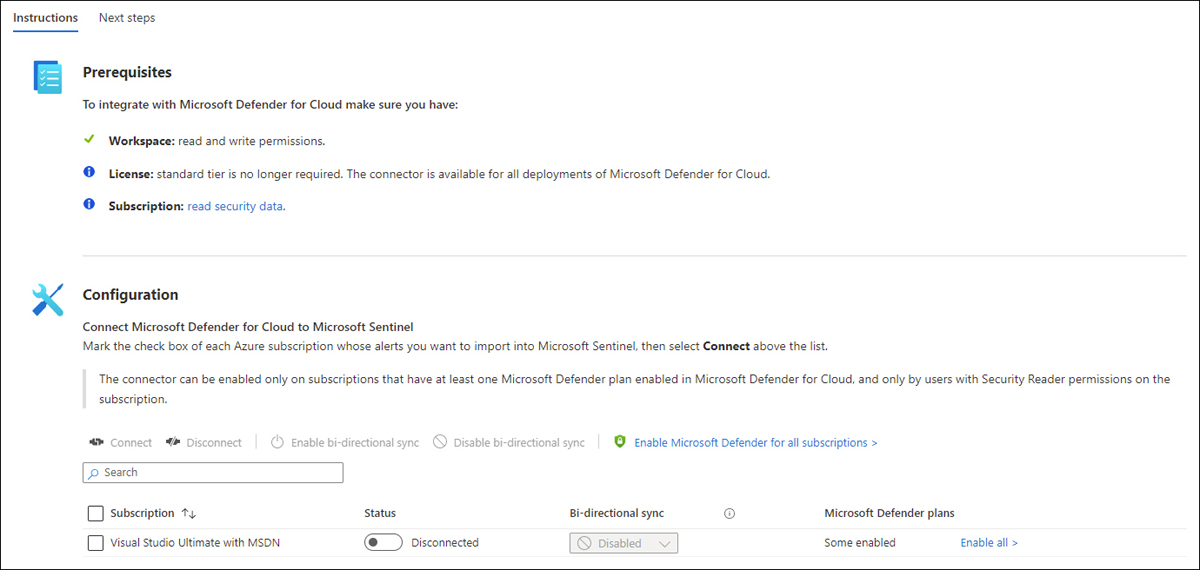
FIGURE 2-11 Enabling the Microsoft Defender for Cloud connector
In the Configuration section, select the Subscription, and in the Status column, click the Status toggle to Connected.
By default, Bi-Directional Sync is enabled. Leave this as-is to allow Microsoft Sentinel and Defender for Cloud to be in sync regarding the alert’s status.
On the same page, scroll down and you will also see the Enable button under Create Incidents–Recommended! section, as shown in Figure 2-12.
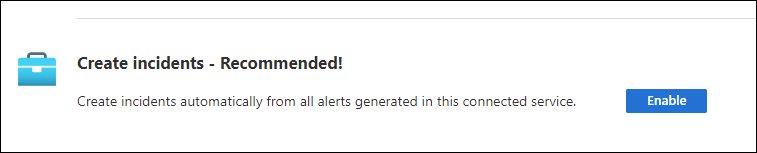
FIGURE 2-12 Option to create incidents automatically
The advantage of using this option is that the alerts arriving from Defender for Cloud will be surfaced in Microsoft Sentinel as incidents. Click the Enable button to commit this change. A quick validation will be done, and the Enable button becomes unavailable.
Close the page and return to the main Data Connectors page.
After some time, you will be able to refresh the connector, and you will see that the status has changed to Connected, as shown in Figure 2-13.
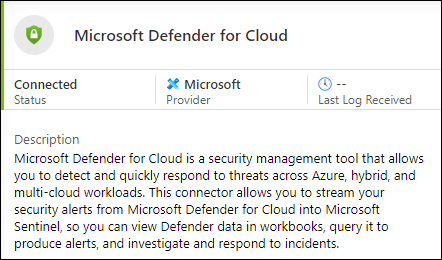
FIGURE 2-13 Defender for Cloud Status changes to Connected
Connecting to Azure Active Directory
Azure Active Directory (Azure AD) is the identity and access-management service in the cloud. Each Azure tenant has a dedicated and trusted Azure AD directory. The Azure AD directory includes the tenant’s users, groups, and apps, and it is used to perform identity and access-management functions for tenant resources. If you want to export sign-in data from Active Directory to Azure Sentinel, you must have an Azure AD P1 or P2 license.
The initial steps to configure Azure Activity Directory connector are the same as any other connector. The only difference is the page that opens up once you access the connector’s page. For Azure Active Directory, you will see a page similar to Figure 2-14.
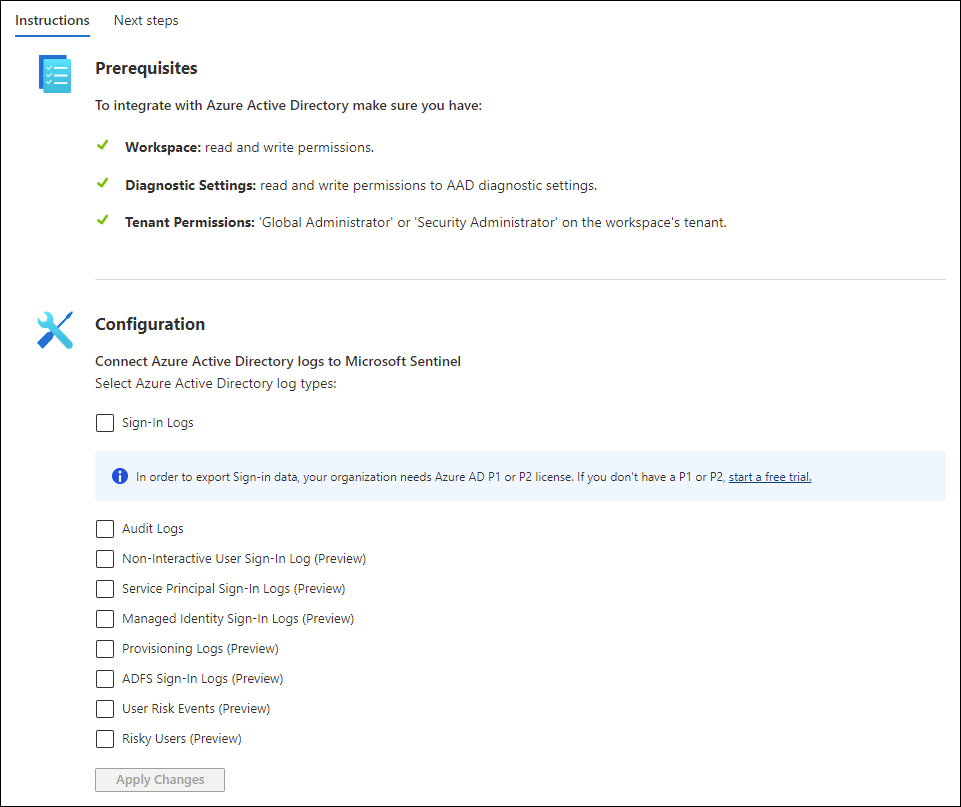
FIGURE 2-14 Azure Active Directory Connector page
This connector allows the stream of sign-in logs containing information about interactive user sign-ins where a user provides an authentication factor. At the time of publication, there were also a series of additional logs in preview, including:
Non-interactive user sign-in logs
Service principal sign-in logs
Managed Identity sign-in logs
Audit logs
Provisioning logs
After you finish making your selection, click the Apply Changes button to commit these changes.
Accessing ingested data
After connecting with the data sources that you need, you can start validating the connection flow to ensure the data is being saved in the workspace. To perform this validation, you have two options:
You can open the connector’s page and click the Next Steps tab. There, you will find some sample queries that you can use.
You can also access the workspace directly from Microsoft Sentinel and perform some free queries using Kusto Query Language (KQL).
A Kusto query is a read-only request to process data and return results. The request is stated in plain text, using a data-flow model designed to make the syntax easy to read, author, and automate. The query uses schema entities that are organized in a hierarchy similar to SQL’s databases, tables, and columns. You will learn more about this language in Appendix A, “Introduction to Kusto Query Language.”
Follow these steps to access the workspace from Azure Sentinel and perform the validation for Azure Activity Log, which was the first data source that you connected in this chapter:
In the Microsoft Sentinel dashboard, click Logs in the left navigation pane under the General section.
If this is the first time you are accessing this option, the Welcome To Log Analytics page appears. Close this welcome page and close the sample queries page.
On the Logs page, type AzureActivity and click the Run button. You should see all activities that were performed and collected in the last 24 hours (which is the default timeframe). The result should look similar to Figure 2-15.
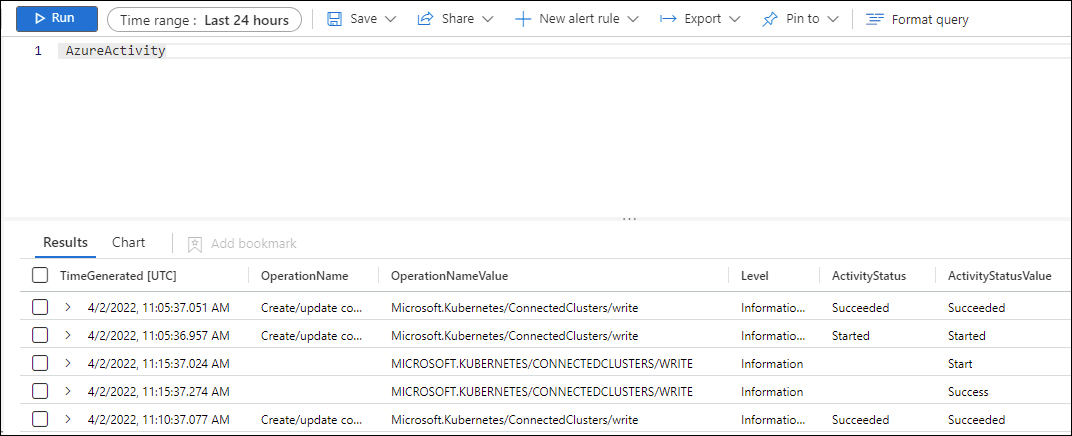
FIGURE 2-15 Last 24 hours of activities
As you can see, the logs are flowing, and you can obtain all results with a single query. However, in a real scenario, you want to narrow the results. An easy way to learn KQL while performing queries is to leverage the context-sensitive IntelliSense capability. To do that, write the query, and IntelliSense will open a dropdown menu showing the available options, as shown in Figure 2-16.
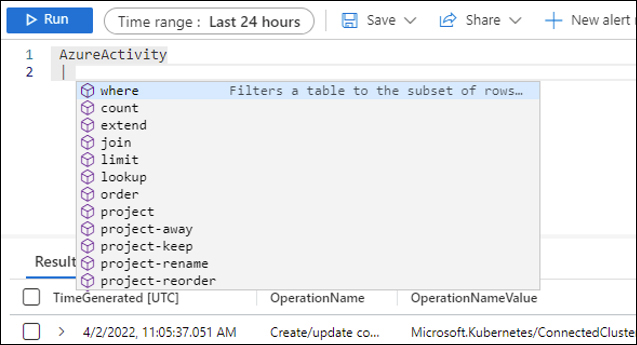
FIGURE 2-16 IntelliSense suggestions
To narrow the search to look only for activities that are related to the operation, you can use OperationName. For example, if you are trying to identify who deleted a VM, you can type the query below and click Run.
AzureActivity
| where OperationName contains “Create or Update Virtual Machine”
The results will be narrowed to show only activities that contain the specified string, which will make it easier to investigate. A sample result is shown in Figure 2-17.
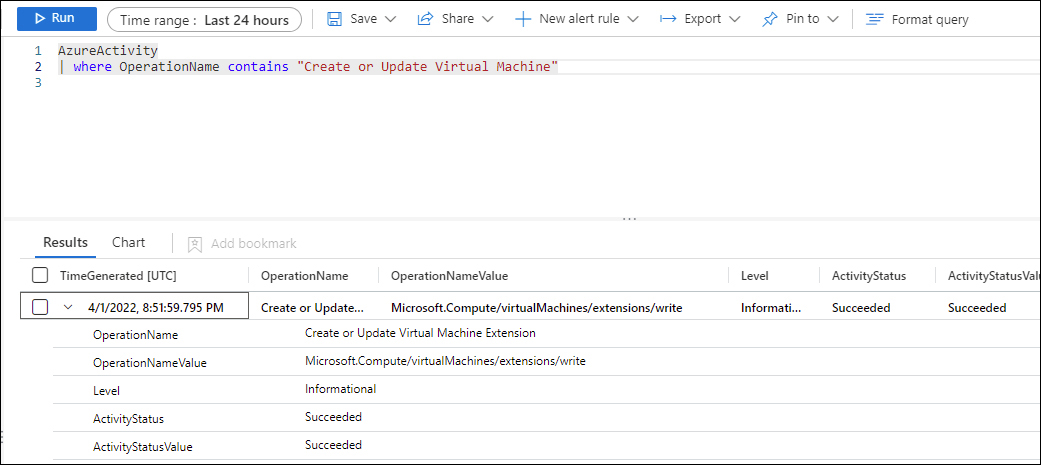
FIGURE 2-17 Customizing your query
To validate the other data sources that were ingested in this chapter, you can use the following sample queries:
Azure Active Directory
Query:
SigninLogs(Use this query to visualize all Azure AD sign-in logs.)
Query:
AuditLogs(Use this query to visualize all Azure AD audit logs.)
Microsoft Defender for Cloud
Query:
SecurityAlert | where AlertName contains “suspicious”(This query will list all alerts generated by Defender for Cloud where the alert name contains the keyword
“suspicious”.)
As you validate each connector, make sure to continue to explore other queries to obtain more precise information. While the goal of this chapter is not to dive into details about queries, you will need to continue expanding your KQL skills to use later in this book.