Chapter 9
Data connectors
A key requirement for every SIEM is the capability to ingest and process massive amounts of data from various sources—data to analyze, data to run detections on, data to hunt for indicators of compromise, and more. As a cloud-born SIEM, one of Microsoft Sentinel’s strengths is to handle terabytes of data with ease, without any scaling or sizing issues for you to worry about. Data can be ingested in several ways, such as by leveraging the following:
Data connectors, including service-to-service connections
Rest API endpoints
Agents, including forwarders and plug-ins, like the output plug-in for Logstash
Data connectors are Microsoft Sentinel’s primary tool for ingesting and processing data and should be your first option for data ingestion. This chapter focuses on data connectors and solutions that package content in a single offering.
Understanding data connectors
Microsoft Sentinel comes with many out-of-the-box data connectors, the majority of which can be enabled and configured with a couple of clicks. A key aspect of a data connector is that the data is normalized and comes with content like detection rules, queries, and, optionally, Workbooks.
Note
Normalization is the process of transforming data collected from various sources into a uniform presentation as defined by a standardized schema.
Follow the steps below to see a full list of out-of-the-box connectors:
Open the Azure portal and sign in as a user who has Microsoft Sentinel Reader privileges.
Navigate to the Microsoft Sentinel page.
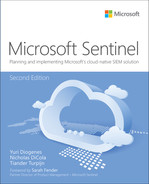
Under Configuration, click Data Connectors. Doing so shows a list of data connectors, as shown in Figure 9-1.
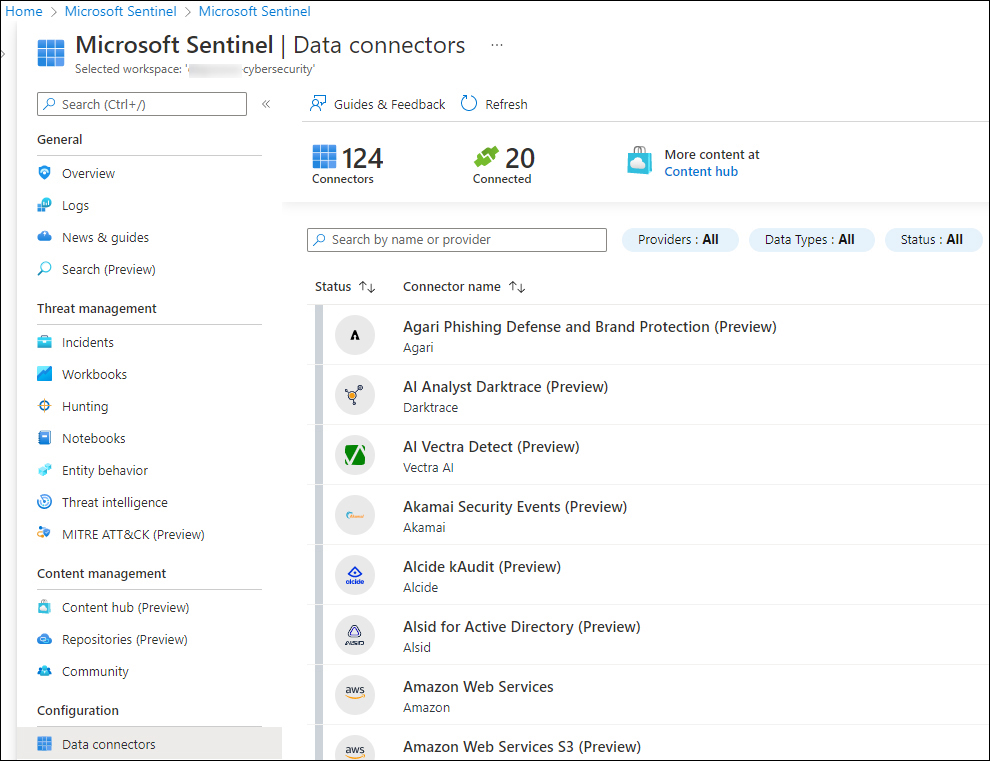
FIGURE 9-1 List of available data connectors
In the top of the middle pane, notice the number of available connectors (124, at the time this book was written). Twenty (20) of the connectors are connected, and you can filter by Providers, Data Types, and Status.
Each data connector has its own specific permission requirements and configuration steps, which will be shown when you click Open Connector Page, as shown in Figure 9-2.
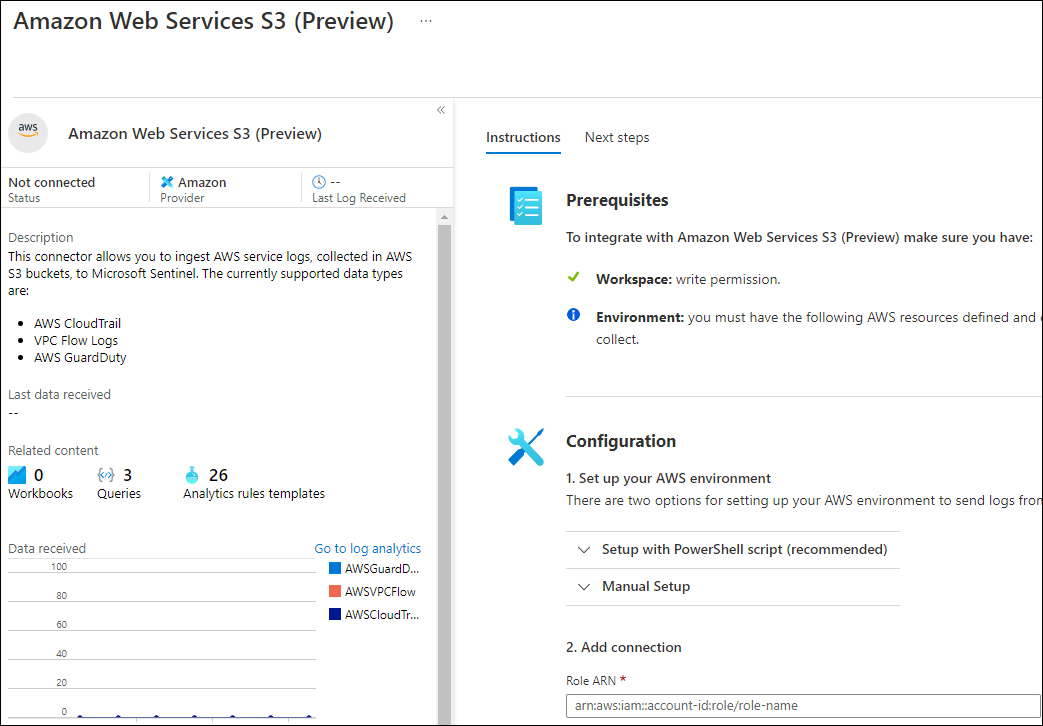
FIGURE 9-2 Amazon Web Services S3 data connector
Ingestion methods
Microsoft Sentinel supports different types of ingestion. Table 9-1 lists the different ingestion methods:
TABLE 9-1 Different types of data connectors by ingestion method
INGESTION METHOD | DATA SOURCES |
|---|---|
Azure service-to-service integration | Built-in Azure foundational support, which supports:
|
Common Event Format (CEF) over Syslog | Linux machine with the agent installed as a forwarder |
Azure functions and REST API | Serverless connector to connect to the REST API endpoints |
Syslog | Agent for Linux ( |
Custom logs | Agent-based API based |
The Codeless Connector Platform
Besides the out-of-the-box data connectors and agents, Microsoft Sentinel offers the option to create your own custom connector through the Codeless Connector Platform (CCP). Connectors created using CCP are Software as a Service (SaaS)–based, which means that Microsoft runs this connector for you in Azure without any requirements for service installations. Another benefit is that it automatically provides health monitoring for your connector.
In practice, CCP connectors will most likely be authored by managed security service providers (MSSPs), independent software vendors (ISVs), or enterprises that act as MSSPs because there’s an authoring effort involved. In its current release, CCP enables you to connect to any data source that exposes a public REST API endpoint. In future releases, you can expect additional features, such as support for more authentication models, pagination types, and more.
The benefits of using a CCP-based connector include:
Minimal development effort required to connect with publicly exposed REST APIs
Scalable built-in Poller as a service
Configurable UI components for your connector
Health monitoring integration
Preparing for a new data connector
Enabling and configuring a new data connector requires planning and preparation. It starts with validating whether you have the appropriate authorization and authentication information. For example, some connectors require Azure Global Administrator permissions, while others require authorization and authentication configuration steps at the source. Because of new data being ingested, you need to be aware of the potential increases in ingestion and retention costs.
For example, enabling the collection of the Non-Interactive User Sign-In Logs (part of the Azure Active Directory connector) rapidly increases the amount of data being ingested. Although it can be very useful and insightful data, this only makes sense if detection rules for this data type are enabled, and your SOC team is trained to triage and investigate these types of incidents.
Tip
Before enabling a connector, explore the potential amount of data the connector generates (such as by leveraging a test environment). Also, determine which Log Analytics table data is being written to and what kind of content comes with the connector. Having detection rules that generate incidents based on the new connector is key.
Ideally, enabling a data connector should be followed by having the following:
Detection rules enabled
Prepared hunting queries
Workbooks to visualize data with drill-down capabilities
Relevant SOAR solutions, such as automation rules and Playbooks
Together with training for your SOC teams, this should be part of your strategy for onboarding new data sources.
Enabling and configuring a data connector
The easiest way to enable and configure a data connector is through the Azure portal. Several connectors, such as the Azure resource-based connectors (Azure Active Directory or Azure Activity), can be deployed through PowerShell, Azure Command Line Interface (CLI), APIs, or through Azure Resource Manager (ARM) templates. For example, the following PowerShell script enables the Office 365 data connector for Exchange, SharePoint, and Teams:
New-AzSentinelDataConnector -ResourceGroupName $resourceGroupName -WorkspaceName
$workspaceName -Office365 -Exchange Enabled -SharePoint Enabled -Teams Enabled
Note
To configure Microsoft Sentinel with PowerShell, you need to install the Az.SecurityInsights module, which can be installed from https://www.powershellgallery.com.
If you would like to use an ARM template for the same connector, you can leverage the ARM template in Listing 9-1.
LISTING 9-1 ARM template example for the Office 365 data connector
{
  "$schema": "https://schema.management.azure.com/schemas/2019-04-01/deploymentTemplate.
json#",
  "contentVersion": "1.0.0.0",
  "parameters": {
    "workspaceName": {
      "type": "string",
      "metadata": {
        "description": "Sentinel workspace name"
      }
    },
    "exchangeState": {
      "type": "string",
      "defaultValue": "enabled",
      "allowedValues": [
        "enabled",
        "disabled"
      ],
      "metadata": {
        "description": "Collect Exchange data (enabled or disabled)."
      }
    },
    "sharePointState": {
      "type": "string",
      "defaultValue": "enabled",
      "allowedValues": [
        "enabled",
        "disabled"
      ],
      "metadata": {
        "description": "Collect SharePoint data (enabled or disabled)."
      }
    },
    "teamsState": {
      "type": "string",
      "defaultValue": "enabled",
      "allowedValues": [
        "enabled",
        "disabled"
      ],
      "metadata": {
        "description": "Collect Teams data (enabled or disabled)."
      }
    },
    "location": {
      "type": "string",
      "defaultValue": "[resourceGroup().location]"
    },
    "connectorId": {
      "type": "string",
      "defaultValue": "[newGuid()]",
      "metadata": {
        "description": "New autogenerated GUID for the data connector"
      }
    }
  },
  "resources": [
    {
      "type": "Microsoft.OperationalInsights/workspaces/providers/dataConnectors",
      "apiVersion": "2020-01-01",
      "location": "[parameters('location')]",
      "name": "[concat(parameters('workspaceName'),'/Microsoft.SecurityInsights/',parame
ters('connectorId'))]",
      "kind": "Office365",
      "properties": {
        "tenantId": "[subscription().tenantId]",
        "dataTypes": {
          "exchange": {
            "state": "[parameters('exchangeState')]"
          },
          "sharePoint": {
            "state": "[parameters('sharePointState')]"
          },
          "teams": {
            "state": "[parameters('teamsState')]"
          }
        }
      }
    }
  ],
  "outputs": {
    "connectorId": {
      "type": "string",
      "value": "[parameters('connectorId')]"
    }
  }
}
To use the Azure portal instead of PowerShell or an ARM template, follow these steps to enable the Office 365 connector:
Open the Azure portal and sign in as a user who has Microsoft Sentinel Contributor and Global Administrator or Security Administrator privileges.
Navigate to the Microsoft Sentinel page.
Under Configuration, click Data Connectors.
In the search box, enter Office.
Select Office 365 and click Open Connector Page.
Select Exchange, SharePoint, and Teams and click Apply Changes, as shown in Figure 9-3.
FIGURE 9-3 Office 365 data connector configuration instructions
After validation, the connector will change the status to Connected; data will start flowing into your workspace shortly.
The Microsoft 365 Defender connector
The new Microsoft 365 Defender connector unifies and natively integrates the following Defender solutions:
Microsoft Defender for Endpoint
Microsoft Defender for Identity
Microsoft Defender for Office 365
Microsoft Defender for Cloud Apps
Microsoft Defender Alert Evidence
Eventually, the release of the Microsoft 365 Defender connector (in preview at the time this book was written) will replace all the Defender connectors mentioned in the previous bulleted list. Also, it will allow the connection of incidents and alerts with a single click, as shown in Figure 9-4.
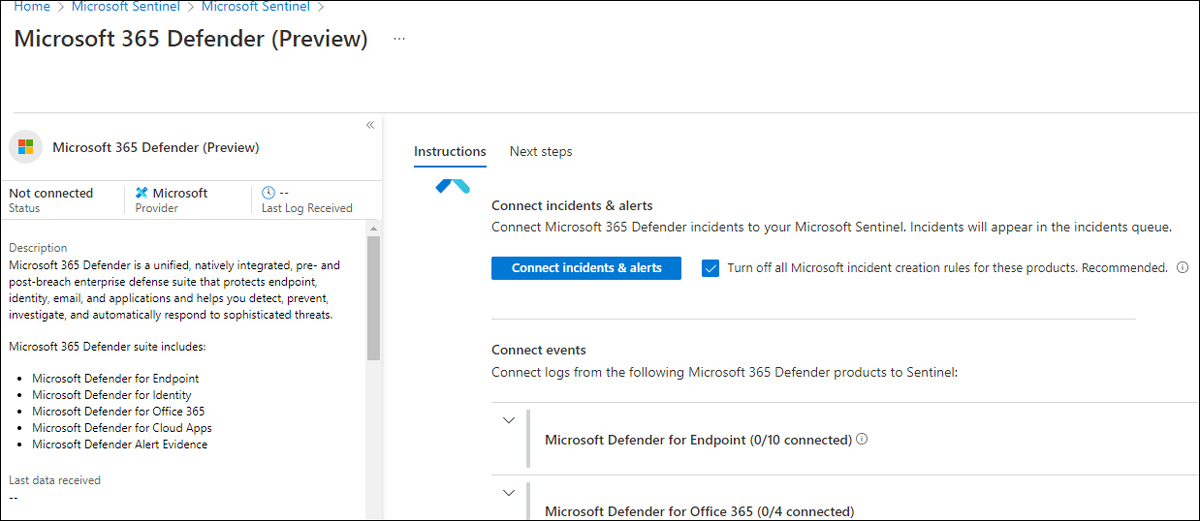
FIGURE 9-4 The new Microsoft 365 Defender connector
The onboarding of most Microsoft connectors, including several third-party connectors, is completed with a couple of clicks. For some connectors—such as the Amazon Web Services S3 connector—additional configuration steps are necessary at the source.
Understanding the Amazon Web Services S3 connector
Microsoft Sentinel’s strategy is to provide cross-platform support, which includes applications and services, operating systems, and multi-cloud. Support for Google Cloud Platform (GCP) and Amazon Web Services (AWS) is a key deliverable.
In addition to agent-based collection capabilities—regardless of the cloud platform vendor—Microsoft Sentinel offers a new, improved AWS data connector. By providing access to your AWS service logs, AWS service logs can be ingested into Microsoft Sentinel.
Tip
Elaborated step-by-step guidance on how to configure the AWS S3 connector can be found at https://aka.ms/SentinelAWSconnector.
At the time this book was written, two connectors were available for AWS. The new Amazon Web Services S3 connector, as shown in Figure 9-5, will be the eventual successor.
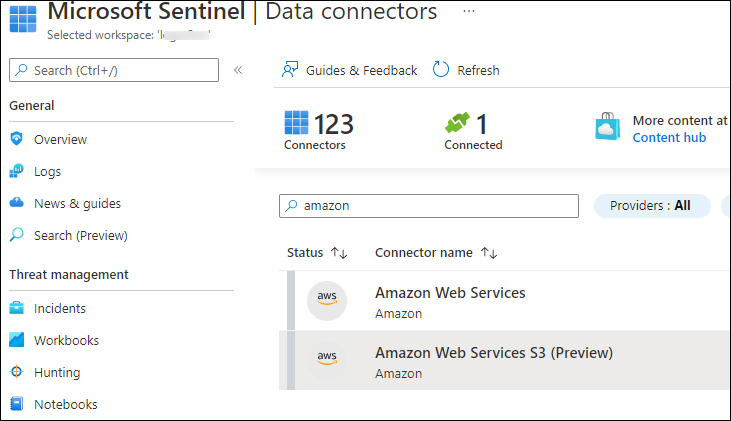
FIGURE 9-5 The new Amazon Web Services S3 connector
This new connector is not affected by the built-in limitations of the LookupEvents API. The connector performs better and, therefore, it is the recommended connector going forward.
The AWS S3 connector allows log ingestion into an S3 bucket for the following services:
Amazon Virtual Private Cloud (VPC)—VPC Flow Logs
Amazon GuardDuty—Findings
AWS CloudTrail—Management and data events
The AWS S3 configuration process
The Microsoft Sentinel AWS S3 connector retrieves data from an S3 bucket using a pull mechanism, which requires your AWS services to be configured to send logs to this S3 bucket. When new logs arrive, the following steps occur:
The Simple Queue Service (SQS) sends a notification containing the full path to the log files.
The Microsoft Sentinel account—part of an assumed role that has been granted permissions to access your AWS resources—regularly polls the SQS and discovers a new notification.
Based on the full path, which is contained in the notification, the Microsoft Sentinel account pulls out the data from the S3 bucket and ingests it into your workspace.
The diagram shown in Figure 9-6 summarizes the log collection process.
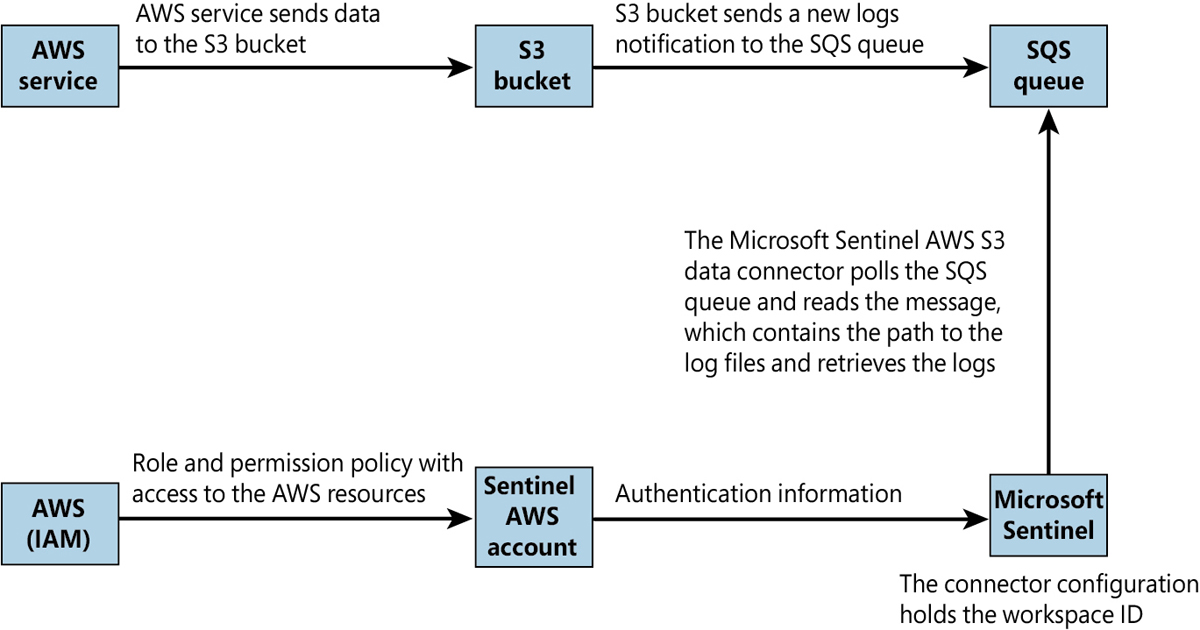
FIGURE 9-6 The AWS S3 connector log collection process
To quickly and efficiently configure the AWS S3 connector, PowerShell scripts are available to configure the necessary AWS services.
Note
The location of the scripts is linked in the instructions section of the configuration guide at https://aka.ms/SentinelAWSconnector. If you want full control of the changes, the same link also provides a walk-through of the manual steps.
Tip
If you are using the PowerShell scripts to configure the AWS S3 data connector (recommended), make sure that you understand what those scripts are executing by opening them in an editor such as VS Code.
Data connector health monitoring
Any Security Operations Center (SOC) relies on the right data, the quality and depth of the data, and an assurance that the data stream is not interrupted or intermittent. Microsoft Sentinel provides an out-of-the-box Workbook called Data Collection Health Monitoring, which provides insights into the data ingested by table size, number of events, events per second (EPS), last time received, and more, as shown in Figure 9-7.
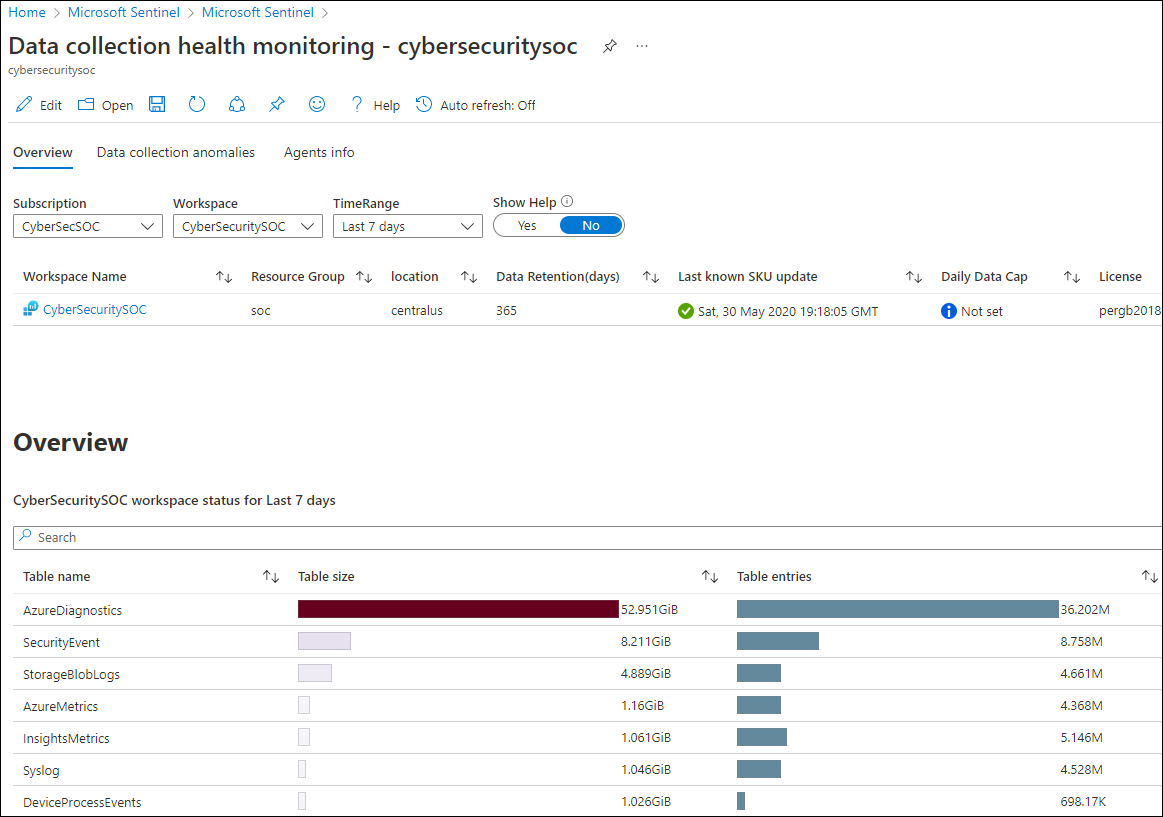
FIGURE 9-7 The Data Collection Health Monitoring Workbook
The Data Collection Anomalies tab is very useful for viewing the number of expected events and the actual number of events. This could indicate data connector issues, which can be filtered for all tables (the General tab) or per specific tables, as shown in Figure 9-8.
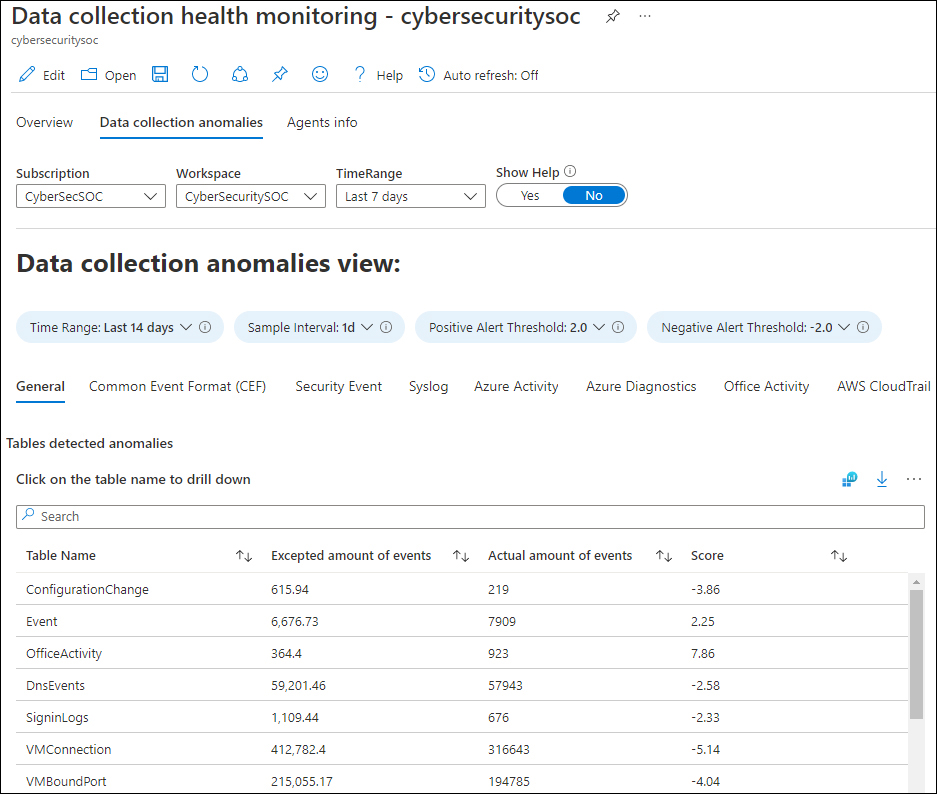
FIGURE 9-8 Data Collection Anomalies View
The Agents Info tab shows heartbeat information, which can be helpful in monitoring and troubleshooting the agent connectivity, as well as the heartbeat history, as shown in Figure 9-9.
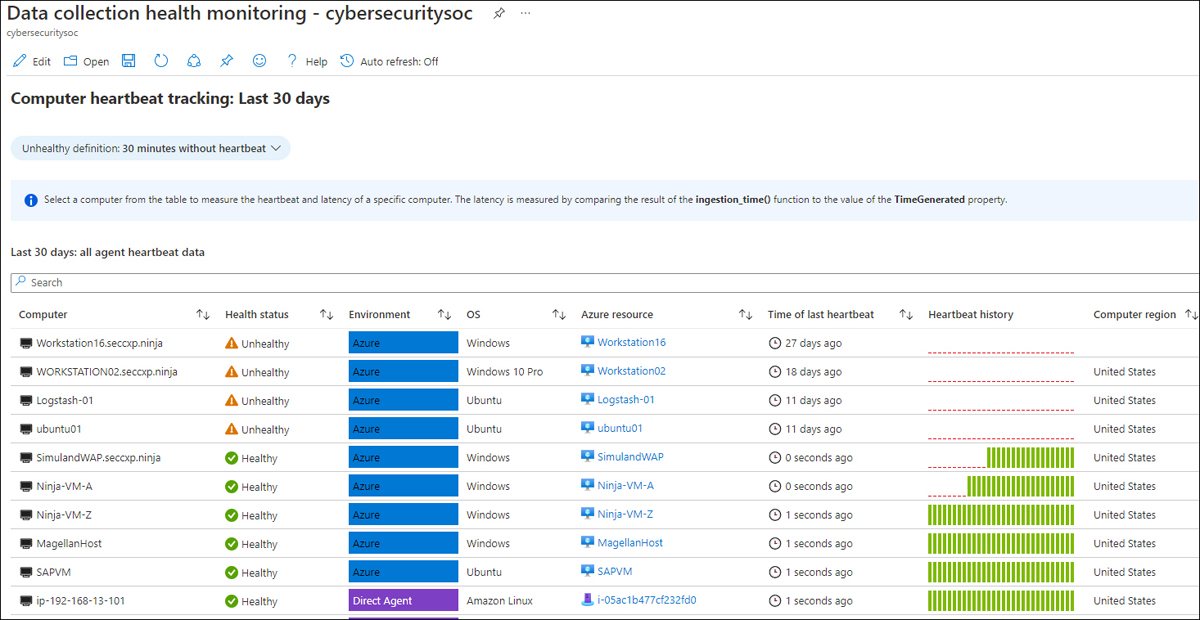
FIGURE 9-9 Agent Info tab, showing the Computer Heartbeat Tracking
Note
An agent sends a heartbeat every 60 seconds.
The Microsoft SentinelHealth table
The new SentinelHealth table helps you monitor your connector health, providing insights on health drifts, such as the latest failure events per connector or connector state changes from success to failure. This allows you to create incidents based on data connector failures.
Health insights for out-of-the-box connectors are currently supported for the following tables:
Amazon Web Services (CloudTrail and S3)
Dynamics 365
Office 365
Office ATP
Threat Intelligence—TAXII
Threat Intelligence Platforms
The following query can be used to show data connector failures:
SentinelHealth
| where TimeGenerated > ago(3d)
| where OperationName == 'Data fetch status change'
| where Status in ('Success', 'Failure')
| summarize TimeGenerated = arg_max(TimeGenerated,*) by SentinelResourceName, SentinelResourceId
| where Status == 'Failure'
A sample of this query and its result is shown in Figure 9-10.
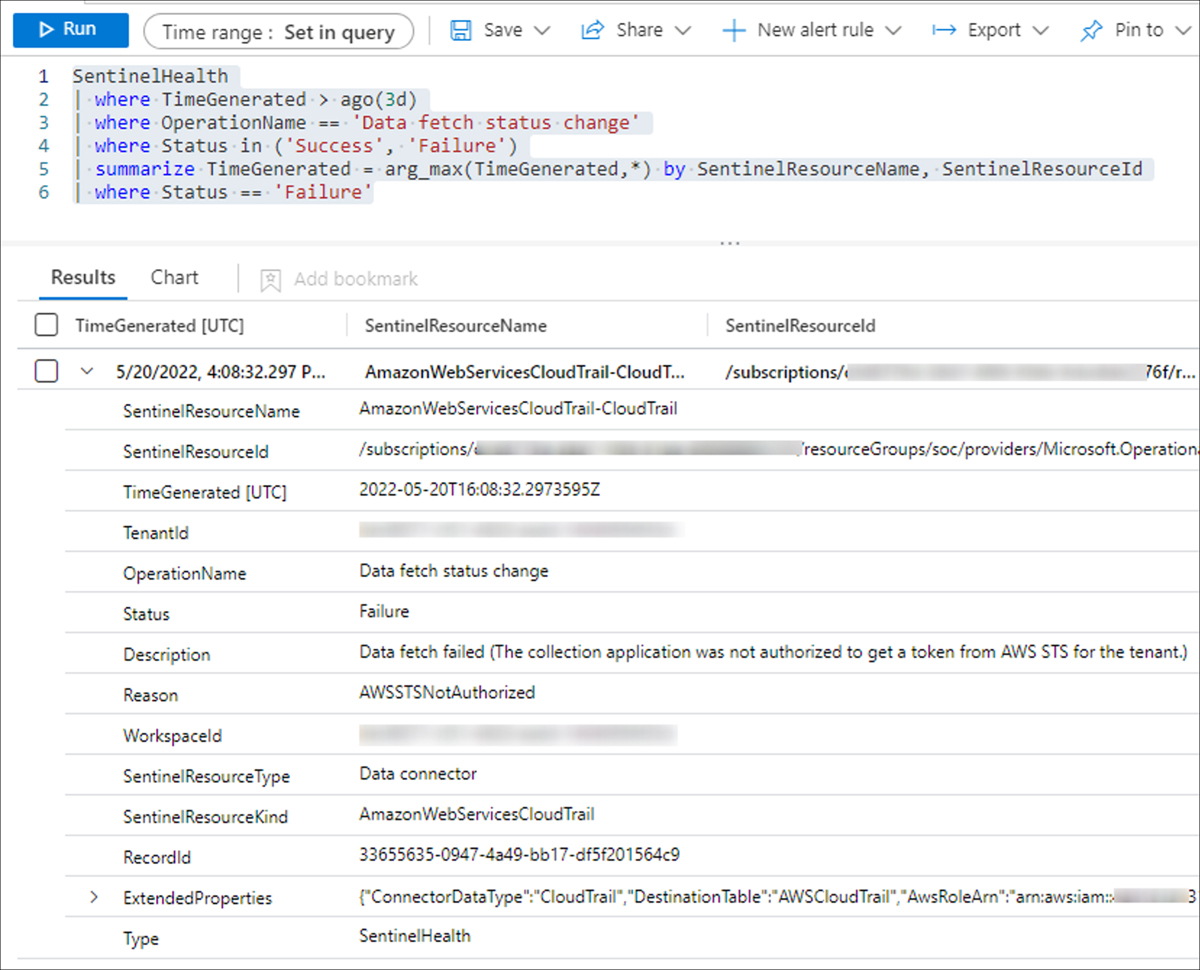
FIGURE 9-10 SentinelHealth table query
The Content Hub
When Microsoft Sentinel was released in March 2019, the out-of-the-box data connectors helped customers quickly and efficiently onboard their data. However, with the rapidly increasing number of data connectors and custom content, challenges surfaced regarding how to manage and centrally deploy content. This is why repositories were initially developed.
The repositories feature is aimed at supporting a CI/CD source control strategy for GitHub and Azure DevOps for the following content types:
Analytics rules
Hunting queries
Playbooks
Automation rules
Parsers
Workbooks
When content is modified or added to your repository, a workflow automatically deploys the update to your connected workspaces. Figure 9-11 shows a configured repository connection for GitHub.
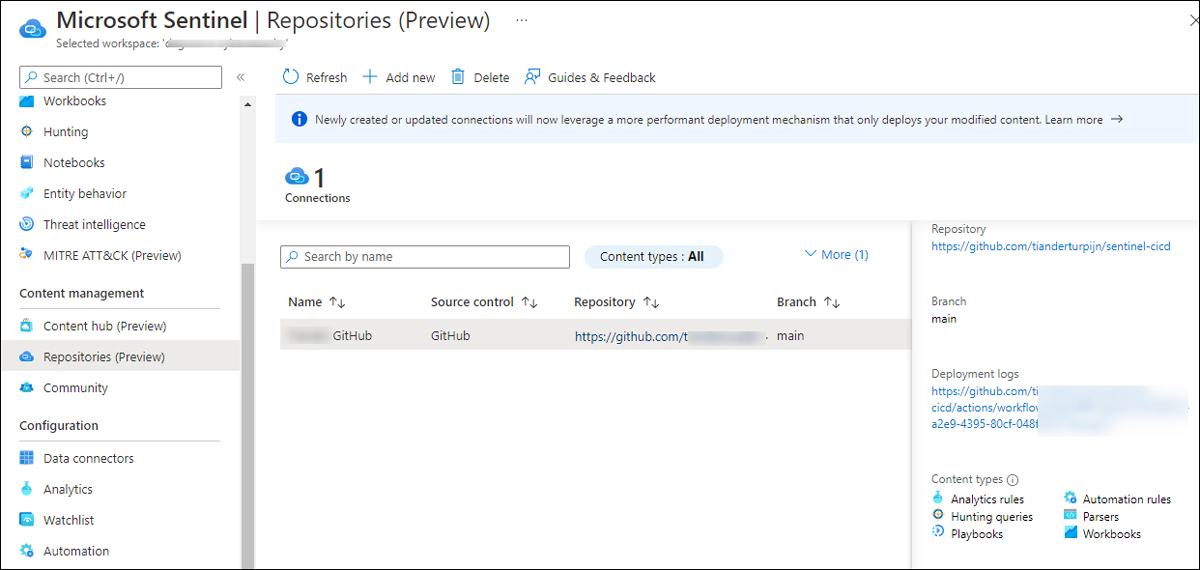
FIGURE 9-11 Repositories connection for GitHub
Note
Repositories connections created after April 20, 2022, will, by default, use a back-end capability called Smart deployments, which only deploys modified content. Prior to April 20, 2022, all content was redeployed with each update. See https://aka.ms/SentinelRepositories for more information.
Although the repositories feature addresses the source control challenge, the Log4J vulnerability made it very clear that better a solution, based on a specific scenario or use case, was necessary. Although Microsoft released Log4J hunting queries and detection rules in less than two days of the exploit discovery, Microsoft Sentinel customers struggled to find the content. The new Content Hub aims to address this gap.
Note
Microsoft Sentinel solutions are packages of Microsoft Sentinel content or Microsoft Sentinel API integrations that fulfill an end-to-end product, domain, or industry vertical scenario in Microsoft Sentinel.
Although the Content Hub supports more content types, the main differences between the data connectors page are the search and filter capabilities. The Content Hub also improves how you apply updates to already installed content. Table 9-2 provides a listing of the Content Hub types and what each provides.
TABLE 9-2 Content Hub types
CONTENT TYPE | PROVIDES |
|---|---|
Data connectors | Log ingestion from various sources |
Parsers | Log formatting/transformation into Advanced Security Information Model (ASIM) formats |
Workbooks | Monitoring, visualization, and interactivity |
Analytics rules | Creation of incidents |
Hunting queries | Proactive queries to hunt for threats |
Notebooks | Advanced hunting features in Jupyter and Azure Notebooks |
Watchlists | Support for the ingestion of specific data for enhanced threat detection and reduced alert fatigue |
Playbooks and Azure Logic Apps custom connectors | Features for automated investigations, remediations, and response scenarios |
Note
More information about the Advanced Security Information Model (ASIM) can be found at https://aka.ms/sentinelasim.
Aside from search capability, the Content Hub provides several useful filtering capabilities, which are shown in Figures 9-12 to 9-17.
The Status filter now also shows New, Preview, and Update Available content, as shown in Figure 9-12.
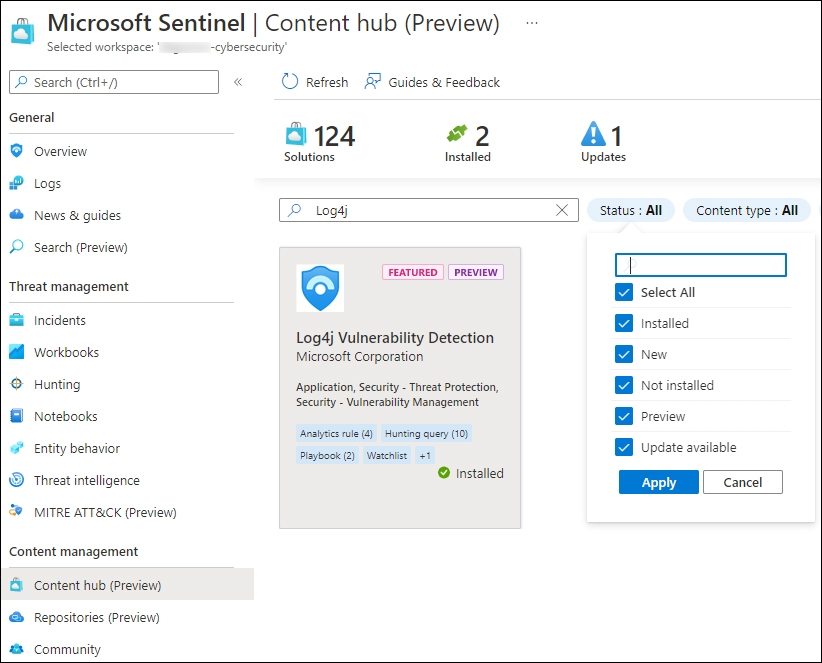
FIGURE 9-12 Content Hub search and status filters
The Content Type filter allows you to select different types of content, as shown in Figure 9-13.
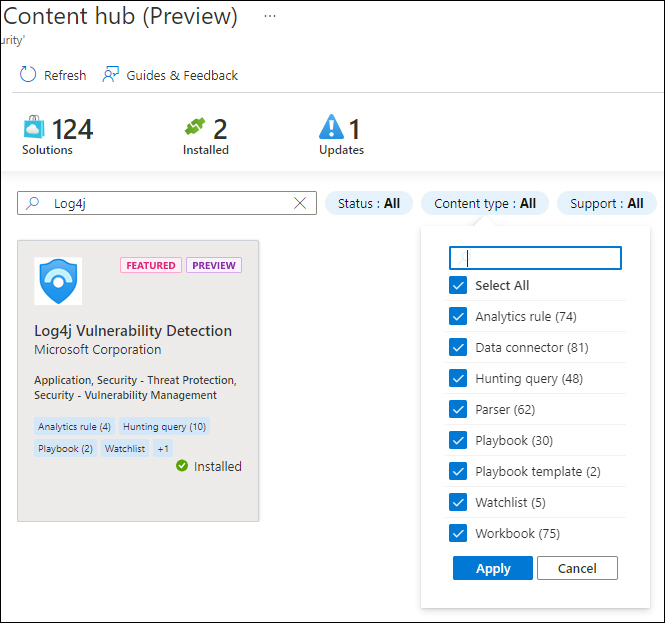
FIGURE 9-13 Content Hub Content Type filters
With the integration of partner and community solutions, being clear on supportability is important if you need to raise a support ticket. Figure 9-14 shows the Support filter.
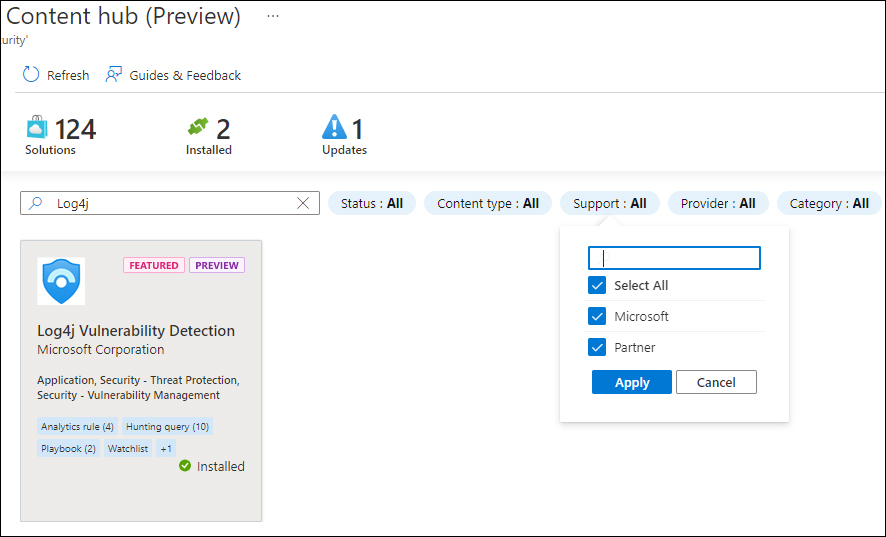
FIGURE 9-14 Content Hub Support filters
The Provider filter shows who the solution provider is, as shown in Figure 9-15.
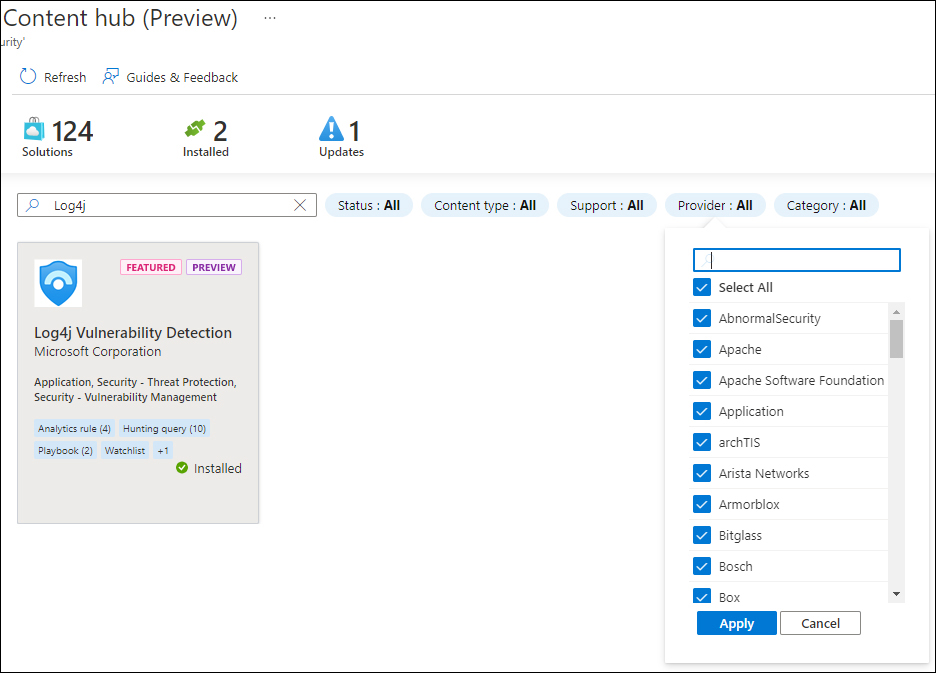
FIGURE 9-15 Content Hub Provider filters
The Category filter, as shown in Figure 9-16, is used to filter content per domain.
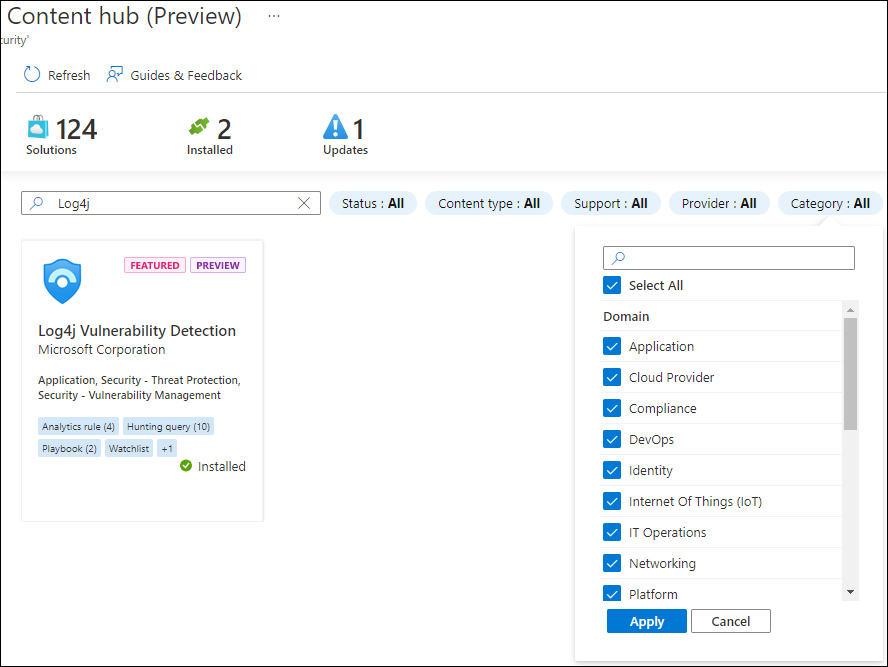
FIGURE 9-16 Content Hub Category filter
When a solution has been previously installed, the solution tile indicates when an update is available. Also, the top icons will show the number of updates available. Using the Actions button, you can update the solution, as shown in Figure 9-17.
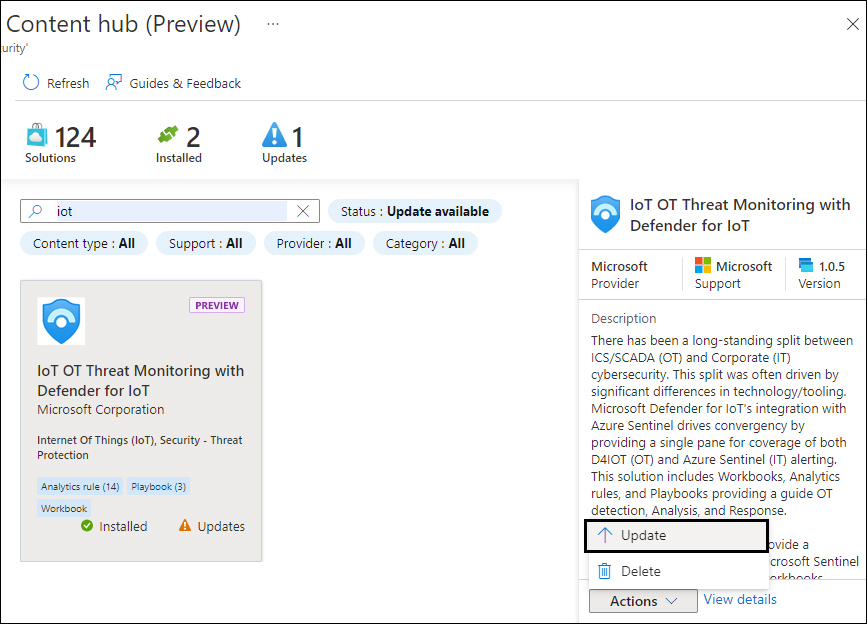
FIGURE 9-17 Content Hub solution update
Over time, the Content Hub will continue to evolve, offering more solutions, more manageability features, and better content integration.