
CHAPTER 3
Methodology and Analysis
A sequential multi-method approach was used to obtain the highest levels of generalizability and credibility of results (McGrath, 1982). This methodological approach was chosen for balancing the inherent flaws in reliability and validity of the measurement constructs of each of the individual methods (McGrath 1982, Remenyi, Williams, Money, & Swartz, 1998). A combination of several methods and triangulation of their results allows for more confidence in the research results (Jick, 1979).
Execution of the research model started with an exploratory qualitative study to develop a basic understanding of the roles and responsibilities under the two governance structures. Following that, a quantitative study was performed to confirm the findings and test the hypotheses. This order (qualitative followed by quantitative) is also used for the report in this chapter.
The Qualitative Study
The approach followed Yin’s (1994) methodology for case-study research. Using a grounded theory approach (Glaser & Strauss, 1967), the roles and responsibilities of the two groups of managers were identified through a continuous comparison of interview results. The simultaneous work of data collection and analysis were guided by the questions “How do project type and organizational complexity determine the use of project portfolio and program management in organizations?” and “What are middle managers’ practices, roles and responsibilities in program and portfolio management in successful organizations?”
The qualitative study was based on the assumption that new data, new cases, and—in this study—new interviews would create new knowledge and improved understanding, in order to answer the research questions. Empirical data on managerial actions, collected through interviews, were used to identify the roles and responsibilities of middle managers. Data were immediately analyzed after each interview and subsequently interpreted. This was done through constant comparison of the newly collected data with existing data, and the coding from previous interviews. A systematic coding started with first-level codes or terms used by the managers interviewed. Through iterative analyses, the first-level codes were refined into general codes, following Strauss and Corbin (1988, p. 212), until:
(a) no new or relevant data seem to be emerging regarding a category, (b) the category is well developed in terms of its properties and dimensions demonstrating variation, and (c) the relationships among categories are well established and validated.
This process allowed:
1. Focusing data collection activities and improving theoretical sampling (Glaser & Strauss, 1967).
2. Identifying patterns, and achieving theoretical saturation in these patterns.
The importance of theoretical saturation for the developed theory and its validity cannot be underestimated. Pattern-matching techniques (Miles & Huberman, 1994), therefore, were used to identify typical program and portfolio management-related practices, roles, and responsibilities of the managers. NVIVO software was used for the analysis of qualitative data, and for keeping track of codes and emerging patterns. These patterns were later used as concepts for the development of questionnaire items for the quantitative study.
A series of 9 semi-structured interviews were held with 11 managers in 5 different industries and 5 different countries. Respondents were selected based on the importance of their organization in a particular industry or geographical area. Annual turnover of the firms ranged from US$160 million to US$8.8 billion in 2003. The interviews were held either face-to-face or through conference calls and were tape-recorded for subsequent analysis. Six of the interviewees held positions as vice president, business unit director, or department manager, and five were in program and portfolio management roles. Details about geography, industry, company type, roles, and titles can be found in Table 2.
Interviewees held a wide variety of organizational titles (see Table 2). In many cases, their title did not directly identify them as a program or portfolio manager, even though they performed such tasks. During the analysis, interviewees were classified as a program or portfolio manager based on the individuals’ tasks in their organization. An example is a project manager for a five-year, US$430 million railway construction project that included more than 25 larger sub-projects. This interviewee’s responses were grouped under “program manager” due to the complexity of the undertaking (the larger project was comprised of several larger and smaller projects). Another example is a department manager who ran several projects simultaneously to develop and maintain a client’s IT system. This individual’s task included many projects over an extended period of time, but the number and duration of projects was less than those of the manager involved in the railroad project. In the department manager example, the two roles of program manager and portfolio manager were intertwined. The person’s activities were sorted according to the profile of either program manager or portfolio manager. Generally, the interviewees’ activities (the what and how of their work) classified their role. The criteria used by their managers to evaluate each interviewee’s program or portfolio were classified as each interviewee’s responsibility.

Qualitative Data Analysis Results
Managers with portfolio management roles are found at medium or higher levels in the organizational hierarchy, typically as director or vice president. The common responsibility that middle managers share in portfolio management is the leveling of resources across projects, with the objective of maximizing the economic use of resources within a portfolio. Furthermore, they are often responsible for achieving financial objectives in managing their portfolio (e.g., by lowering the negative financial impact of troubled projects). Through their responsibilities, which include achieving financial results in relation to the annual business plan, they become indirectly accountable for shareholder value. Even though traditional project performance indicators for projects within a portfolio are important for the middle managers in managing their portfolio of projects, these indicators are often dealt with or delegated to program managers and project managers. Tools that these managers use include aggregated red/yellow/green status reports of the projects, organizational time and cost information from corporate ERP systems, profit and loss statements, and short- and long-term corporate strategic plans.
Those managers with a stronger focus on the program management role aim for maximizing the results of their particular program. Managers performing both roles simultaneously aim for a balance between the short-term goals of the program and the long-term goals of the portfolio.
Middle managers with roles in program management are typically found at a lower or medium level of management, such as department manager or director. Related responsibilities include creation of stakeholder value through achievement of a program’s time and budget objectives, as well as delivery of contracted products or services. Their focus is mainly on the timely delivery of programs. Responsibility for quality is often delegated to the project managers. The tools they use include aggregated project information, resource databases for skills per person and people per project, and databases of possible subcontractors for projects.
The managers’ program and portfolio management roles are performed before and after a single project or program is started. These roles fall into three categories addressing effectiveness, coordination, and efficiency of program and portfolio management. Table 3 shows the categories and roles.
Prior to project execution, managers aim for effectiveness, or selection of the right projects, by identifying, assessing, selecting, and planning for appropriate business opportunities. This is often done by evaluating business opportunities against a set of predetermined selection criteria, such as profit margins, strategic value of customer delivery projects, or Return on Investment (ROI) in organizations’ internal projects. Coordination takes place through resource planning and procurement, as well as identification of synergies between projects. Efficiency is achieved through project/program plan reviews and selection of the right resources. This ensures that organizations execute their projects at the lowest possible cost.

During project execution, both the program and portfolio management roles include:
- Identification of bad projects for increased efficiency, participation in steering groups, coordination and prioritization of projects, collection and aggregation of reports for coordination of projects
- Project reviews, coaching, issue handling, and improvement of corporate processes for increased efficiency in execution.
Even though the program and portfolio management roles are similar during project execution, they differ slightly in extent due to their differences in a program or portfolio management context.
The roles identified during this study (and shown in Table 3) were subsequently validated through a quantitative study, which is described in the following section. The individual roles are further explained in Chapter 4: Managerial Implications: What Middle Managers in Successful Organizations Do.
The Quantitative Study
The research model was executed through the combination of a qualitative study and a quantitative study, with the former identifying the roles and responsibilities of middle managers in program and portfolio management, and the latter confirming the results. This quantitative study also investigated the impact of environmental complexity and project type on program and portfolio management roles, responsibilities and practices of middle managers. The quantitative analysis was performed in three steps:
1. Validating the results from the qualitative study.
2. Assessing the correlation between independent variables and dependent variables.
3. Modeling the relationship of roles and practices with environment and project type.
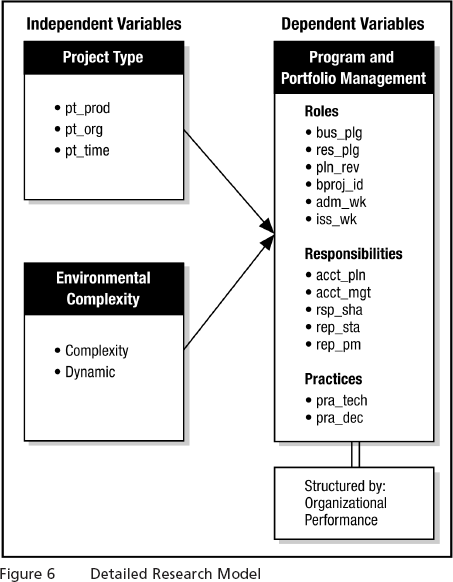
The independent variables of the research model were operationalized using 5-point Likert scales for the following constructs:
- Project type was assessed through a series of project attributes, which were subsequently factor-analyzed to identify the respondents’ underlying project type structures
- Environmental complexity was assessed by using the popular set of questions developed by Duncan (1972). Here, two dimensions of complexity are assessed. The simple/complex dimension measures the number and similarity of environmental factors taken into account during decision-making in organizations. A high level indicates a complex decision-making process due to a large number of factors that need to be taken into account. The static/dynamic dimension indicates the degree to which the factors for decision-making are the same over time or continually change. A high level indicates a frequent change in factors.
Dependent variables of the research model were operationalized through the concepts of:
- Governance practices, as a set of questions that measure the extent to which an organization uses program and portfolio management techniques, tools, and associated processes. This includes project prioritization, selection of projects depending on the organization’s strategy, prioritization of projects, communication of portfolio results, use of similar metrics to measure results, use of steering groups and a group decision-making style (versus individual decisions), the extent of face-to-face meetings, and the extent that decisions are made in the best interest of the organization. All measures were taken on 5-point Likert scales. The questions were subsequently factor analyzed to identify the underlying structures for practices in program and portfolio management.
- Roles, a set of questions derived from the roles identified in the qualitative study. These were also measured on 5-point Likert scales.
- Responsibilities, a set of yes/no questions that assessed the respondents’ responsibilities, as identified and described in the foregoing qualitative study.
A set of questions, based on (Duncan, 1972), was developed to assess the TCE dimensions of product uniqueness and risk. Responses, however, showed more than 80% of missing values for these questions. This set of questions, therefore, was not used for analysis.
A Web-based questionnaire was used to collect data. After a pretest, an introduction letter and the Web-link were e-mailed to chapter representatives of professional organizations for managers and program/portfolio managers. They were asked to forward the survey to their members or other managers working with program and portfolio management. Quality in the responses was ensured by having the survey sent only to professionals. Organizations addressed included the Institute of Directors, IEEE Engineering Management, IEEE Computer Society, IEEE Aerospace, The Swedish Project Management Society, PMO Interest Group of Sweden, National Association of Corporate Directors; Society for Human Resource Management, The Performance Measurement Association, as well as Project Management Institute (PMI) and International Project Management Association (IPMA). The sampling resulted in a convenience sample, whose sample frame and traditional response rate could not be calculated due to the snowball approach that was used.
Sample Demographics
The number of responses totaled 244, of which 242 were used for analysis. Two respondents were excluded because of unrealistic responses. Seventy-four persons (31%) were under 40 years of age, 102 persons (42%) were between 41-50 years, and 65 persons (27%) were above 51 years old. The mean age was 45.5 years. See Table 4.
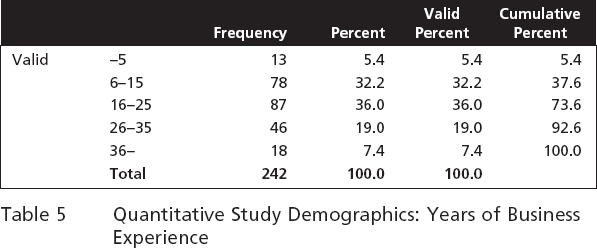
Average business experience was 20 years. Thirty-eight percent had up to 15 years of business experience, 36% had between 16 and 25 years, and 26% had more than 25 years of business experience. The details are in Table 5.

Mean current position experience was 4 years. Twenty-four percent had one year or less experience in their current position, while 45% had more than four years experience. Fifty-six percent were certified project managers. Details can be found in Table 6.


As shown in Table 7, the respondents were from 26 countries, including 40% from North America, 32% from the Scandinavian countries (Denmark, Finland, Norway, and Sweden), nearly 17% from other parts of Europe, and 10% from other parts of the world. Sixty-five percent worked with projects internal to their organization, and 35% with external projects.
Forty-six percent of the respondents indicated that they are working in program or portfolio management, while 51% indicated they work as other managers or consultants. ANOVA analysis of the differences between responses showed no significant differences between the two groups (at p = .05). All responses, therefore, were used for the subsequent analyses.
Demographic dispersion by industry showed a dominance of respondents from the IT industry (37%), followed by Engineering (27%) and Services (25%). Education and other industries were both below 4% of the responses. Details are shown in Table 8.

Quantitative Data Analysis Results
Step 1 of the analysis started by validating questionnaire constructs for the six types of roles (see Table 2), as well as the responsibilities and governance practices.
Cronbach Alpha values between .73 and .80 showed acceptable reliability levels for the questions on roles. Averages were taken for each construct, resulting in the following role-related variables:
- bus_plg: identification of business opportunities and business planning
- bproj_id: involvement in identification of bad projects
- res_plg: involvement in resource planning and procurement
- adm_wk: involvement in steering groups, prioritization and coordination of projects, collection and aggregation of reports
- iss_wk: involvement in reviews, handling of issues, coaching of project managers, and general improvement of organization-wide processes
- pln_rev: involvement in reviews of program and project plans.
Responsibility-related dependent variables (ordinal) were:
- act_pln: accountability for the achievement of annual business plans
- act_pgm: accountability for the achievement of planned projects and programs
- rsp_sha: shared responsibilities between peer-level managers
- rep_sta: a position that staff reports to
- rep_pm: a position that project managers report to
Governance practices for program and portfolio management were assessed through a set of reliable questions (α = .86). Factor analysis was used to reduce the number of variables. The extracted factor variables were used as replacements for the original variables in subsequent analyses.
Two underlying governance dimensions were identified:
- pra_tech: application of dedicated processes, techniques, and tools for program and portfolio management, such as those listed above
- pra_dec: decision-making practices, as listed above.
This confirmed the usability of the constructs for measurement of the dependent variables.
Step 2 of the analysis started by identifying the independent variables.
Factor analysis of the variables for project type identified the respondents by distinguishing between:
- pt_prod: product-related projects
- pt_org: organizational change-related projects
- pt_time: longer-term projects (> 1 year, > 3 years).
Organizational complexity was calculated as described by Duncan (1972), resulting in two independent variables for:
- complexity: number of factors taken into account during decision-making
- dynamic: frequency of change in factors for decision-making.
Performance of the organization was assessed through nine questions using 5-point Likert scales to measure an organization’s success in projects, programs and portfolios (α = .84). The results were averaged for an overall performance measure of the organization. This scale variable was subsequently converted to ordinal for classification of organizations by their performance level (variable: lohi_perf). Organizations at or above the sample mean were classified as high performing (coded 1), and those under the sample mean as low performing (coded 0).
Figure 6 shows the detailed research model together with the associated variables, as previously described. The model allows for assessments of correlation between all independent and dependent variables.
The research hypotheses were tested through regression and correlation analyses. Statistical significance was assessed at the .05 level, and practical significance through effect size, which is “the estimate of the magnitude to which a phenomena being studied exists in the population” (Hair, Anderson, Tatham, & Black, 1998, p. 2). Classification of effect sizes was done through the regressions’ R2, with thresholds for small effect size at R2 of .02, medium at .13, and large at .26 (Cohen 1988, p. 413).
- Correlation between independent variables and responsibility variables was tested using Spearman correlations. No correlations were found.
- Correlation of governance and roles variables was tested through a stepwise regression analysis of governance practices and roles variables against all independent variables.
The results are shown in Table 9
Environmental complexity is positively correlated with governance practices using advanced techniques, tools, and processes (p <.001). An R2 of .314 indicates high practical significance through a very large effect size. This confirms research hypothesis H1. Organizations’ perceived environmental complexity is directly related to the use of program and portfolio management as governance practice.
The positive correlation between environmental complexity and the roles for business planning and issue handling indicates the emergence of these roles in organizations where decision-making is complex due to a large number of factors that need to be taken into account. The frequency of change in these factors, as well as the extent of product content in a program, does not seem to impact governance practices or roles.
The organizational change content in projects positively correlates with the emergence of roles for resource planning, administrative work, and issue handling. This indicates an increase in coordination activities through these types of projects. The duration of projects is positively related to the roles for business planning, project/program plan reviews, and bad project identification. This shows increased sensitivity for effectiveness and efficiency in longer-term projects. All roles-related correlations show practical significance, albeit with small effect sizes. This partly confirms research hypothesis H2. Different project types are correlated with different program and portfolio management roles, but not with responsibilities.

Significant differences between low and high performing organizations were found in governance practices using advanced techniques, tools and processes, as well as in the role for identification of bad projects in organizations. Higher performing organizations scored significantly higher on these two factors (p = .05). That confirms research hypothesis H3. Governance practices in program and portfolio management differ significantly between high and low performing organizations.
Analysis of differences of responsibilities in low and high performing organizations was done using ANOVA. A significant difference was found in responsibility for project managers. In low performing companies, project managers often report to middle managers, whereas in high performing companies, project managers report elsewhere. This confirms, albeit weakly, research hypothesis H4. Middle managers’ responsibilities in program and portfolio management differ significantly between high and low performing organizations.
The extent of business planning was also identified as being significantly higher in high performing organizations.
Step 3 of the analysis was done to identify patterns of program and portfolio management roles in different situations. Canonical correlation analysis was used for modeling the relationship between the group of independent variables and the group of dependent variables in different situational contexts. Canonical loadings were used for interpretation of the models, which allow for interpretation of the results as factors. The usual .3 threshold for significance of loadings was applied (Hair et al., 1998). Two models were found, one statistically significant at .05, and one just above the statistical threshold for insignificance (p = .056).
Across all responses, the combination of environmental complexity, organizational change content of projects, and the duration of projects is correlated with all roles (see Model 1 in Table 10). It identifies the importance of all roles for balancing the “soft” organizational factors and the “hard” time factors in business.
This is also depicted in Figure 7, which shows the canonical correlation model graphically, placing the independent variables for environmental turbulence and project types in the upper part, and the correlated dependent variables for roles in the lower part. The clustering of the variables at one side of the continuum shows the integration of roles, project type, and environment. This identifies a high adaptability of an organization’s roles to their situation (i.e., environment and project type).
| Model 1: All respondents | Model 2: Low performing organizations | |
| Complexity | −0.751 | 0.525 |
| Dynamic | −0.001 | 0.107 |
| pt_prod | 0.107 | 0.362 |
| pt_org | −0.355 | − 0.701 |
| pt_time | −0.599 | 0.471 |
| bus_plg | − 0.923 | 0.174 |
| res_plg | −0.497 | − 0.429 |
| pln_rev | −0.580 | 0.194 |
| bprj_id | −0.646 | 0.159 |
| adm_wk | − 0.589 | −0.516 |
| iss_wk | − 0.695 | 0.003 |
| Sign. | 0.041 | 0.059 |
| Wilk’s | 0.797 | 0.573 |
| Chi-Square | 44.757 | 42.936 |
| DF | 30.000 | 30.000 |
| Canonical Correlations | 0.328 | 0.435 |
| Redundancy Index | 0.048 | 0.017 |
| n | 242 | 101 |
Note: significant loadings are shown in bold |
||
Table 10 Canonical Correlation Models

Model 2, even though it’s at the borderline of insignificance, shows that low performing organizations balance the requirements from the organizational parts of their projects through resource planning and administrative work. This is also done by other organizations (see Model 1). However, low performing companies do not balance the requirements stemming from the environmental complexity, as well as product contents and duration of projects through any of the roles. This is depicted in Figure 8. Three of the four situational variables are disconnected from the rest and no roles are in place to handle the requirements arising from these environmental factors. It is indicated that middle managers in these organizations ignore the environment, as well as the importance of product and time for their organizations’ projects.

Results Triangulation
The results of the study were triangulated with those identified by Elonen and Artto (2003) as problem areas for portfolio management. To do so, the differences between low and high performing organizations in their program/portfolio management practices, roles, and project types were assessed on the level of individual questions of the questionnaire. Answers significantly different (p < .05) between low and high performing organizations were mapped against the problem areas defined by Elonen and Artto (2003). The results are shown in Table 11.
It shows that roles used to a lesser extent in low performing organizations match the problem areas of inadequate project level activities; lack of resources, competence and methods; as well as lack of commitment, unclear roles and responsibilities. Practices underrepresented in low performing organizations matched against the areas of inadequate activities at the portfolio level, information management, and inadequate management of the project-oriented business.
Findings not identified by Elonen and Artto (2003) are the particular performance improvements through program and portfolio management practices in organizations running projects with a high service and organizational change content, and delivery to external organizations. That identifies program and portfolio management as especially appropriate for delivery projects in buyer-seller relationships.
