RULE 3
Small Fees Pack Big Punches
An out-of-town visitor was being shown the wonders of the New York financial district. When the party arrived at the Battery, one of his guides indicated some handsome ships riding at anchor. He said,
“Look, those are the bankers’ and brokers’ yachts.”
“Where are the customers’ yachts?” asked the naïve visitor.1
—Fred Schwed, Where Are the Customer’s Yachts?
In 1971, when the great boxer Muhammad Ali was still undefeated, US basketball star Wilt Chamberlain suggested publicly that he stood a chance of beating Ali in the boxing ring. Promoters scrambled to organize a fight that Ali considered a joke. Whenever the ultra-confident Ali walked into a room with the towering Chamberlain within earshot, he would cup his hands and holler through them: “Timber-r-r-r-r!”
Chamberlain felt that one lucky punch could knock Ali out. He thought he had a chance. But the rest of the sporting world knew better. Chamberlain’s odds of winning were ridiculously low, and his bravado could only lead to significant pain for the great basketball player.
As legend has it, Ali’s “Timber-r-r-r-r!” taunts eventually rattled Chamberlain’s nerves enough to put a stop to the pending fight.2
Most people don’t like losing. For that reason there are certain things most of us won’t do. If we’re smart (sorry Wilt) we won’t bet a professional boxer that we can beat him or her in the ring. We won’t bet a prosecuting lawyer that we can defend ourselves in a court of law and win. We won’t put our money down on the odds of beating a chess master at chess.
But would we dare challenge a professional financial adviser in a long-term investing contest? Common sense initially suggests that we shouldn’t. However, this may be the only exception to the rule of challenging someone in their given profession—and beating them easily.
With Training, the Average Fifth Grader Can Take on Wall Street
Yes, it’s easy for a fifth grader to take on Wall Street. The kid doesn’t have to be smart. He just needs to learn that when following financial advice from most professional advisers, he won’t be steered toward the best investments. The game is rigged against the average investor because most advisers make money for themselves—at their clients’ expense.
The Selfish Reality of the Financial Service Industry
The vast majority of financial advisers are salespeople who will put their own financial interests ahead of yours. They sell investment products that pay them (or their employers) well, while you’re a distant second on their priority list. Many of us know people who work as financial planners. They’re fun to talk to at parties or on the golf course. But if they’re buying actively managed mutual funds for their clients, they’re doing their clients a disservice.
Instead of recommending actively managed mutual funds (which the vast number of advisers do), they should direct their clients toward index funds.
Index Funds—What Experts Love but Advisers Hate
Every nonfiction book has an index. Go ahead, flip to the back of this one. Scan all those referenced words representing this book’s content. A book’s index is a representation of everything that’s inside it.
Now think of the stock market as a book. If you went to the back pages (the index) you could see a representation of everything that was inside that “book.” For example, if you went to the back pages of the US stock market, you would see the names of companies such as Walmart, The Gap, Exxon Mobil, Procter & Gamble, and Colgate-Palmolive. The directory would go on and on until several thousand businesses were named.
In the world of investing, if you buy a US total stock market index fund, you’re buying a single product that has thousands of stocks within it. It represents the entire US stock market.
With just three index funds, your money can be spread over nearly every available global money basket:
- A home country stock market index (for Americans, this would be a US index; for Canadians, a Canadian stock index)
- An international stock market index (holding the widest array of international stocks from around the world)
- A government bond market index (made up of government bonds that guarantee an interest rate)
I’ll explain the bond index in Chapter 5. In Chapter 6, I’ll introduce you to four real people from across the globe. They created indexed investment portfolios. It was easy for them (as you’ll see) and it will be easy for you.
That’s it. With just three index funds, you’ll beat the pants (and the shirts, socks, underwear, and shoes) off most financial professionals.
Financial Experts Backing the Irrefutable
Full-time professionals in other fields, let’s say dentists, bring a lot to the layman. But in aggregate, people get nothing for their money from professional money managers. . . . The best way to own common stocks is through an index fund.3
—Warren Buffett, Berkshire Hathaway Chairman
If you were to ask Warren Buffett what you should invest in, he would suggest that you buy index funds. He has also instructed his estate’s trustees to put his heirs’ proceeds into index funds when he dies. He shared this information in Berkshire Hathaway’s 2014 annual report. “My advice to the trustee could not be more simple: put 10 percent of the cash in short-term government bonds and 90 percent in a very low-cost S&P 500 index fund. (I suggest Vanguard’s.)”4
As the world’s greatest investor, you might think that Warren Buffett could find a great stock picker or mutual fund manager to invest his wife’s money. But he’s a smart man. The odds are against him finding anyone who can beat the market index after fees. That’s why his wife’s money will go into index funds.
I don’t believe I would have amassed a million dollars on a teacher’s salary while still in my 30s if I were unknowingly paying hidden fees to a typical financial adviser. Don’t think I’m not a generous guy. I just don’t want to be giving away hundreds of thousands of dollars during my investment lifetime to a slick talker in a salesperson’s cloak. And I don’t think you should either.
What Would a Nobel Prize-Winning Economist Suggest?
The most efficient way to diversify a stock portfolio is with a low fee index fund.5
—Paul Samuelson, 1970 Nobel Prize in Economics
Arguably the most famous economist of our time, the late Paul Samuelson, was the first American to win a Nobel Prize in Economics. It’s fair to say that he knew a heck of a lot more about money than the brokers who suffer from conflicts of interest at your neighborhood Merrill Lynch, Edward Jones, or Raymond James offices.
The typical financial planner won’t want you to know this. But a dream team of Economic Nobel Laureates want you to know the truth. Investors aren’t likely to find a professional money manager who can beat the stock market index.
They’re just not going to do it. It’s just not going to happen.6
—Daniel Kahneman, 2002 Nobel Prize in Economics, when asked about investors’ long-term chances of beating a broad-based index fund
Kahneman won the Nobel Prize for his work on how natural human behaviors negatively affect investment decisions. Too many people, in his view, think they can find fund managers who can beat the market index, long term. But such thinking is wrong.
Any pension fund manager who doesn’t have the vast majority—and I mean 70 percent or 80 percent of his or her portfolio—in passive investments [index funds] is guilty of malfeasance, nonfeasance, or some other kind of bad feasance! There’s just no sense for most of them to have anything but a passive [indexed] investment policy.7
—Merton Miller, 1990 Nobel Prize in Economics
Pension fund managers are trusted to invest billions of dollars for governments and corporations. In the United States, more than half of them use indexed approaches. Those who don’t are, according to Miller, setting an irresponsible policy.
I have a global index fund with all-in expenses at eight basis points.8
—Robert Merton, 1997 Nobel Prize in Economics
In 1994, Robert Merton, Professor Emeritus at Harvard Business School, probably thought he could beat the market. After all, he was a director of Long Term Capital Management, a US hedge fund (a type of mutual fund I will explain later) that reportedly earned 40 percent annual returns from 1994 to 1998. That was before the fund imploded. It lost most of its shareholders’ money and shut down in 2000.9
Naturally, a Nobel Prize winner such as Merton is a brilliant man—and he’s brilliant enough to learn from his mistakes. When asked to share his investment holdings in an interview with PBS News Hour in 2009, the first thing out of Merton’s mouth was the global index fund that he owns. It charges eight basis points. That’s just a fancy way of saying that the hidden annual fee for his index is 0.08 percent.
The average retail investor working with a financial adviser pays between 12 to 30 times more than that in fees. These fees can cost hundreds of thousands of dollars over an investment lifetime. I’ll show you how to get your investment fees down very close to what Robert Merton pays. By doing so, you’ll be able to learn from his mistakes.
More often (alas) the conclusions (supporting active management) can only be justified by assuming that the laws of arithmetic have been suspended for the convenience of those who choose to pursue careers as active managers.10
—William F. Sharpe, 1990 Nobel Prize in Economics
If you were lucky enough to have William Sharpe living across the street, he would tell you that he’s a huge proponent of index funds and suggest that financial advisers and mutual fund managers who pursue other forms of stock market investing are deluding themselves.11
If a financial adviser tries to tell you not to invest in index funds, they’re essentially suggesting that they’re smarter than Warren Buffett and more brilliant than a Nobel Prize Laureate in Economics. What do you think?
What Causes Experts to Shake Their Heads
Advisers get paid well when you buy actively managed mutual funds (or unit trusts, as they’re known outside of North America) so they love buying them for their clients’ accounts. Advisers rarely get paid anything (if at all) when you buy stock market indexes. That’s why they desperately try to steer their clients in another (more profitable) direction.
An actively managed mutual fund works like this:
- Your adviser takes your money and sends it to a fund company.
- That fund company combines your money with those of other investors into an active mutual fund.
- The fund company has a fund manager who buys and sells stocks within that fund hoping that their buying and selling will result in profits for investors.
While a total US stock market index owns nearly all the stocks in the US market all of the time, an active mutual fund manager buys and sells selected stocks repeatedly.
For example, an active mutual fund manager might buy Coca-Cola Company shares today, sell Microsoft shares tomorrow, buy the stock back next week, and buy and sell General Electric Company shares two or three times within a 12-month period.
It sounds strategic. But academic evidence suggests that, statistically, buying an actively managed mutual fund is a loser’s game when comparing it with buying index funds. Despite the strategic buying and selling of stocks by fund managers, the vast majority of actively managed mutual funds will lose to the indexes over the long term.
Economic Nobel Prize winner William F. Sharpe explained this in his Stanford published paper “The Arithmetic of Active Management.”12 Here’s his explanation in a nutshell.
When the US stock market moves up by, say, 8 percent in a given year, it means the average dollar invested in the stock market increased by 8 percent that year. When the US stock market drops by, say, 8 percent in a given year, it means the average dollar invested in the stock market dropped in value by 8 percent that year.
But does it mean that if the stock market made (hypothetically speaking) 8 percent last year, every investor in US stocks made an 8 percent return on their investments that year? Of course not. Some made more, some made less. In a year where the markets made 8 percent, half of the money that was invested in the market that year would have made more than 8 percent and half of the money invested in the markets would have made less than 8 percent. When averaging all the “successes” and “losses” (in terms of individual stocks moving up or down that year), the average return would have been 8 percent.
Most of the money that’s in the stock market comes from mutual funds (and index funds), pension funds, hedge funds and endowment money.
So if the markets made 8 percent this year, what do you think the average mutual fund, pension fund, hedge fund and college endowment fund would have made on their stock market assets during that year?
The answer, of course, is going to be very close to 8 percent. Before fees.
We know that a broad-based index fund would have made roughly 8 percent during this hypothetical year because it would own every stock in the market—giving it the “average” return of the market. There’s no mathematical possibility that a total stock market index can ever beat the return of the stock market. If the stock market makes 25 percent in a given year, a total stock market index fund would make about 24.8 percent after factoring in the small cost (about 0.2 percent) of running the index. If the stock market made 13 percent the following year, a total stock market index would make about 12.8 percent.
A financial adviser selling mutual funds seems, at first glance, to have a high prospect of getting his or her hand on your wallet right now. The adviser might suggest that earning the same return that the stock market makes (and not more) would represent an “average” return—and that he or she could beat the average return through purchasing superior actively managed mutual funds.
If actively managed mutual funds didn’t cost money to run, and if advisers worked for free, investors’ odds of finding funds that would beat the broad-based index would be close to 50–50. In a 15-year-long US study published in the Journal of Portfolio Management, actively managed stock market mutual funds were compared with the Standard & Poor’s 500 stock market index. The study concluded that 96 percent of actively managed mutual funds underperformed the US market index after fees, taxes, and survivorship bias.13
What’s a Survivorship Bias?
When a mutual fund performs terribly, it doesn’t typically attract new investors and many of its current customers flee the fund for healthier pastures. Often, the poorly performing fund is merged with another fund or it is shut down.
In November 2009, I underwent bone cancer surgery—where large pieces of three of my ribs were removed, as well as chunks of my vertebrae. But you want to know something? My five-year survivorship odds were better than that of the average mutual fund. Examining two decades of actively managed mutual fund data, investment researchers Robert Arnott, Andrew Berkin, and Jia Ye tracked 195 actively managed funds before reporting that the funds had a 17 percent mortality. According to the article they published with the Journal of Portfolio Management in 2000 called “How Well Have Taxable Investors Been Served in the 1980s and 1990s?,” 33 of the 195 funds they tracked disappeared between 1979 and 1999.14 No one can predict which funds are going to survive and which won’t. The odds of picking an actively managed fund that you think will survive are no better than predicting which bone cancer survivor will last the longest.
When the Best Funds Turn Malignant
You might think that the very best funds (those with long established track records) are large enough and strong enough to have a predictable longevity. They can’t suddenly turn sour and disappear, can they?
That’s what investors in the 44 Wall Street Fund thought. It was the top-ranked fund of the 1970s—outperforming every diversified fund in the industry and beating the S&P 500 index for 11 years in a row. Its success was temporary, however, and it went from being the best-performing fund in one decade to being the worst-performing fund in the next, losing 73 percent of its value in the 1980s. Consequently, its brand name was mud, so it was merged into the Cumberland Growth Fund in 1993, which then was merged into the Matterhorn Growth Fund in 1996. Today, it’s as if it never existed.15
Then there was the Lindner Large-Cap Fund, another stellar performer that attracted a huge following of investors as it beat the S&P 500 index for each of the 11 years from 1974 to 1984. But you won’t find it today. Over the next 18 years (from 1984 to 2002) it made its investors just 4.1 percent annually, compared with the 12.6 percent annual gain for investors in the S&P 500 index. Finally, the dismal track record of the Lindner Large-Cap Fund was erased when it was merged into the Hennessy Total Return Fund.16
You can read countless books on index-performance track records versus actively managed funds. Most say index funds have the advantage over 80 percent of actively managed funds over a period of 10 years or more. But they don’t typically account for survivorship bias (or taxes, which I’ll discuss later in this chapter) when making the comparisons. Doing so gives index funds an even larger advantage.
When accounting for fees, survivorship bias, and taxes, most actively managed mutual funds dramatically underperform index funds.
Mark Kritzman is president and chief executive of Windham Capital Management of Boston. He also teaches a graduate course in financial engineering at M.I.T.’s Sloan School of Management. In 2009, he calculated that the typical actively managed mutual fund, in a taxable account, would have to beat an index fund by an average of 4.3 percent per year, before fees and taxes, just to break even with an index fund. The New York Times reported his study in 2009.17
Holes in the Hulls of Actively Managed Mutual Funds
There are five factors dragging down the returns of actively managed US mutual funds: expense ratios, 12B1 fees, trading costs, sales commissions, and taxes. Many people ask me why they don’t see these fee liabilities mentioned on their mutual fund statements. With the possible exception of expense ratios and sales commissions—in very small print—the rest are hidden from view. Buying these products over an investment lifetime can be like entering a swimming race while towing a hunk of carpet.
1. Expense Ratios
Expense ratios are costs associated with running a mutual fund. You might not realize this, but if you buy an actively managed mutual fund, hidden fees pay the salaries of the analysts and/or traders to choose which stocks to buy and sell. These folks are some of the highest paid professionals in the world; as such, they are expensive to employ. There’s also the cost of maintaining their computers, paying office leases, ordering the paper they shuffle, using electricity, and compensating the advisers/salespeople for recommending their funds.
Then there are the owners of the fund company. They receive profits based on the costs skimmed from mutual fund expense ratios. I’m not referring to the average Joe who buys fund units in the mutual fund. I’m referring to the fund company’s owners.
A US fund that holds a collective $30 billion would cost its investors (the average Joe) about $450 million every year (or 1.5 percent of its total assets) in expense-ratio fees. That money is sifted out of the mutual fund’s value. But it isn’t itemized for investors to see.18 And the cash comes out whether the mutual fund makes money or not.
2. 12B1 Fees
Not every actively managed fund company charges 12B1 fees, but roughly 60 percent in the United States do. They can cost up to 0.25 percent, or a further $75 million a year for a $30 billion fund. These pay for marketing expenses including magazine, newspaper, television, and online advertising that’s meant to lure new investors. That money has to come from somewhere. So current investors pay for new investors to join the party.19 It’s like a masked phantom pulling money from the wallets of mutual fund investors every night. Financial advisory statements don’t itemize these expenses either.
3. Trading Costs
A third fee includes the fund’s trading costs. They fluctuate year to year, based on how much buying and selling the fund managers do. Remember, actively managed mutual funds have traders at the helm who buy and sell stocks within the fund to try and gain an edge. But on average, according to the global research company Lipper, the average actively managed stock market mutual fund accrues trading costs of 0.2 percent annually, or $60 million a year on a $30 billion fund.20 The costs of trading, 12B1 fees, and expense ratios aren’t the only invisible albatrosses around the necks of mutual fund investors.
4. Sales Commissions
If the three hidden fees above are bringing you back in time to the nightmarish bottom of an elementary school dog pile, I have worse news for you. Many fund companies charge load fees: either a percentage up front to buy the fund (which goes directly to the salesperson) or a fee to sell the fund (which also goes directly to the salesperson). These fees can be as high as 6 percent. Many financial advisers love selling “loaded funds,” which add a pretty nice kick to their own personal accounts. But they aren’t such a great deal for investors. A fund charging a sales fee of 5.75 percent, for example, has to gain 6.1 percent the following year just to break even on the deposited money. That might sound like strange math at first, but if you lose a given percentage to fees, you have to gain back a higher percentage to get your head back above water. For example, losing 50 percent in one year (turning $100 into $50) ensures that you will need to double your money the following year to get back to the original $100. Advisers choosing loaded funds for their clients put a whole new spin on “Piggy Bank,” don’t you think?
5. Taxes
More than 60 percent of the money in US mutual funds is in taxable accounts.21 This means when an actively managed mutual fund makes money in a given year, the investor has to pay taxes on that gain if the fund is held in a taxable account. There’s a reason for that. Actively managed stock market mutual funds have fund managers who buy and sell stocks within their funds. If the stocks they sell generate an overall profit for the fund, then the investors in that fund (if they hold the fund in a taxable account) get handed a tax bill at the end of the year for the realized capital gain. The more trading a fund manager does, the less tax efficient the fund is.
In the case of a total stock market index fund, there’s virtually no trading. The gains that are made on the stocks held don’t generate a taxable hit for the funds’ investors unless the investor sells the fund at a higher price than he or she paid. Rather than paying a high rate of capital gains tax every year, the index investor is able to defer his or her gains, paying them when he or she eventually sells the fund. Doing so allows for significantly higher compounding profits.
Mutual fund managers know that few people are going to compare their “after-tax” results with other mutual funds. For example, a fund making 11 percent a year might end up beating a fund making 12 percent a year—after taxes.22 What makes one fund less tax efficient than another? It’s the frequency of their buying and selling. The average actively managed mutual fund trades every stock it has during an average year. This is called a “100 percent turnover.”23 The trading practices of most mutual fund managers trigger short-term capital gains to the owners of those funds (when the funds make money). In the United States, the short-term capital gain tax is a hefty penalty. But few actively managed fund managers seem to care.
In comparison, index-fund investors pay far fewer taxes in taxable accounts because index funds follow a “buy and hold” strategy. The more trading that occurs within a mutual fund, the higher the taxes incurred by the investor.
In the Bogle Financial Markets Research Center’s 15-year study on after-tax mutual fund performances (from 1994 to 2009), it found actively managed stock market mutual funds were dramatically less tax efficient than a stock market index. For example, if you had invested in a fund (for your taxable account) that equaled the performance of the stock market index from 1994 to 2009, you would have paradoxically made less money than if you had invested in an index fund. But why would you have made less money if your fund had matched the performance of the stock index?
Before taxes, if your fund matched the performance of the US index, you would have averaged 6.7 percent per year. After taxes though, for the actively managed fund to make as much money as a US index fund, it would have needed to beat the index by a total of 16.2 percent over the 15-year period. This is assuming that the mutual fund manager bought and sold stocks with a regularity that equaled the average actively managed fund “turnover.”24
Let’s look at an actively managed fund with a track record of strong performance and low portfolio turnover (remember that performance is rarely sustainable). Fidelity’s Contrafund (FCNTX) fits the bill. When I accessed Morningstar, mid-2016, the fund ratings company posted the Fidelity Contrafund’s turnover at just 35 percent. That’s good. It’s far below the industry average. It means that the fund would have traded just 35 percent of its holdings the previous year.
By April 30, 2016, Fidelity’s Contrafund had earned an average pre-tax annual compound return of 11.57 percent over the previous three years. This beat the pre-tax return of Vanguard’s S&P 500 index. It averaged 11.09 percent per year during the same time period. But the index fund’s taxable turnover was just 3 percent. This gave it an after-tax advantage.
Morningstar estimated that the Fidelity Contrafund’s three-year, post-tax performance was 9.82 percent per year. Vanguard’s S&P 500 index did better. It averaged an estimated post-tax compound annual return of 10.38 percent per year.25
A post-tax comparison of a mutual fund’s performance against the performance of a stock market index isn’t something that you will likely see on a typical mutual fund statement. But the post-tax gain is the only number that should count. This also applies to Canadians and those of other nationalities who invest in taxable accounts.
Adding high expense ratios, 12B1 fees, trading costs, sales commissions, and taxes to your investment is a bit like a boxer standing blindfolded in a ring and asking his opponent to hit him five times on the jaw before the opening bell. It’s tough to put up a fair fight when you’re already bleeding.
Figure 3.1 illustrates that if you learned this in school, it’s likely that you would never consider investing in actively managed funds as an adult.
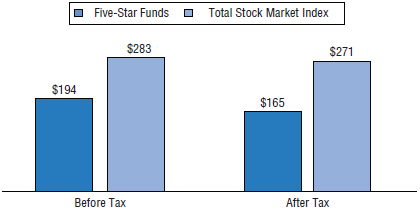
Figure 3.1 Five-Star Funds vs. Total Stock Market Index (1994–2004)
Source: John C. Bogle, The Little Book of Common Sense Investing
The Futility of Picking Top Mutual Funds
You’ve just told your financial adviser that you’d like to invest in index funds—and now she’s desperate. She won’t make money (or not much) if you invest in indexes. It’s far more lucrative for advisers to sell actively managed mutual funds instead. She needs you to buy the products for which she will be compensated handsomely, so here’s the card she plays:
“Look, I’m a professional. And our company has access to researchers who will help me choose actively managed funds that will beat the indexes. Just look at these top-rated funds. I can show you dozens of them that have beaten the stock market index over the past 10 years. Of course I would only buy you top-rated funds.”
Are there dozens of funds that have beaten the stock market indexes over the past 5, 10, or 15 years? Sure there are. But those funds, despite their track records, aren’t likely to repeat their winning streaks. Mutual fund investing is a rare example of how, paradoxically, historical excellence means nothing.
Reality Check
Morningstar is an investment-research firm in the United States that awards funds based on a five-star system: five stars for a fund with a remarkable track record, all the way down to one star for a fund with a poor track record. Five-star funds tend to be those that have beaten the indexes over the previous five or ten years.
The problem is that fund rankings change all the time, and so do fund performances. Just because a fund has a five-star rating today doesn’t mean that it will outperform the index over the next year, five years, or 10 years. It’s easy to look back in time and see great performing funds, but trying to pick them based on their historical performance is an expensive game.
Academics refer to something they call “reversion to the mean.” In practical terms, actively managed funds that outperform the indexes typically revert to the mean or worse. In other words, buying the top historically performing funds can end up being the kiss of death.
If an adviser had decided to purchase Morningstar’s five-star rated funds for you in 1994, and if he sold them as the funds slipped in the rankings (replacing them with the newly selected five-star funds), how do you think the investor would have performed from 1994 to 2004 compared with a broad-based US stock market index fund?
Thanks to Hulbert’s Financial Digest, an investment newsletter that rates the performance predictions of other newsletters, we have the answer. It’s emphasized in Figure 3.1.
One hundred dollars invested and continually adjusted to only hold the highest rated Morningstar funds from 1994 to 2004 would have turned into roughly $194. It would have averaged 6.9 percent per year in a tax-deferred portfolio.
One hundred dollars invested in a broad-based US stock market index from 1994 to 2004 would have turned into roughly $283. It would have averaged 11 percent per year in a tax-deferred portfolio.26
Many investors invest more than what their tax-deferred accounts will allow each year. To do so, they must invest in a taxable account. In such accounts, the after-tax performance difference between an actively managed fund and an index grows even wider. You might as well be running with a monkey on your back.
One hundred dollars invested and continually adjusted to hold only the highest rated Morningstar funds from 1994 to 2004 would have turned into roughly $165 in a taxable account. After taxes, it would have averaged 5.15 percent per year.
One hundred dollars invested in a broad-based US stock market index from 1994 to 2004 would have turned into roughly $271 in a taxable account. After taxes, it would have averaged 10.5 percent per year.
Interestingly, more than 98 percent of invested mutual fund money gets pushed into Morningstar’s top-rated funds.27
But choosing which actively managed mutual fund will perform well in the future is, in Burton Malkiel’s words, “. . . like an obstacle course through hell’s kitchen.”28 Malkiel, a professor of economics at Princeton University and the bestselling author of A Random Walk Guide to Investing, adds:
There is no way to choose the best [actively managed mutual fund ] managers in advance. I have calculated the results of employing strategies of buying the funds with the best recent-year performance, best recent two-year performance, best five-year and ten-year performance, and not one of these strategies produced above average returns. I calculated the returns from buying the best funds selected by Forbes magazine . . . and found that these funds subsequently produced below average returns.29
Studies routinely show that you can’t pick winning mutual funds based on how they performed last month, last year, or over the past decade. Funds that win during one time period usually get thumped the next.
The SPIVA Persistence Scorecard gets published twice a year. It looks at actively managed funds that are among the top 25 percent of performers. Then it determines what percentage of those funds remains among the top 25 percent of performers. There were 682 US stock market funds among the top 25 percent of performers as of March 2013. By March 2015, just 5.28 percent of them remained among the top quartile. Look for these reports every six months. They always present a similar eye-opening tale.30
Many financial writers wish for one thing at Christmas. They want their readers to suffer from classic, daytime soap opera amnesia. Steve Forbes should know. The publishing executive for Forbes magazine said, “You make more money selling advice than following it. It’s one of the things we count on in the magazine business—along with the short memory of our readers.”31
Take the article written by Business Insider’s Nick Levis on July 20, 2011.32 He boldly pumped “7 Top Mutual Funds with Long Term Solid Track Records.” None were stock market indexes. That would be boring. Instead, he promoted cotton candy over broccoli.
He chose seven actively managed mutual funds with strong historical track records. I asked Russel Kinnel, Morningstar’s director of mutual fund research, what to look for when picking mutual funds that we hoped would do well in the future. He said, “Low fees are the best predictor. . . so go with a low-fee fund every time.”33 The funds with the lowest fees, of course, are indexes. That’s why Warren Buffett instructed his estate’s trustees to put his heirs’ proceeds into index funds when he dies.
Those following Nick Levis’s advice, however, are likely crying over their wallets. Since the article was published, the S&P 500 has scorched all seven of his recommendations. According to Morningstar, investors splitting $10,000 evenly into each of the former hot tickets would have seen their money grow to $12,219 by November 13, 2015. By comparison, a $10,000 investment in Vanguard’s S&P 500 index fund would have been worth 36 percent more. It would have grown to $16,625.34
Academics call this “reversion to the mean.” Winning funds rarely continue to win. And when they disappoint, investors pay the price. By the end of 2015, the S&P 500 had a better 5-year track record than each of Mr. Levis’s former hot funds. The index also reported a better 10-year track record.
I don’t mean to pick on Mr. Levis. Finance writers need to push a bit of excitement. That’s their bread and butter. A Fortune magazine writer once said, “By day, we write about, ‘Six Funds to Buy NOW!’. . . By night, we invest in sensible index funds. Unfortunately, pro-index fund stories don’t sell magazines.”35
When Best Mutual Fund Lists Can Strip You Naked
Here’s an example from May 2010. US News and World Report published, “The 100 Best Mutual Funds for the Long Term.” Each year, most finance magazines publish something similar. They should carry x-rated warnings.
The writer’s opening line stated, “When it comes to choosing a mutual fund, there’s nothing better than a solid track record.” This would shock most mutual fund academics.
It’s like saying, “When it comes to running on glass, nothing beats bare feet.” “The 100 Best Mutual Funds for the Long Term” listed 50 US stock market mutual funds (the remaining 50 were bond funds, balanced funds, and international funds). US News broke them into five different categories: Value, Growth, Small-Cap, Mid-Cap, and Large-Cap.
The author wrote:
We chose funds with positive 10-year trailing returns and, for stock funds, names that beat the S&P 500 over that time frame. . . . Our score is based on the ratings of some of the mutual fund industry’s best-known analysts . . .36
He should have written:
We have ignored financial academic studies. Instead, we chose yesterday’s winning funds and fortunetellers’ picks. Those purchasing these funds will likely underperform their respective benchmark indexes by an average of 2.31 percent per year. Over a 30-year period, a retirement nest egg’s potential could be reduced by a third.
Where am I getting this 2.31 percent? I tore at the forecaster’s toga. I used portfoliovisualizer.com to see how these recommended funds performed since the article’s May 2010 publication.
Some of the funds changed names (as a result of poor performance, company mergers, or acquisitions). But with the exception of the Madison Mosaic Disciplined Equity Fund, I tracked down every one. Keep in mind, these were index-beating funds when US News had listed them.
But after the article was published, index funds crushed them in all five categories. The recommended value funds, listed on Figure 3.2, averaged a compound annual return of 8.77 percent between May 2010 and May 2016. Vanguard’s Value Index (VIVAX) averaged a compound annual return of 11.13 percent during the same time period.
| Ticker | Name |
| YACKX | AMG Yacktman Fund |
| ACGIX | Invesco Growth & Income Fund Class A |
| EQTIX | Shelton Core Value Fund Class S |
| AMANX | Amana Mutual Funds Trust - Income Fund |
| VAFGX | Valley Forge Fund, Inc. |
| FVALX | Forester Value Fund |
| FDSAX | Focused Dividend Strategy Portfolio Class A |
| AGOCX | Prudential Jennison Equity Income Fund Class C |
| AUXFX | Auxier Focus Fd Investor Shares |
| HOVLX | Homestead Funds, Inc. - Value Fund |
Figure 3.2 US News and World Report: Recommended US Value Funds
Source: US News and World Report; portfoliovisualizer.com
The writer’s US Growth fund recommendations, listed in Figure 3.3, averaged a compound annual return of 10.73 percent per year. Vanguard’s Growth Index (VIGRX) stomped them. It averaged a compound annual return of 12.35 percent.
| Ticker | Name |
| JENSX | Jensen Quality Growth Fund Cl J |
| FKGRX | Franklin Growth Fund Class A |
| LHGFX | American Beacon Holland Large Cap Growth Fd Inv Cl |
| VHCOX | Vanguard Capital Opportunity Fund |
| PTWAX | Prudential Jennison 20/20 Focus Fund Class A |
| FCNTX | Fidelity Contra Fund |
| PROVX | Provident Trust Strategy Fund |
| MINVX | Madison Investors Fund Cl Y |
| BUFEX | Buffalo Large Cap Fund, Inc. |
| AMCPX | AMCAP Fund, Class A Shares A |
Figure 3.3 US News and World Report: Recommended US Growth Funds
Source: US News and World Report; portfoliovisualizer.com
The recommended US Small Cap stock market funds, listed in Figure 3.4, really got thumped. They averaged a compound annual return of 8.39 percent per year. Vanguard’s Small Cap Index (NAESX) averaged a compound annual return of 10.79 percent per year.
| Ticker | Name |
| RYOTX | Royce Micro-Cap Fund Investment Class |
| FSLCX | Fidelity Commonwealth Trust Fidelity Small Cap Stock Fund |
| OTCFX | T. Rowe Price Small-Cap Stock Fund |
| RGFAX | Royce Heritage Fund Service Class |
| FOSCX | Tributary Small Company Fd Instl |
| LZSCX | Lazard US Small-Mid Cap Equity Portfolio Institutional Shares |
| LRSCX | Lord Abbett Research Fund, Inc. - Small-Cap Series - A Shares |
| PENNX | Royce Pennsylvania Mutual Fd, Investment Class |
| BVAOX | Broadview Opportunity Fund |
| NBGNX | Neuberger Berman Genesis Fd |
Figure 3.4 US News and World Report: Recommended US Small-Cap Funds
Source: US News and World Report; portfoliovisualizer.com
The recommended Mid-Cap stock funds also dragged the market. Listed in Figure 3.5, they averaged a compound annual return of 9.71 percent. Vanguard’s US Mid-Cap Index (VIMSX) averaged a compound annual return of 11.69 percent.
| Ticker | Name |
| WPFRX | Westport Fd Cl R |
| FLPSX | Fidelity Low-Priced Stock Fund |
| CHTTX | Anton/Fairpointe Mid Cap Fund Class N |
| FMIMX | FMI Common Stock Fund |
| WPSRX | The Westport Select Cap Fund Class R |
| CAAPX | Ariel Appreciation Fund Investor Cl |
| GTAGX | Invesco Mid Cap Core Equity Fund Class A |
| DMCVX | Dreyfus Opportunistic Midcap Value Fund Class A |
| SPMIX | S&P MidCap Index Fund Class S |
| PESPX | Dreyfus Midcap Index Fund |
Figure 3.5 US News and World Report: Recommended US Mid-Cap Funds
Source: US News and World Report; portfoliovisualizer.com
They also recommended the 10 US Large-Cap funds in Figure 3.6. One is missing in action, so I averaged the returns of the nine that remain. As a group, they performed poorly. They averaged a compound annual return of 8.77 percent between May 2010 and May 2016. Vanguard’s Large-Cap Index (VLISX) averaged a compound annual return of 11.73 percent. Vanguard’s S&P 500 Index (VFINX) averaged 11.86 percent.
| Ticker | Name |
| FAIRX | Fairholme Fd |
| PRBLX | Parnassus Core Equity Fund-Investor Shares |
| OAKMX | Oakmark Fund Cl I |
| PBFDX | Payson Total Return |
| ACEHX | Invesco Exchange Fund Shs |
| MPGFX | Mairs & Power Growth Fund |
| EXTAX | Manning & Napier Fd, Inc. Tax Managed Srs Cl A |
| CLVFX | Croft Value Fd Cl R |
| HEQFX | Henssler Equity Fund |
| YACKX | AMG Yacktman Fund |
Figure 3.6 US News and World Report: Recommended US Large-Cap Funds
Source: US News and World Report; portfoliovisualizer.com
As seen in Figure 3.7, the five categories of recommended US stock market funds underperformed their benchmark indexes by 2.31 percent annually over the six years ending May 2016. That’s far worse than the typical actively managed fund performed during the same time period. So much for forecasts.
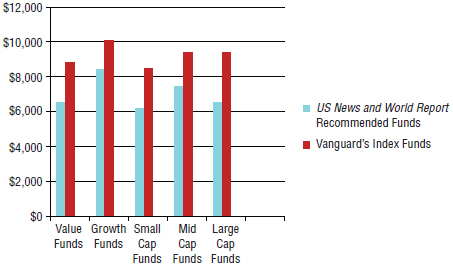
Figure 3.7 US News and World Report’s Recommended US Stock Funds Versus Benchmark Index Funds: Six-Year Profits Made on a $10,000 Investment, May 2010–May 2016
Source: US News and World Reports; portfoliovisualizer.com
Most of these funds won’t appear in a future story of “Mutual Funds to Buy!” Many financial advisers will also pass them over.
Instead, many writers and advisers will search out the funds that beat the indexes during the most recent year or decade. The cycle will repeat. Investors, who follow such suggestions, will be those who pay the price.
Jason Zweig, however, probably said it best. The Wall Street Journal writer published an excellent book, Your Money and Your Brain. In it, he wrote, “The ancient Scythians discouraged frivolous prophecies by burning to death any soothsayer whose predictions failed to come true.”37 He added that investors might be better off if modern forms of divination were held to biblical standards.
His theme echoes what Warren Buffett once said. People will pay a lot more money to be entertained than they will to be educated.
Still, most financial advisers won’t give up. Their livelihood depends on you believing that they can find mutual funds that will beat the market indexes.
Before we were married, my wife Pele was being “helped” by the US-based financial services company Raymond James. They sold her actively managed mutual funds. On top of the standard, hidden mutual fund fees, she was charged an additional 1.75 percent of her account value every year. An ongoing annual fee such as this—called a wrap fee, adviser fee, or account fee—is like a package of arsenic-laced cookies sold at your local health food store. Why did her adviser charge this extra fee? Let’s just say the adviser was servicing my wife the way the infamous Jesse James used to service train passengers—by taking the money and running.
According to a 2007 article published in the US weekly industry newspaper Investment News, Raymond James representatives are rewarded more for generating higher fees:
In the style of a 401(k) plan, the new deferred-compensation program this year gives a bonus of 1 percent to affiliated [Raymond James] reps who produce $450,000 in fees and commissions, a 2 percent bonus for $750,000 producers, and 3 percent for reps and advisers who produce $1 million.38
The article adds that Raymond James pays advisers a percentage point bonus for every additional $500,000 that’s produced for the firm. It tops out at a 10 percent bonus for advisers who produce $3.5 million in fees and commissions. With pilfering incentives like these, salespeople and advisers make out like sultans.
Looking at my wife’s investment portfolio in 2004, after tracking her account’s performance, I calculated that her $200,000 account would have been $20,000 better off if she had been with an index fund over the previous five years, instead of with her adviser’s actively managed mutual funds. In my calculation, I included the 1.75 percent annual “fleecing” fee her adviser charged, on top of the mutual funds’ regular expenses.
When Pele asked her adviser about her account’s relatively poor performance, he suggested some new mutual funds. When Pele asked about index funds, he dismissed the idea. Perhaps he had his eye on a big prize: a Porsche or an Audi convertible. He couldn’t afford either if he bought his client index funds. So he switched her into a group of different actively managed funds that had beaten the indexes over the previous five years—all had Morningstar five-star ratings.
And how did those new funds do from 2004 to 2007? Badly. Despite the strong track records of those funds, they performed poorly, relative to the market indexes, after he selected them for Pele’s account. So Pele fired the guy, and I married Pele.
Over an investment lifetime, it’s a virtual certainty that a portfolio of index funds will beat a portfolio of actively managed mutual funds, after all expenses. But over a one-, three-, or even a five-year period, there’s always a chance that a person’s actively managed funds will outperform the indexes.
At a seminar I gave in 2010, a man I’ll call Charlie, after seeing the returns of an index-based portfolio, said: “My investment adviser has beaten those returns over the past five years.”
That’s possible. But the statistical realities are clear. Over his investment lifetime, the odds are that Charlie’s account will fall far behind an indexed portfolio.
In July 1993, The New York Times decided to run a 20-year contest pitting high-profile financial advisers (and their mutual fund selections) against the returns of the S&P 500 stock market index.
Every three months, the newspaper would report the results, as if the money were invested in tax-free accounts. The advisers were allowed to switch their funds, at no cost, whenever they wished.
What started out as a great publicity coup for these high-profile moneymen quickly turned into what must have felt like a quarterly tarring and feathering. After just seven years, the S&P 500 index was like a Ferrari to the advisers’ Hyundai Sonatas, as revealed in Figure 3.8

Figure 3.8 The New York Times Investment Contest
An initial $50,000 with the index fund in 1993 (compared with the following respective advisers’ mutual fund selections) would have turned into the preceding sums by 2000.39
Mysteriously, after just seven years, The New York Times discontinued the contest. Perhaps the competitive advisers in the study grew tired of the humiliation.
What’s Under the Hood of an Index Fund?
Perhaps the best way to understand the differences between an actively managed mutual fund and an index fund is to put them side by side.
Table 3.1 has a point-by-point comparison.
Table 3.1 Differences between Actively Managed Funds and Index Funds
| Actively Managed Mutual Funds | Total Stock Market Index Fund |
| 1. A fund manager buys and sells (trades) dozens or hundreds of stocks. The average fund has very few of the same stocks at the end of the year that it held at the beginning of the year. | 1. A fund manager buys a large group of stocks—often more than a thousand. More than 96 percent of the stocks are the same from one year to the next. No “trading” occurs. Poor businesses that get dropped from the stock exchange get dropped from the index. New businesses get added. |
| 2. The fund manager and his or her team conduct extensive research. Their high salaries compensate them for this service, adding to the cost of the fund. This added cost is paid by investors. | 2. No research is done on individual stocks. A total market index fund can literally be run by a computer with no research costs. Its goal is to virtually own everything on the stock market so there are no “trading” decisions to make. |
| 3. Stock trading (the buying and selling of stocks) within the fund generates commission expenses, which are taken out of the value of the mutual fund. The investors pay for these. | 3. Because there’s no “trading” involved, commissions for buying and/or selling are extremely low. The savings are passed down to investors. |
| 4. Trading triggers tax consequences that are passed down to the investor when the fund is held in a taxable account. The taxman sends you a bill. | 4. The lack of trading means that, even in a taxable account, capital gains can grow with minimal annual taxation. You keep the taxman at bay. |
| 5. The fund manager focuses on certain stock sizes and sectors. For example, a small-cap fund would own small companies only; a large-cap fund would own large companies only; a value fund would own cheap companies only; a growth fund would own growth companies only. | 5. A total stock market index would own stock in every category listed on the left—all wrapped up into one fund—because it owns “the entire stock market.” |
| 6. Companies offering mutual funds have owners who profit from the funds’ fees. More fees raked from investors mean higher profits for the fund company’s owners. | 6. A fund company such as Vanguard is a “nonprofit” company. Vanguard is the world’s largest provider of index funds, serving Americans, Australians, and the British. Low-cost indexes are also available to Asians, Canadians, and Europeans. |
| 7. Because mutual fund companies have “owners” who seek profits for their fund company, there are aggressive sales campaigns and incentives paid to salespeople (advisers) to recommend their funds for clients. Investors pay for these. | 7. Salespeople rarely tout indexes because they are less profitable for financial service companies to sell. |
| 8. Actively managed fund companies pay annual “trailer fees” to advisers, rewarding them for selling their funds to investors—who end up paying for these. | 8. Index funds rarely pay trailer fees to advisers. |
| 9. Most US fund companies charge sales or redemption fees—which go directly to the broker/adviser who sold you the fund. The investor pays for these. | 9. Most index funds do not charge sales or redemption fees. |
| 10. Actively managed mutual fund companies are extremely well liked by advisers and brokers. | 10. Index funds are not well liked by most advisers and brokers. |
Captain America Calls for Government Action
David Swensen is one of America’s most famous investors. He runs Yale University’s endowment fund. Like the marvel comic hero Captain America, he fights for justice. In this case, he rallies against high mutual fund fees. In his book, Unconventional Success, he wrote, “The fund industry’s systemic exploitation of individual investors requires government action.”40
As high as US actively managed stock mutual fund costs can run, the average non-US fund is even more expensive. In a study presented in 2008 by Oxford University Press, Ajay Khorana, Henri Servaes, and Peter Tufano compared international fund costs, including estimated sales fees. According to the study, the country with the most expensive stock market mutual funds is Canada.41
High global investment costs make it even more important for global citizens outside of the United States to buy indexes for their investment accounts rather than pay the heavy fees associated with actively managed mutual funds.
In June 2015, Morningstar published its Global Fund Investor Experience Study. Country cost rankings hadn’t changed much since the 2008 study, “Mutual Fund Fees Around the World.”
Investors who buy actively managed funds in Canada and India end up the biggest losers. Not including the damages of sales commissions (which were included in the Oxford University Press study in Table 3.2), Canadian and Indian investors are still paying more than 2 percent per year in mutual fund fees.42
Table 3.2 The World’s Actively Managed Stock Market Mutual Fund Fees
| Country | Total Estimated Expenses, Including Sales Costs | Ranking of Least Expensive to Most Expensive Actively Managed Funds |
| Netherlands | 0.82% | #1 |
| Australia | 1.41% | #2 |
| Sweden | 1.51% | #3 |
| United States | 1.53% | #4 |
| Belgium | 1.76% | #5 |
| Denmark | 1.85% | #6 |
| France | 1.88% | #7 |
| Finland | 1.91% | #8 |
| Germany | 1.97% | #9 |
| Switzerland | 2.03% | #10 |
| Austria | 2.26% | #11 |
| United Kingdom | 2.28% | #12 |
| Ireland (Dublin) | 2.40% | #13 |
| Norway | 2.43% | #14 |
| Italy | 2.44% | #15 |
| Luxembourg | 2.63% | #16 |
| Spain | 2.70% | #17 |
| Canada | 3.00% | #18 |
Source: “Mutual Fund Fees Around the World,” Oxford University Press, 2008
Sadly, actively managed mutual fund investors from Belgium, China, Denmark, Finland, France, Germany, Hong Kong, Italy, Korea, Norway, Singapore, South Africa, Spain, Sweden, Taiwan, Thailand, and the United Kingdom aren’t far behind. Not including sales commissions, the Morningstar study pegs their actively managed mutual fund costs at 1.75 to 2.0 percent per year.43 After accounting for sales commissions, most of them pay much more.
Who’s Arguing against Indexes?
There are three types of people who argue that a portfolio of actively managed funds has a better chance of keeping pace with a diversified portfolio of indexes after taxes and fees over the long term.
Introduced first, dancing across the stage of improbability is your friendly neighborhood financial adviser. Pulling all kinds of tricks out of his bag, he needs to convince you that the world is flat, that the sun revolves around the Earth, and that he is better at predicting the future than a gypsy at a carnival. Mentioning index funds to him is like somebody sneezing on his birthday cake. He wants to eat that cake, and he wants a chunk of your cake, too.
He exits, stage left, and a bigger hotshot strolls in front of the captive audience. Wearing a professionally pressed suit, she works for a financial advisory public relations department. Part of her job is to compose confusing market-summary commentaries that often accompany mutual fund statements. They read something like this:
Stocks fell this month because retail sales were off 2.5 percent, creating a surplus of gold buyers over denim, which will likely raise Chinese futures on the backs of the growing federal deficit, which caused two Wall Street Bankers to streak through Central Park because of the narrowing bond yield curve.
Saying stock markets rose this year because more polar bears were able to find suitable mates before November has as much merit as the confusing economic drivel that these representatives write and distribute.
If you ask her, she will tell you that actively managed mutual funds are the way to go. But she won’t mention the killer mortgage payments on her $17 million Hawaiian beachside summer home. You need to help her pay it.
Sadly, the third type of person who might tell you actively managed mutual funds have a better statistical long-term chance at profit (over indexes) are the prideful, or gullible, folks who won’t want to admit their advisers put their own financial interests above their clients.
Let’s consider Peter Lynch, the man who was arguably one of history’s greatest mutual fund managers. Before retiring at age 46, he managed the Fidelity Magellan fund, which captured public interest as it averaged 29 percent a year from 1977 to 1990.44 Since then, however, Lynch’s former fund has disappointed investors. If $10,000 were invested in the fund in January 1990, it would have grown to $83,640 by May 16, 2016.45 The same $10,000 invested in Vanguard’s S&P 500 Index Fund would have grown to $99,760. Hammering the industry’s faults, Peter Lynch says:
So it’s getting worse, the deterioration by professionals is getting worse. The public would be better off in an index fund.46
As the industry’s idol from the 1980s, you might suggest that Lynch is a relic of a bygone era. Perhaps. But let’s turn our attention forward and look at Bill Miller. He was the fund manager of Legg Mason Value Trust. In 2006, Fortune magazine writer Andy Serwer called Miller “the greatest money manager of our time,” after Miller’s fund had beaten the S&P 500 index for the fifteenth straight year.47 Yet, when Money magazine’s Jason Zweig interviewed Miller in July 2007, Miller recommended index funds:
[A] significant portion of one’s assets in equities should be comprised of index funds. . . . Unless you are lucky, or extremely skillful in the selection of managers, you’re going to have a much better experience going with the index fund.48
Miller’s quote was timely. Since 2007, his fund has performed horribly. Between January 2007 and May 17, 2016 (the time of this writing), it gained a total of 2.6 percent. During the same time period, Vanguard’s S&P 500 index gained 78.2 percent.49
Poor performing funds often change their names. Such was the case with Bill Miller’s Legg Mason Value Trust. Miller was once considered “the greatest money manager of our time.” But today, the fund’s name brings nothing but pain. In 2011, Miller stepped down.50 The fund is now called ClearBridge Value Trust.51
Some mutual fund managers, of course (these are people who actually run the funds), are required by their employers to buy shares in the funds they run. But in taxable accounts—if fund managers don’t have to commit their own money, they generally won’t. Ted Aronson actively manages more than $7 billion for retirement portfolios, endowments, and corporate pension fund accounts. He’s one of the best in the business. But what does he do with his own taxable money? As he told Jason Zweig, who was writing for CNN Money in 1999, all of his taxable money is invested with Vanguard’s index funds:
Once you throw in taxes, it just skewers the argument for active [mutual fund] management . . . indexing wins hands-down. After tax, active management just can’t win.52
Or, in the words of a real heavy hitter, Arthur Levitt, former chairman of the US Securities and Exchange Commission:
The deadliest sin of all is the high cost of owning some mutual funds. What might seem to be low fees, expressed in tenths of 1 percent, can easily cost an investor tens of thousands of dollars over a lifetime.53
You don’t have to be disappointed with your investment results. With disciplined savings and a willingness to invest regularly in low-cost, tax-efficient index funds, you can feasibly invest half of what your neighbors invest—over your lifetime—while still ending up with more money.
You may not have learned these lessons in school. But you can learn them now.
- Index fund investing will provide the highest statistical chance of success, compared with actively managed mutual fund investing.
- Nobody yet has devised a system of choosing which actively managed mutual funds will consistently beat stock market indexes. Ignore people who suggest otherwise.
- Don’t be impressed by the historical returns of any actively managed mutual fund. Choosing to invest in a fund based on its past performance is one of the silliest things an investor can do.
- Index funds extend their superiority over actively managed funds when the invested money is in a taxable account.
- Remember the conflict of interest that most advisers face. They don’t want you to buy index funds because they (the brokers) make far more money in commissions and trailer fees when they convince you to buy actively managed funds.