RULE 4
Conquer the Enemy in the Mirror
My brother Ian is a huge fan of the 1999 movie Fight Club, particularly the scene where the lead character Tyler, played by Edward Norton, is shown throwing haymaker punches at his own swollen face. Norton’s character is metaphorically battling his materialistic urges. Most investors fight similar battles in a war against themselves.
Much of that internal grappling comes from misunderstanding the stock market. I can’t promise to collar your inner doppelganger. But when you understand how the stock market works—and how human emotions can sabotage the best-laid plans—you’ll become a better investor.
When a 10 Percent Gain Isn’t a 10 Percent Gain
Imagine a mutual fund that has averaged 10 percent a year over the past 20 years after all fees and expenses. Some years it might have lost money; other years it might have profited beyond expectation. It’s a roller coaster ride, right? But imagine, on average, that it gained 10 percent annually even after the bumps, rises, twists, and turns. If you found a thousand investors who had invested in that fund from 1996 to 2016, you would expect that each would have netted a 10 percent annual return.
On average, however, they wouldn’t have made anything close to that. When the fund had a couple of bad years, most investors react by putting less money in the fund or they stop contributing to it entirely. Many investment advisers would say: “This fund hasn’t been doing well lately. Because we’re looking after your best interests, we’re going to move your money to another fund that is doing better at the moment.” And when the fund had a great year, most individual investors and financial advisers scramble to put more money in the fund, like feral cats around a fat salmon.
This behavior is self-destructive. They sell or cease to buy after the fund becomes cheap, and they buy like lunatics when the fund becomes expensive. If there weren’t so many people doing it, we would call it a “disorder” and name it after some dead Teutonic psychologist. This kind of investment behavior ensures that investors pay higher-than-average prices for their funds over time. Whether it’s an index fund or an actively managed mutual fund, most investors perform worse than the funds they own—because they like to buy high, and they hate buying low. That’s a pity.
Morningstar says most investors do this. In a 2014 study, they looked at average mutual fund returns over the 10-year period ending December 31, 2013. The typical fund averaged 7.3 percent per year after fees. The typical fund investor averaged 4.8 percent per year.1
Their fear of low prices prevented them from buying when the funds were low, while their elation at high prices encouraged purchases when fund prices were high. Such bizarre behavior has devastating consequences.
Over a 30-year period, the financial difference would be huge:
- $500 invested per month at 7.3 percent a year for 30 years = $641,971
- $500 invested per month at 4.8 percent a year for 30 years = $403,699
- Cost of irrationality = $238,272
What If You Didn’t Care What the Stock Market Was Doing?
As investors, you really don’t have to watch the stock market to see if it’s going up or down. In fact, if you bought a market index fund for 25 years, with an equal dollar amount going into that fund each month (called “dollar-cost averaging”) and if that fund averaged 10 percent annually, you would have averaged 10 percent or more. Why more?
If the stock market crashes, dollar cost averaging could actually juice returns. Here’s an example.
Assume that somebody started to invest $100 into Vanguard’s US Total Stock Market Index in January 2008. We know what came next: the crash of 2008–2009. You can see it on Figure 4.1. Stocks fell hard in 2008. Part way through 2009, stocks began to recover. But by January 2011, the market was still below its January 2008 level. You can see the chart below.
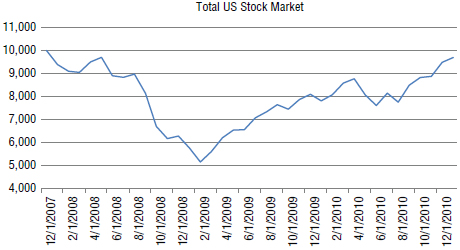
Figure 4.1 Vanguard’s US Stock Market Index: January 2008–January 2011
Source: © The Vanguard Group, Inc., used with permission
Investors who started to invest in January 2008 might curse their bad luck. But if they stuck to the plan and dollar-cost averaged, they would have done okay.
If they added $100 a month between January 2008 and January 2011, they would have added a total of $3,600. But their investment would have grown to a value of $4,886.2
If the investors had continued to add $100 a month until August 2016 (the time of this writing), they would have added a total of $9,200 since January 2008. Their investment would have grown to $19,228.
By adding equal dollar sums to their index each month, the investors would have bought a greater number of units when the markets were low and fewer units when the market rose. This allowed them to pay a below-average price over time.
Much will depend on the stock market’s volatility. If stocks bounce around a lot, investors who dollar-cost average get rewarded for their discipline—they can actually beat the return of their index. If stock market returns are more stable, someone who dollar-cost averages will still do well—but they won’t beat the market’s return.
Few investors, however, stick to a disciplined plan. Most underperform their funds.
Most Investors Exhibit Nutty Behavior
Combine the crazy behavior of the average investor with the fees associated with actively managed mutual funds. The average investor ends up with a comparatively puny portfolio compared with the disciplined investor who puts in the same amount of money every month into index funds. Table 4.1 categorizes investors who will be working—and adding to their investments—for at least the next five years.
Table 4.1 The Average Investor Compared with the Evolved Investor
| The Average Investor | The Evolved Investor |
| Buys actively managed mutual funds. | Buys index funds. |
| Feels good about his or her fund when the price increases so buys more of it. | Buys equal dollar amounts of the indexes and knows, happily, that this buys fewer units as the stock market rises. |
| Feels bad about his or her fund when the price decreases, so the person limits purchases or sells the fund. | Loves to see the stock index fall in value. If he or she has the money, the person increases purchases. |
I’m not going to suggest that all indexed investors are evolved enough to ignore the market’s fearful roller coaster while shunning the self-sabotaging caused by fear and greed. But if you can learn to invest regularly in indexes and remain calm when the markets fly upward or downward, you’ll grow far wealthier. In Table 4.2, you can see examples based on actual US returns between 1980 and 2005.
Table 4.2 Historical Differences Between the Average Investor and the Evolved Investor
| The Average Investor | The Evolved Investor |
| $100 a month invested from 1980 to 2005 in the average US mutual fund (roughly $3.33 a day). 10% annual average. | $100 a month invested from 1980 to 2005 in the US stock market index (roughly $3.33 a day). 12.3% annual average. |
| Minus 2.7% annually for the average investor’s self-sabotaging behavior. | No deficit for silly behavior. |
| 25-year average annual return for investors: 7.3% | 25-year average annual return for investors: 12.3% |
| Portfolio value after 25 years = $84,909.01 | Portfolio value after 25 years = $198,181.90 |
Note: Although the US stock market has averaged about 10 percent annually over the past 100 years, there are periods where it performs better and there are periods where it performs worse. From 1980 to 2005, the US stock market averaged slightly more than 12.3 percent a year.3
The figure on the left side ($84,909.01) is probably a little generous. The 10 percent annual return for the average actively managed fund has been historically overstated because it doesn’t include sales fees, adviser wrap fees, or the added liability of taxes in a taxable account.
Disciplined index investors who don’t self-sabotage their accounts can end up with a portfolio that’s easily twice as large as that of the average investor over a 25-year period.
Are Index Fund Investors Smarter?
Many financial advisers fall prey to the same weakness. Many like to recommend “hot” funds. They also sometimes think that they can time the market. There’s a US actively managed mutual fund company called American Funds. Investors can’t buy these funds directly. Such funds must be purchased through a financial adviser or broker. You might think that these professionals can advise investors to stay invested and not jump from fund to fund. But that isn’t the case.
Using data from Morningstar, I compared all of the firm’s funds with 10-year track records. I wanted to see how the funds had performed compared to how the funds’ investors had performed.
I examined four fund categories between October 31, 2004, and October 31, 2014. They included US Large Cap, Emerging Markets, Broad International, and Small Cap funds. When averaging investors’ returns in each of the four categories, I found that the American Fund investors underperformed their funds by an average of 1.75 percent per year. If the funds’ investors were rational, they would have earned the same returns as those posted by their funds.
For example, if a fund averaged 10 percent per year over a designated period, then the funds’ investors, over that same time period, should have done the same. But poor behavior (chasing winners, buying high and selling low) cost the American Funds’ investors 1.75 percent per year between October 31, 2004, and October 31, 2014. Once again, investors can’t buy these funds without an adviser. So much for the advisers’ smart guidance!
I made the same category comparisons with the fund company Fidelity. Investors can buy Fidelity’s funds without a financial adviser. But in many cases, financial advisers stuff Fidelity’s actively managed funds into client accounts. Comparing the same four categories over the same time period, Fidelity’s investors underperformed their funds by an average of 2.53 percent per year. As with the American Funds’ investors, they shot themselves in the feet.
Most index fund investors fly solo, without a financial adviser. When I compared the returns of Vanguard’s index fund investors over the same time period in the same four categories, they underperformed their funds by just 0.71 percent per year. Index fund investors didn’t behave perfectly. But they were far less foolish.
I detailed the findings in my December 2014 AssetBuilder article, “Are Index Fund Investors Simply Smarter?”4
Three and a half months later, The Wall Street Journal’s Jonathan Clements published a similar story, “Are Index Fund Investors Smarter?” He asked Morningstar to conduct a broader study. It revealed the same results. Index fund investors appeared to have more discipline. He also offered an explanation:
I suspect it is less about greater intelligence and more about greater conviction. When you buy an index fund, your only worry is the market’s performance. But when you buy an active fund, you have to worry about both the market’s direction and your fund’s performance relative to the market.5
Investors and advisers shouldn’t speculate. They should commit to staying invested. Such discipline, coupled with low-cost index funds, can allow people with middle-class incomes to amass wealth more effectively than their high-salaried neighbors—especially if the middle-class earners think twice about spending more than they can afford.
Even if your neighbors invest twice as much as you each month, if they are average, they will buy actively managed mutual funds. They will also either chase hot-performing funds or fail to keep a regular commitment to their investments when the markets fall. They’ll feel good about buying into the markets when they’re expensive. They won’t be as keen to buy when stocks are on sale.
Don’t be like your neighbors. Avoid that kind of self-destructive behavior and you’ll increase your odds of building wealth as an investor.
It’s Not Timing the Market That Matters; It’s Time in the Market
There are smart people (and people who aren’t so smart) who mistakenly think they can jump in and out of the stock market at opportune moments. It seems simple. Get in before the market rises and get out before the market drops. This is referred to as “market timing.” But most financial advisers have a better chance beating Roger Federer in a tennis match than effectively timing the market for your account.
Vanguard’s Bogle, who was named by Fortune magazine as one of the four investment giants of the twentieth century, has this to say about market timing:
After nearly 50 years in this business, I do not know of anybody who has done it successfully and consistently. I don’t even know anybody who knows anybody who has done it successfully and consistently.6
When the markets go raving mad, dramatically jumping in and out can be tempting. But stock markets are highly irrational and characterized by short-term swings. The stock market will often fly higher than most people expect during a euphoric phase, while plunging further than anticipated during times of economic duress. There’s a simple, annual, mechanical strategy that you can follow to protect your money from excessive crashes, which I’ll outline in Chapter 5. Your investment will still fall in value when the stock market falls, but not as much as your neighbor’s—and that can help you sleep when stocks go crazy.
The strategy that I’ll show you doesn’t involve trying to guess the stock market’s direction. Forecasting where it’s going to go over a short period is like trying to guess which frantic, nightly moth is going to get singed by the light bulb first.
Doing nothing but holding onto your total stock market index fund might sound boring during a financial boom. It might also sound terrifying during a financial meltdown. But the vast majority of people (including professionals) who jump in and out of the stock market end up paying the piper. They often end up buying high and selling low.
What Can You Miss by Guessing Wrong?
Studies show that most market moves are like the flu you got last year or like the mysterious $10 bill you found in the pocket of your jeans. In each case, you don’t see it coming. Even when looking back at the stock market’s biggest historical returns, Jeremy Siegel, a professor of business at University of Pennsylvania’s Wharton School, suggests that there’s no rhyme or reason when it comes to market activity. He looked back at the biggest stock market moves since 1885 (focusing on trading sessions where the markets moved by 5 percent or more in a single day). He tried to connect each of them to a world event.7
In most instances, he couldn’t find logical explanations for such large stock market movements—and he had the luxury of looking back in time and trying to match the market’s behavior with historical world news. If a smart man like Siegel can’t make connections between world events and the stock market movements with the benefit of hindsight, then how is someone supposed to predict future movements based on economic events—or the prediction of economic events to come?
If you’re ever convinced to act on somebody’s short-term stock market prediction, you could end up kicking yourself. Big stock market gains are usually concentrated during just a handful of trading days each year.
During the 20-year period between 1994 and 2013 (5,037 trading days), US stocks averaged a compound annual return of 9.22 percent. But investors who missed the best five trading days would have averaged just 7 percent per year. If they missed the best 20 days, their average return would have been just 3.02 percent per year. If they missed the best 40 trading days, the investor would have lost money. In Table 4.3, you can see the kind of effect it would have on your money.
Table 4.3 Costs of Speculation, 1994–2013
| Average Annual Return | $10,000 Would Have Grown To | |
| Stock Market’s Return | 9.22% | $58,352 |
| Best 5 Days Missed | 7% | $38,710 |
| Best 20 Days Missed | 3.02% | $18,131 |
| Best 40 Days Missed | –1.02% | $8,149 |
Source: IFA Advisors8
Markets can move so unpredictably and so quickly. If you take money out of the stock market for a day, a week, a month, or a year, you could miss the best trading days of the decade. You’ll never see them coming. They just happen. More important, as I said before, neither you nor your broker are going to be able to predict them.
Legendary investor and self-made billionaire Kenneth Fisher, has this to say about market timing:
Never forget how fast a market moves. Your annual return can come from just a few big moves. Do you know which days those will be? I sure don’t and I’ve been managing money for a third of a century.9
The easiest way to build a responsible, diversified investment account is with stock and bond index funds. I’ll discuss bond indexes in Chapter 5, but for now, just recognize them as instruments that generally create stability in a portfolio. Many people view them as boring because they don’t produce the same kind of long-term returns that stocks do. But they don’t fall like stocks do either. They’re the steadier, slower, and more dependable part of an investment portfolio. A responsible portfolio has a certain percentage allocated to the stock market and a certain percentage allocated to the bond market, with an increasing emphasis on bonds as the investor ages.
But when stocks start racing upward and everyone’s getting giddy on the profits they’re making, most people ignore their bonds (if they own any at all) and they buy more stocks. Many others chase whichever fund has recently done well.
How can you ensure that you’re never a victim? It’s far easier than you might think. If you understand exactly what stocks are—and what you can expect from them—you’ll fortify your odds of success.
On Stocks . . . What You Really Should Have Learned in School
The stock market is a collection of businesses. It isn’t just a squiggly bunch of lines on a chart or quotes in the newspaper. When you own shares in a stock market index fund, you own something that’s as real as the land you’re standing on. You become an indirect owner of all kinds of industries and businesses via the companies you own within your index: land, buildings, brand names, machinery, transportation systems, and products, to name a few. Just understanding this key concept can give you a huge advantage as an investor.
Business earnings and stock price growth are two separate things. But long term, they tend to reflect the same result. For example, if a business grew its profits by 1,000 percent over a 30-year period, we could expect the stock price of that business to appreciate similarly over the same period.
It’s the same for a stock market index. If the average company within an index grew by 1,000 percent over 30 years (that’s 8.32 percent annually) we could expect the stock market index to perform similarly. Long term, stock markets predictably reflect the fortunes of the businesses within them. But over shorter periods, the stock market can be as irrational as a crazy dog on a leash. And it’s the crazy dog’s movements that can—if we let them—lure us closer to poverty than to wealth.
True Stock Market Experts Understand Dogs on Leashes
I used to have a dog named Sue. She behaved as if we were feeding her rocket fuel instead of dog food. If you turned your back on her in the backyard, she’d enact a scene from the US television show Prison Break, bounding over the 5-foot-high fence in our yard and straining diplomatic relations between our family and those whose gardens she would destroy.
When I took her for extended runs on wide, open fields, she burned off some octane. I would run in a single direction while she darted upward, backward, right, then left. But collared by a very long rope, she couldn’t escape.
If I ran from the lake to the barn with Sue on a leash, and if it took me 10 minutes to get there, then any observer would realize it would take the dog 10 minutes to get there as well. True, the dog could bolt ahead or lag behind while sticking its nose in a gift left behind by another canine. But ultimately, it can’t cover the distance much slower or much faster than I do—because of the leash.
Now imagine a bunch of emotional gamblers who watch and bet money on leashed dogs. When a dog bursts ahead of its owner, the gamblers put money on the sprinting dog, betting that it will sprint far off into the distance. But the dog’s on a leash, so it can’t get too far ahead of its owner. When the leashed dog gets ahead, it’s destined to either slow down or stop—so that the owner can catch up.
But the gamblers don’t think about that. If they see the dog bounding along without noticing the leash, they place presumptuous bets that the dog will maintain its frenetic pace. Their greed wraps itself around their brains and squeezes. Without that cranial compression, they would see that the leashed dog couldn’t outpace its owner.
It sounds so obvious, doesn’t it? Now get this: the stock market is exactly like a dog on a leash. If the stock market races at twice the pace of business earnings for a few years, then it has to either wait for business earnings to catch up, or it will get choke-chained back in a hurry. But a rapidly rising stock market can cause people to forget that reality. I’ll use an individual stock to prove the point.
Coca-Cola Bounds from Its Owner
From 1988 to 1998, the Coca-Cola Company increased its profits as a business by 294 percent. During this short period (and yes, 10 years is a stock market blip) Coca-Cola’s stock price increased by 966 percent. Because it was rising rapidly, investors (including mutual fund managers) fell over themselves to buy Coca-Cola shares. That pushed the share price even higher. Greed might be the greatest hallucinogenic known to man.
The dog (Coca-Cola’s stock price) was racing ahead of its master (Coca-Cola’s business earnings). A rational share price increase must fall in line with profits. If Coca-Cola’s business earnings increased by 294 percent from 1988 to 1998, we would assume that its stock price would grow by a percentage that was at least somewhat similar, maybe a little higher or maybe a little lower. But Coca-Cola’s stock price growth of 966 percent was irrational, compared with its business earnings increase of 294 percent.10
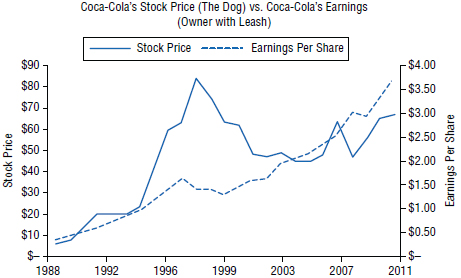
Figure 4.2 Coca-Cola’s Stock Price vs. Coca-Cola’s Earnings
Source: Value Line Investment Survey
Can you see what happened to the blazing Coca-Cola share price when it got far ahead of Coca-Cola’s business profits?
The dog eventually dropped back to meet its owner. After blazing ahead at 29 percent a year for a decade (from 1988 to 1998), Coca-Cola’s stock price eventually “heeled.” It had to. You can see in Figure 4.2 that the stock price was lower in 2011 than it was in 1998.
Coca-Cola’s earnings growth and stock price were realigned, much like a leashed dog with its owner.
You can look at the earnings growth of any stock you choose. Over a long period, the stock’s price might jump around, but it will never disconnect itself from the business earnings. To see a few examples for yourself, you can log on to The Value Line Investment Survey. The US research company offers free, online historical data of the 30 Dow Jones Industrial stocks.
The Madness of People
Coca-Cola wasn’t the only business with a share price that was out of step with its business earnings. Stock market investors worldwide euphorically flocked to stocks in the late 1990s, as they were motivated by rising prices. The stock buying grew more frenzied during the latter part of the decade as stock prices reached lofty new heights. The United States (for example) went through a period of strong economic growth during the 1990s. But the prices of stocks were rising twice as fast as the level of business earnings. It couldn’t last forever, however. The decade that followed saw the racing, leashed dogs eventually fall in line with their owners who were moving at a much slower rate.
Global stock markets also took a breather between the year 2000 and 2010. They rose just 21 percent for the decade, after climbing 250 percent between 1989 and 1999, as measured by the MSCI index of developed country stock markets.11
Stocks Go Crazy Every Generation
Long term, whether we’re talking about Coca-Cola or a stock market index, there’s one reality: the growth of stock market prices will closely match the growth of the businesses they represent. It’s supply and demand that pushes stock prices over the short term. If there are more buyers than sellers, the stock price (or the stock market index in general) will rise. If there are more sellers than buyers, stocks will drop. And when prices rise, people feel more confident about that investment. They buy more, pushing the price even higher. People become drunk on their own greed, not recognizing that bubbles form when price levels dramatically exceed business profit growth.
“History Doesn’t Repeat Itself, But It Does Rhyme”—Mark Twain12
As far back as we have records, at least once every generation, the stock market goes bonkers. Table 4.4 presents three periods from the past 90 years showing the US market as represented by the Dow Jones Industrial stocks. You can see, in each case, share price levels that grossly exceeded earnings levels, and the terrible returns that followed as the “dogs” were caught by their “owners.”
Table 4.4 Prices of Stocks Can’t Outpace Business Earnings for Long
| Years When Stock Prices Exceeded Business Earnings | Growth in Business Earnings (the Pace of the Dog’s Owner) | Growth in Stock Prices (the Pace of the Dog) | Stock Price Decline/Gain (the Dog’s Overall Progress) During the Following Decade |
| 1920–1929 | 118% | 271.2% | -40.9% |
| 1955–1965 | 150% | 198.5% | 29.3% |
| 1990–2000 | 152% | 290% | 20.17% |
Note: Figures do not include dividends.
Source: The Value Line Investment Survey13
Note from 1920 to 1929, the Dow stocks’ average business growth amounted to 118 percent over the 10-year period. But the prices of the Dow stocks increased by 271.2 percent over that decade, so if someone invested in all 30 Dow stocks in 1920 and held them until 1929, he would have gained more than 271 percent not including dividends and close to 300 percent including dividends. Because stock prices can’t exceed business growth for long, the decade that followed (1930–1940) saw the stock market fall by an overall total of 40.9 percent. Again, the leashed dog can’t escape its owner.
The two other time periods during the past 90 years where investors lost sight of the connections between business earnings and stock price appreciation occurred from 1955 to 1965 and from 1990 to 2000. You can see the results in Table 4.4
Anyone investing in a broad US stock market index would have gained more than 300 percent (including dividends) in the 10 short years between 1990 and 2000. Did business earnings increase by 300 percent? Not even close. That’s the main reason the markets stalled from 2000 to 2010.
How Does this Relate to You?
Every generation, it happens again. Stock prices go haywire. When they do, many people abandon responsible investment strategies. The more rapidly the markets rise, the more reckless most investors become. They pile more and more money into stocks, ignoring their bonds. And when the markets eventually fall or stagnate, they curse their bad luck. But luck has little to do with it.
Internet Madness and the Damage It Caused
The greatest Titanic period of delusion sailed during the technology stock mania of the late 1990s. The stocks that were riskiest were those companies with the greatest disconnection between their business earnings and their stock prices.
Many Internet-based businesses weren’t even making profits but their stock prices were soaring, pushed upward by the media and the scintillating stories of Silicon Valley’s super-rich. Most of their investors probably didn’t know that there’s a direct long-term connection between stock prices and business earnings. They probably didn’t know that it’s not realistic for businesses to grow their earnings by 150 percent a year—year after year, no matter what the business is. And if businesses can’t grow earnings by 150 percent on an annual basis, then their stocks can’t either.
Some of the more famous promoters at the time were such high-profile financial analysts as Morgan Stanley’s Mary Meeker, Merrill Lynch’s Henry Blodgett, and Solomon Smith Barney’s Jack Grubman. But they might have a tough time showing their faces today. For all I know, the top Internet stock analysts of the 1990s are now hiding in an African jungle, hoping that angry investors won’t find them. Their voices tossed buckets of gas on the flames of madness when technology-based companies without profits were priced in the stratosphere. Meeker, Blodgett, and Grubman were encouraging the average person to buy, buy, buy.
One difference between this period and the bubbles of previous generations was the speed at which the bubble grew, thanks to the Internet as a rapid communication channel. One transgenerational similarity, however, was the investors’ attitude that “this time it would be different.” In each period where stock prices disconnect from earnings levels, you find people who think that history is going to rewrite itself, that stock prices no longer need to reflect earnings, and that leashed dogs everywhere can develop mutations, grow wings, and lead flocks of Canadian geese on their way to Florida. In the long term, stock prices reflect business earnings. When they don’t, it spells trouble.
Table 4.5 How Investors Were Punished
| Formerly Hot Stocks | $10,000 Invested at the Market High in 2000 | Value of the Same $10,000 at the Low of 2001–2002 |
| Amazon.com | $10,000 | $700 |
| Cisco Systems | $10,000 | $990 |
| Corning Inc. | $10,000 | $100 |
| JDS Uniphase | $10,000 | $50 |
| Lucent Technologies | $10,000 | $70 |
| Nortel Networks | $10,000 | $30 |
| Priceline.com | $10,000 | $60 |
| Yahoo! | $10,000 | $360 |
Source: Morningstar and Burton Malkiel, A Random Walk Down Wall Street, 200314
Even shares of the world’s largest technology companies sold at nosebleed prices as they defied business profit levels. And, as shown in Table 4.5, when cold, hard business earnings eventually yanked the price leashes back to Earth, people who had ignored the age-old premise (that business growth and stock growth is directly proportional) eventually lost their shirts. Investing $10,000 in a few of the new millennium’s most popular stocks during 2000 would have resulted in some devastating losses for investors.
The stories of wealth enticed individual investors and fund management firms alike before the eventual collapse of the dot-com bubble.
Mutual fund companies rushed to create technology-based funds that they could sell. The job of fund companies, of course, isn’t to make money for you or me. Their primary job is to make money for their companies’ owners or share-holders.
There’s a saying that “Wall Street will sell what Wall Street can sell.” In this case, newly introduced technology-stock mutual funds were first-class tickets on airplanes with near-empty fuel tanks. Passengers giggled with delight as they soared into the clouds . . . until the fuel ran out.
Sadly, there were plenty of regular middle-class folk who climbed aboard this soon-to-be-plunging craft. When the plane hurtled into the ground, many investors in technology funds and Internet stocks lost nearly everything they had invested.
Few players in the Internet stock fiasco escaped unscathed. You might imagine loads of people getting out on top, or near the top, but the hysterical era of easily quadrupling your money within a matter of months swept through amateur and professional investors alike. Nobody really knew where that “top” was going to be, so loads of people kept climbing into tech stocks.
I’d be lying if I claimed to avoid the tech sector’s sirens. In 1999, I succumbed to buying shares in one of the technology stock darlings of the day, Nortel Networks.
It was silly of me to buy it, but watching my friends making bucket loads of easy money on Internet stocks while I sat on the sidelines was more than I could take. Swept up in the madness, it didn’t matter that I didn’t really know what the company did.
Eventually getting around to reading Nortel’s annual report, I recognized that the company had been losing more and more money since 1996. But I didn’t care. Sure, it made me nervous, but the stock price was rising and I didn’t want to be left behind.
What was worse was that every year since 1996, the business was losing more and more money while its stock price was going in the opposite direction: up! I paid $83 a share. When that stock price rose to $118, I had made a 42 percent profit. Late getting onto the Nortel train, I couldn’t believe the money I had made in such a short time. Recognizing a quick profit, I figured it would be wise to sell, which is exactly what I did at $118 a share. If only the story ended there. No sooner did I sell than the price rose to $124 a share.
Then I read an analyst’s report suggesting that the share price was going to rise to $150 before the year was up. What was I doing, selling at $118?
Shortly after the stock price dipped to $120, and like a knucklehead, I bought back the shares I had previously sold. I was watching the dog while ignoring the owner’s rigor mortis.
And that’s when gravity hurtled the stock price down to $100 a share . . . then $80 a share . . . then $50 a share. Suddenly, people noticed the smell.
I sold at $48, losing almost half of what I put into my investment. I got burned for buying a stock I never should have bought in the first place because—despite the meteoric rise in its stock price—the business itself hadn’t made a dime in years.
But I was lucky. Today, those same shares are worthless.
Many of my friends never sold. It’s a shameful reminder of what can happen when we mix greed and ignorance.
Taking Advantage of Fear and Greed
Buying a total stock market index fund needn’t be boring. If you can be greedy when others are fearful and fearful when others are greedy, you can add a touch of nitrate to your investment portfolio. You don’t need to follow investment news or follow the markets. You just need to utilize the safest component of your investment portfolio—your bonds.
The disastrous events of September 11, 2001, invoked tremendous fear in the American people when terrorists hijacked two airliners and flew them into New York’s World Trade Center. After the twin towers collapsed, the stock markets were temporarily closed. Sadly, nearly 3,000 people were killed in the terrorist attack.
But long term, how would the attack affect American business profits? As catastrophic as the event had been, it wasn’t likely to have a permanent effect on the number of Coca-Cola cans or McDonald’s hamburgers sold worldwide or Safeway’s food sales. Americans are resilient, and so are their businesses.
And yet, when the stock markets re-opened after the terrorist attack, US stock prices dropped.
Short Term, Most Investors Prove Their Irrationality
Many investors don’t think about the stock market as a representation of something real—like true business earnings. Fear and greed rule the short-term irrationality of stock markets. But thinking about the market as a group of businesses, and not a squiggly line on a chart or a quote in the paper, can fertilize your wealth. When there’s a disconnection between business profits and stock prices, you can easily take advantage of the circumstances. What happened in the stock markets after 9/11 was the antithesis of the boom times of the late 1990s. Stock prices fell like football-sized chunks of hail. But business earnings were hardly affected.
When the New York Stock Exchange reopened after the 9/11 attacks, it might as well have held up a giant neon sign: “Stocks on sale today!” The US stock market opened 20 percent lower than its opening level the previous month. Scraping together every penny I could muster, I dumped money into the stock market like a crazed shopper at a “going out of business” sale. Speculators hate doing that because they’re continually worried the markets will fall further. Real investors never think like that. They care more about what the markets will be doing in 20 years, not next week.
Worrying about the immediate future is letting the stock market lead you by the gonads.
Most People Have a Backward View of the Markets
The Oracle of Omaha, Warren Buffett, laid out a quiz in his 1997 letter to Berkshire Hathaway shareholders. If you can pass this quiz, you’ll be on your way to doing well in the stock market. But most investors and most financial advisers would fail this little quiz, and that’s one of the reasons most people are poor investors.
He asked his readers whether they would prefer to pay higher or lower prices for items like hamburgers or cars in the future. Of course, it makes more sense to wish for lower prices. He then asks another question. If you expect to buy stock market products over at least the next five years, should you wish for higher or lower stock prices? Buffett says that most investors get this one wrong. They prefer to pay higher prices. Instead, he says people should think about stock prices the same way they would think about the prices of hamburgers or cars:
Only those who will be sellers of equities [stock market investments] in the near future should be happy at seeing stocks rise. Prospective purchasers should much prefer sinking prices.15
Young People Should Salivate When Stocks Sputter
William Bernstein, the former neurologist turned financial adviser, says investors in their 20s or early 30s should “pray for a long, awful [bear] market.” He wrote If You Can, a short e-book about investing for Millennials.
Most young people want their investments to rise right away. They want immediate confirmation that they’re doing the right thing. But instead, they should hope for stocks to sag or limp.
Think of stocks as cans of nonperishable food. Workers buy these cans and stuff them in the cellar. Once retired, they eat that food. If the price of those items rises rapidly after they retire, the retirees can celebrate. After all, they’ve already bought their cans.
That isn’t the same for young investors. They’re in the collecting phase. They get less for their money when prices rise quickly.
We can’t control stock market levels. But we can control how we feel about market prices. Young investors should smile—and keep investing—when stocks don’t rise.
Imagine a young investor named Lisa. She starts her career at age 22. She invests every year. Over the next 30 years, should Lisa prefer to see stocks rise by a compound annual return of 15 percent annually for 15 years, followed by an equal time period when stocks average a compound annual return of 2 percent? Or should she prefer stocks to compound annually at 2 percent per year for the first 15 years, followed by 11 percent per year for the next 15 years?
Instinctively, most people would choose option 1. They would want to see their investments make money right away. After 30 years, that would give Lisa $922,817.99. But Warren Buffett and William Bernstein are right. Young investors benefit when markets are weak. The second option is better. With it, as seen in Table 4.6, Lisa’s money would grow to $1,235,866.87.
Table 4.6 $10,000 Invested Annually
| Scenario 1: Stocks Gain 15% Per Year for 15 Years, Followed by 2% Per Year for 15 Years | Scenario 2: Stocks Gain 2% Per Year for 15 Years, Followed by 11% Per Year for 15 Years | |||
| Year | Account Balance | Compound Annual Growth Rate | Account Balance | Compound Annual Growth Rate |
| $10,000.00 | $10,000.00 | |||
| 1. | $21,500.00 | 15% | $20,200.00 | 2% |
| 2. | $34,725.00 | 15% | $30,604.00 | 2% |
| 3. | $49,933.75 | 15% | $41,216.08 | 2% |
| 4. | $67,423.81 | 15% | $52,040.40 | 2% |
| 5. | $87,537.38 | 15% | $63,081.21 | 2% |
| 6. | $110,667.99 | 15% | $74,342.83 | 2% |
| 7. | $137,268.19 | 15% | $85,829.69 | 2% |
| 8. | $167,858.42 | 15% | $97,546.28 | 2% |
| 9. | $203,037.18 | 15% | $109,497.21 | 2% |
| 10. | $243,492.76 | 15% | $121,687.15 | 2% |
| 11. | $290,016.67 | 15% | $134,120.90 | 2% |
| 12. | $343,519.17 | 15% | $146,803.32 | 2% |
| 13. | $405,047.05 | 15% | $159,739.38 | 2% |
| 14. | $475,804.11 | 15% | $172,934.17 | 2% |
| 15. | $557,174.72 | 15% | $186,392.85 | 2% |
| 16. | $578,318.22 | 2% | $216,896.07 | 11% |
| 17. | $599,884.58 | 2% | $250,754.63 | 11% |
| 18. | $621,882.28 | 2% | $288,337.64 | 11% |
| 19. | $644,319.92 | 2% | $330,054.78 | 11% |
| 20. | $667,206.32 | 2% | $376,360.81 | 11% |
| 21. | $690,550.45 | 2% | $427,760.50 | 11% |
| 22. | $714,361.45 | 2% | $484,814.15 | 11% |
| 23. | $738,648.68 | 2% | $548,143.71 | 11% |
| 24. | $763,421.66 | 2% | $618,439.52 | 11% |
| 25. | $788,690.09 | 2% | $696,467.87 | 11% |
| 26. | $814,463.89 | 2% | $783,079.33 | 11% |
| 27. | $840,753.17 | 2% | $879,218.06 | 11% |
| 28. | $867,568.23 | 2% | $985,932.05 | 11% |
| 29. | $894,919.60 | 2% | $1,104,384.57 | 11% |
| 30. | $922,817.99 | 2% | $1,235,866.87 | 11% |
How about a constant annual compound return of 7 percent over 30 years? It would be easier on the nerves. Instinctively, it also looks better than facing weak stock returns for the first 15 years. But the market laughs at instinct. As seen in Figure 4.3, this third scenario would see that money grow to $1,020,730.41.
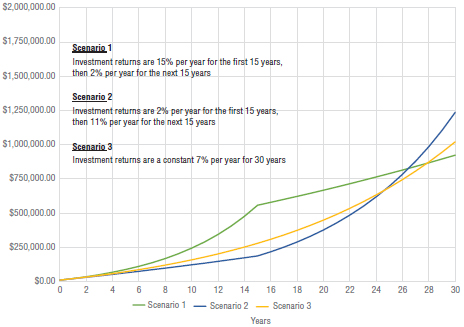
Figure 4.3 Compounding Growth of Differing Scenarios
Facing the first 15 years of horrible returns, followed by 11 percent per year, would provide $215,136.46 more.
Nobody can control stock prices. But people can control their behavior and perspective. Young people, especially, shouldn’t be afraid to invest when the markets sputter.
Instead, they should invest every month—and smile when markets lag.
Opportunities after Chaos
When the stock market reopened after 9/11, it was trading at a discount. As a result, I added more money. But where did I get it?
I sold some of my bonds. It didn’t take any kind of special judgment on my part. I just stuck to a mechanical strategy, which I’ll explain further in Chapter 5.
Unfortunately, the money I invested in the US stock market index in September 2001 went on to gain 15 percent over just a few months. By January 2016 (even after the financial crisis of 2008–2009), the value of my stock purchases in the autumn of 2001 was up more than 158 percent, including dividends. But that upset me. Yes, you read that right. I was upset to see my stock market investments rise.
After 9/11, I wanted the markets to stay down. I was hoping to keep buying into the stock markets for many years at a discounted rate. It’s a bit like betting that a sleeping dog on a long leash is eventually going to have to get up and run to catch its sprinting owner. The longer the leash and the longer that dog sleeps, the more money I can put on the dog, which will eventually tear after its owner up the hill, pulling my wheelbarrow load of money behind it. Sadly for me, the stock market didn’t sleep in its discounted state for long.
Of course, not everybody is going to be happy about a sinking or stagnating stock market. My apologies to retirees. If you’re retired, there’s no way you’re going to want to see plummeting stock prices. You’re no longer able to buy cheap stocks when you’re not making a salary. And, you’ll be regularly selling small pieces of your investments every year to cover living expenses.
Younger people who will be adding to their portfolios for at least five years or more need to celebrate when markets fall. I didn’t think I would get another opportunity to benefit from irrational fear after September 2001. A plunging stock market is a special treat for a wage earner—one that doesn’t come along every day. But another opportunity fell on my lap again between 2002 and 2003 (as shown in Figure 4.4), with the stock market eventually selling at a 40 percent discount from its 2001 high, after the United States announced it was going to war with Iraq.

Figure 4.4 US Stocks Offered a Wonderful Sale
Source: Yahoo! Finance historical price tables for Dow Jones Industrials
Was the average US business going to make 40 percent less money? Were businesses like PepsiCo, Walmart, Exxon Mobil, and Microsoft going to see a 40 percent drop in profits? Even at the time, it would have been really tough to find anyone who believed that. Yet, US businesses were trading at a 40 percent discount on the stock market. I was salivating, and hoping that the markets would stay down this time—for years if possible. I wanted to load up.
I didn’t know how low the markets would fall, so I wasn’t lucky enough to buy stock indexes at the very bottom of the market’s plunge. But it didn’t matter to me. Once the “20 percent off” flags were waving in my face, I was a chocoholic stowaway in Willy Wonka’s factory. The stock market continued to fall as I continued to buy. If I could have taken an extra job to give me more money to take advantage of cheap stock prices, I probably would have done it. For some reason, most investors were doing what they typically do: they overreact when prices fall, sending stocks to mouthwatering levels. They sell when they should be buying. They become afraid of a discounted sale, hoping (and yes, this is a true representation of insanity) that they can soon pay higher prices for their stock market products. They miss the point of what stocks are. Stocks represent ownership in real businesses.
Again, I hoped that the stock markets would keep falling in 2003, or that they would stay low for a few years so I could gorge at the buffet.
It was not to be. I was disappointed as the US stock market index began a long recovery from 2002–2003 until the end of 2007, rising more than 100 percent from its low point in just four years. Retirees would have been celebrating, but I was crying in my oatmeal. The big supermarket sale was over.
As the stock market roared ahead in 2007, I didn’t put a penny in my stock indexes. I bought bond indexes instead. Following a general rule of thumb, I wanted my bond allocation to equal my age. For example, I was 37 years old and I wanted 35 to 40 percent of my portfolio to be comprised of bonds. But the rapidly rising stock market in 2007 was sending my stock indexes far higher than the allocation I set for them. As a result, my bonds represented far less than 35 percent of my total account, so I spent 2007 buying bonds—even selling some of my stock indexes to do it.
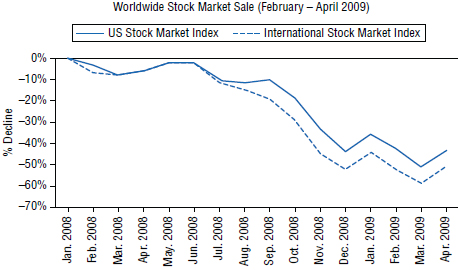
Figure 4.5 Worldwide Stock Market Sale
Source: Vanguard historical prices for total US and international indexes
I resumed my aggressive stock-buying plan in 2008 when the stock market traded at a 20 percent discount to its 2007 peak. Figure 4.5 shows what kind of hammering the stock market took in 2008. And I happily increased my purchases with my monthly savings as the markets plummeted by 50 percent from 2007 to a low point in March 2009. It was like wandering into an Apple computer dealership and seeing the discount bins filled to the brim with the latest iPhones. Stocks were selling at 50 percent off—and nobody was lining up to buy them! At one point, the stock indexes had fallen so far that I sold a large amount of my bond index so I could buy more of my stock index, mindful of keeping a balanced allocation of stocks and bonds. When the stock markets fell, my bond allocation ended up being significantly higher than 35 percent of my total portfolio. Selling off some of my bond index to buy more of my stock index also helped bring my portfolio back to the desired allocation.
With stock prices falling so heavily, I finally understood Buffett’s comments in 1974, when he was interviewed by Forbes magazine. Faced at the time with a stock market drop of a similar magnitude, he said he felt like an oversexed guy in a harem.16
Again, did the economic crash in 2008–2009 eat into the profits of US businesses? Certainly some of them lost money, but not all. If stock prices fall by 50 percent, it can be justified only if business earnings have fallen (or expect to fall) by 50 percent. As always with the stock market, investors’ fear and greed can produce irrational price levels. In 2008–2009, I prayed stocks would remain cheap.
Obviously, praying for something so nonspiritual was the wrong thing to do. Perhaps divine intervention punished me for it when the markets rose. Between March 2009 and January 2016, the US stock market index rose 223 percent and the international stock market index, which I was also buying, rose 104 percent. I’m not the sort of guy who normally gets depressed, but the indexes I was buying were getting pricier by the month. I would have preferred it if the markets had stayed low.
People don’t normally get such wonderful opportunities to take advantage of crazy, short-term discounts. But with sensational financial television programs based on financial Armageddon, with a rough economic period, and with the Internet spreading news of emotional market sentiment far and wide, we had a recipe for some remarkable stock market volatility over the past decade.
Unfortunately, the enemy in the mirror thrashes most investors. They like buying stock market investments when prices are rising, and they shrink away in horror when they see bargains. How do we know? We just need to observe what most investors do when stock markets are falling or rising. John Bogle, in his classic text, Common Sense on Mutual Funds, reveals the startling data while asking the rhetorical question: “Will investors never learn?”
In the late 1990s, when stock markets were defying gravity, investors piled more money into the stock market than they ever had before, adding $650 billion to stock mutual funds during this period. Then when stock prices became cheap in 2008 and 2009, with the biggest market decline since 1929–1933, what do you think most American mutual fund investors were doing? When they should have been enthusiastically buying, they were selling off more than $228 billion of stock market mutual funds.17
What we do know about the future is that we will once again experience unpredictable stock market shockers. The markets will either fall, seemingly off a cliff, or they’ll catch hold of a rocket to soar into the stratosphere. Armed with the knowledge of how stock markets reflect business earnings you won’t be seduced to take silly risks, and you won’t be as fearful when markets fall. By building a responsible portfolio of stock and bond indexes, you’ll create more stability in your account while providing opportunities to take advantage of stock market silliness.
The next chapter will show you how to do this.