RULE 5
Build Mountains of Money with a Responsible Portfolio
“Eat your Brussels sprouts,” I used to hear when I was a kid, “and you'll grow into a big, strong boy.”
So I ate a bowl of Brussels sprouts for breakfast, a plate of Brussels sprouts for lunch, and a casserole dish of Brussels sprouts for dinner—seven days a week.
If that were true, I'd probably resemble a green, leafy ball with legs by now. Brussels sprouts might be good for you, but you need to eat more than a bunch of tiny cabbages if you want to be healthy.
In the same vein, a total stock market index fund might be good for you as well, but it doesn't represent a balanced portfolio.
If that were all you bought, your portfolio would gyrate wildly with the stock market. If the market dropped 20 percent, so would your overall portfolio. If the market dropped 50 percent, so would your total investments.
This isn't good for any investor, especially those approaching retirement and needing more stability. If a 60-year-old plans to use her portfolio as a nest egg, she's not going to be comfortable seeing all of her hard-earned money plunge into what might look like a bottomless crater during a sharp market decline.
Only an irresponsible portfolio would fall 50 percent if the stock market value were cut in half. That's because bonds become parachutes when stock markets fall.
What Are Bonds?
Bond is a secret British agent with a license to kill. He sleeps with multiple women, never dies, and every 15 years or so, gets a body transplant to look like a completely different guy.
Financial bonds are just as riveting.
Bonds get less shaken and stirred
Long term, bonds don't make as much money as stocks. But they're less volatile, so they can save your account from falling to the bottom of a stock market canyon if the market gods feel like purging for fun.
A bond is a loan that you make to a government or a corporation. Your money is safe as long as that entity (the government or the corporation receiving the loan) is able to pay the money back, plus annual interest.
The safest ones you can buy are first-world government bonds from high-income industrial countries. Slightly riskier bonds can be bought from strong blue-chip businesses such as Coca-Cola <www.coca-cola.com>, Wal-Mart <www.walmart.com>, and Johnson & Johnson <www.jnj.com>.
Riskier bonds pay higher interest, but there's a higher chance that they might forfeit on the loan. The higher the interest paid by a corporate bond, the higher the risk associated with it.
If you're looking for a safe place for your money, it's best to keep it in short-term government bonds or short-term, high-quality corporate bonds.
Why short-term? If you buy a bond paying four percent annually over the next 10 years, there's always a chance that inflation could make a meal out of it. If that happens, you're essentially losing money. Sure, the bond is paying you four percent annually, but if you're buying breakfast cereal that increases in price every year by six percent, then your four percent bond interest is losing to a box of cornflakes.
For this reason, buying bonds with shorter maturities (such as one- to three-year bonds) is wiser than buying longer term bonds (such as 10-year bonds). If inflation rears its head, you won't be saddled with a 10-year commitment to a certain interest rate. When a short-term bond expires, and you get your money back, you can buy another short-term bond at the higher interest rate.
If this sounds complicated, don't worry. You can buy a shortterm government bond index, and you never have to worry about an expiration date. It will keep pace with inflation over time, and you can sell it whenever you want. It's easy.
If you want to know how bonds work, here's the skinny
You don't need to know the intricacies of how bonds work. You can just buy a government bond index (which I'll show you how to do in the next chapter) and that bond index can represent the temperate part of your investment account. But if you want to know how bonds work, here it is in a half-page nutshell:
If you bought a five-year government bond, you would know immediately what the interest rate would be, and that the rate would be guaranteed by the government. If you loaned a government say, $10,000, they would promise to give you that $10,000 back. Along the way, you would be guaranteed to earn $500 each year in interest payments, assuming that the interest rate was five percent annually.
If you choose to sell that bond before the five years are up, you can do that, but bond prices fluctuate every day. Instead of getting back your $10,000, you might get back $10,500 or $9,500, if you sell before the maturity date.
When inflation/interest rates rise, bond prices fall. If inflation were running at three percent annually when you bought a bond that yields five percent in interest, and if inflation suddenly jumped to five percent, then no new investors would want to buy a bond like yours (paying five percent interest with inflation at five percent.) If they did, they wouldn't make any money after the increase in the cost of living. But if the price of that bond dropped, the new investor would be lured by the idea of paying $9,500 for the same bond that you paid $10,000. When that bond expired, the new investor would get $10,000 back.
If interest rates dropped, a friend of yours might be dying to buy your $10,000 bond that pays five percent in interest annually. But he wouldn't be alone. Institutional bond traders would rush to buy that bond quickly, resulting in a price increase for it—perhaps from $10,000 to $10,300. Bond-price adjustments are similar to stock-price adjustments. If there's more demand, the price will rise.
Your friend, however, would earn five percent annually on $10,000 (not on the $10,300 he paid for the bond). When the bond expired, he would receive $10,000 back. You'd brag. He'd get upset. And if your friend were anything like my dad, you would find cat food in your shoes the following morning.
You can see why there's a bond “trading market” as people try to take advantage of these price movements. It only follows that there are actively managed mutual funds focused on buying and selling bonds as well.
Bond index funds are the winner
In case you're tempted to buy an actively managed bond fund, remember this: bond index funds beat them silly. Costs matter even more in the world of bond funds.
Figure 5.1 reveals that from 2003 to 2008, the average actively managed government bond fund with a sales load (that crafty commission paid to advisers) made 3.7 percent annually and the average actively managed bond fund without a sales load made 4.9 percent annually. As with actively managed stock market mutual funds, those without sales-load fees outperform, on average, those with sales-load fees.
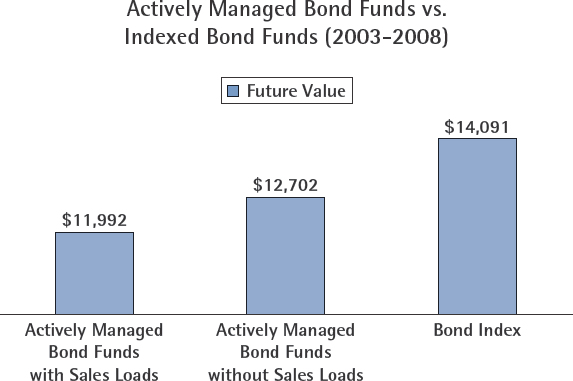
Figure 5.1 Comparison of Funds: Source: John C Bogle, Common Sense on Mutual Funds
During the same period, a U.S. government bond index averaged 7.1 percent annually. Whether you're buying stock indexes or bond indexes, active management generally slashes your return potential because of the hidden fees associated with them.1
Ensuring that your account has a bond index, a domestic stock index, and an international stock index provides you with a greater statistical chance of investment success.
What percentage of your portfolio should you have in bonds?
The debate over what percentage you should own in stocks and what percentage you should own in bonds is livelier than an Italian family reunion.
A rule of thumb is that you should have a bond allocation that's roughly equivalent to your age. Some experts suggest that it should be your age minus 10, or if you want a riskier portfolio, your age minus 20; for example, a 50-year-old would have between 30 and 50 percent of his or her investment portfolio in bonds.
Common sense should be used here. A 50-year-old government employee expecting a guaranteed pension when he retires can afford to invest less than 50 percent of his portfolio in bonds. He can take on greater risk (on the promise of higher returns). Stock returns don't always beat bond returns over the short term, but over long periods, stocks run circles around bonds. That said, bonds could be your secret weapon when stocks hit the skids.
Trounce the professionals with a balanced portfolio
If you're adding $200 a month to a portfolio, you could add $60 a month to a bond index ($60 is 30 percent of $200) and $140 a month ($140 is 70 percent of $200) to your stock indexes.
In any given year, as you know, the stock market can go crazy, rising or dropping by 30 percent or more. Dispassionate, intelligent investors can simply rebalance their portfolios if they're too far from the stock/bond allocation they set for themselves.
For example, if a 30-year-old man has 30 percent in bonds and 70 percent in stocks, he will want to maintain that allocation.
If the stock market falls heavily in a given month, the investor will find that his portfolio (which started out with 70 percent in stocks) now has a lower percentage in stocks than his goal allocation of 70 percent. So what should that investor do when adding fresh money to the account? He should add to his stock indexes.
If the stock market rose considerably during another month, the investor might find that stocks now make up more than 70 percent of his total portfolio. What should he do with fresh money? He should add to his bond index.
Profiting from Panic—Stock Market Crash 2008–2009
When stock markets fall, most people panic, sending stocks to lower levels. Dispassionate investors, however, can lay the groundwork for significant future profits. My personal portfolio was far larger after the financial crisis compared with its level before the crisis scuttled the markets. Following the strategy to keep my personal portfolio aligned with my desired allocation of stocks and bonds was the key. As I mentioned in the previous chapter, I started 2008 (before the stock market crash) with a bond allocation at roughly 35 percent of my total portfolio as shown in Figure 5.2.
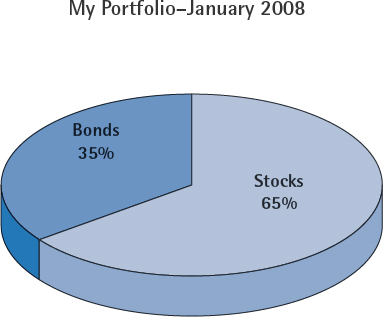
Figure 5.2 Portfolio at Age 37
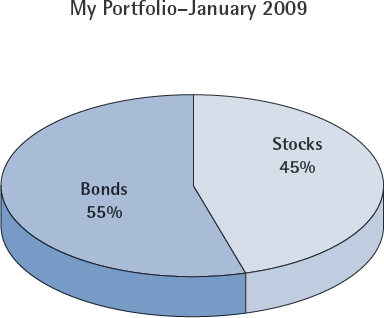
Figure 5.3 Portfolio at Age 38
Then the stock markets started falling, giving me a disproportionate percentage in bonds. I invest monthly, so when the markets fell—to keep me close to my desired stock/bond allocation—I bought nothing but stocks and stock indexes. But no matter how much money I was adding to my stock indexes, the markets continued to drop heavily during the end of 2008 and the beginning of 2009.
Figure 5.3 shows what my portfolio was looking like during the first few months of 2009.
Despite my monthly stock market purchases, I couldn't get my stock allocation back to 65 percent of my total. As a result, I had to sell some of my bonds in early 2009 to bring my portfolio back to my desired allocation.
Naturally, I was hoping the markets would stay low. But they didn't. As the stock markets began recovering later that year, I switched tactics again and bought nothing but bonds for more than a year. I was low on bonds because I had sold bonds to buy stocks, and my stocks were rising in value.
This kind of rebalancing is common practice among university endowment funds and pension funds.
Usually investors don't need to address their stock/bond allocation more than once a year. But when the stock markets go completely nuts—dropping by 20 percent or more—it's a good idea to take advantage of it if you can.
Having a Foreign Affair
Americans should have a nice chunk of money in a U.S. index; Canadians should have a good-sized chunk in a Canadian index; and so it should follow for Australians, Brits, Singaporeans, or any other nationality with an established stock market. An investor's portfolio should always have the home country index represented. After all, it makes sense to keep much of your money in the currency with which you pay your bills.
After adding a government bond index to your portfolio, you really could stop right there.
But many investors (me included) like having an international component to their portfolios. The U.S. stock market makes up just 45 percent of the world's stock market exposure. There are stock markets in Canada, Australia, England, France, Japan, and China, just to mention a few, and it's advantageous to get exposure to the other 55 percent of the world's stock markets.
A total international stock market index would fit the bill.
There are many trains of thought relating to how much of your stock exposure should be international. To keep it simple, you could split your stock market money between your home country index and an international index.
In that case, a 30-year-old American investor (without an upcoming pension) would have a portfolio that looked like the one on Figure 5.4:
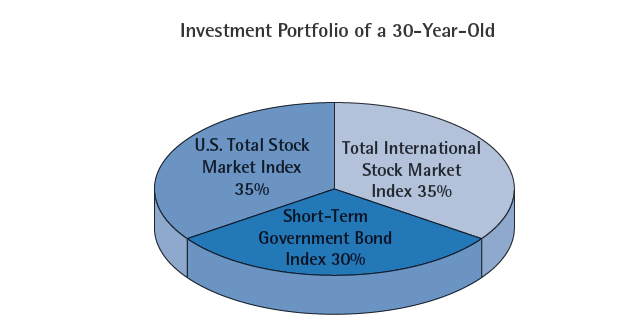
Figure 5.4 Investment Portfolio Percentages
If you're making monthly investment purchases, you need to look at your home country stock index and your international stock index and determine which one has done better over the previous month. When you figure it out (hold on for this!) you need to add newly invested money to the index that hasn't done as well to keep your account close to your desired allocation.
What do most people do? You guessed it. Metaphorically speaking, they sign long-term future contracts to empty their wallets each morning into the toilet—buying more of the high-performing index and less of the underperforming index. Over an investment lifetime, behavior such as this can cost hundreds of thousands of dollars.
Over my lifetime, the total U.S. stock market index and the total international stock market index have performed similarly. There's less than one percent compounding difference between the two since 1970.1 But there are times when one will lag the other. Take advantage of that.
Please note that I'm not talking about chasing individual stocks or individual foreign markets into the gutter. For example, just because the share price of company “Random X” has fallen doesn't mean that investors should throw good money after bad, thinking that it's a great deal just because it has dropped in value. Who knows what's going to happen to “Random X.” It could vaporize like a San Francisco fog.
Likewise, you take a large risk buying an index focusing on a single foreign country, such as Chile, Brazil, or China. Who really knows what's going to happen to those markets over the next 30 years? They might do really well, but it's better to spread your risk and go with the total international stock market index (if you want foreign exposure). Within it, you'll have exposure to older world economies such as England, France, and Germany, as well as the younger, fast-growing economies of China, India, Brazil, and Thailand. Just remember to rebalance. If the international stock market goes on a tear, don't chase it with fresh money. If your domestic stock index and the international stock index both shoot skyward, add fresh money to your bond index.
If that sounds too complicated, Scott Burns has popularized an even simpler strategy.
Introducing the Couch Potato Portfolio
A former columnist with The Dallas Morning News, Burns now works with AssetBuilder, a U.S.-based investment company that manages money with indexed strategies. Recognizing that actively managed mutual fund purchases didn't make sense (thanks to high fees, high-tax consequences, and poor performance), he popularized a simple investment strategy called The Couch Potato Portfolio.
It's comprised of an equal commitment to a U.S. total stock market index and a total bond market index. In other words, if you were investing $200 a month, you would put $100 a month into the stock market index and $100 a month into the bond market index. You don't even have to open your investment statements more than once a year if you don't want.
After one year is up, look at your investment account and figure out whether you now have more money in stocks or bonds. If there's more money in the bond index, sell some of it to get equal weighting in your portfolio, buying the stock index with the proceeds. If there's more money in the stock index, sell some of your stock market index and buy the bond index with the proceeds.
Without allowing yourself to fall victim to the crazy “ups and downs” of the markets, you would be buying low and selling high once a year.
With a 50 percent bond component, this would be a pretty conservative account. If the stock markets fell by 50 percent in a given year, your account would fall far less than that and you would have a chance to even out your account 12 months later by buying the underpriced stock index with proceeds from the bond index.
Such a strategy, despite its very conservative nature, would have averaged 10.96 percent annually from 1986 to 2001.2
This would have turned $1,000 into $4,758.79 over that 15-year period.
But a drunken monkey tossing darts at the stock market page could have made decent money from 1986 to 2001 because most of the world's stock markets rose significantly during that time. How did the indexed couch potato strategy perform when stock markets went through their gut-wrenching dives and rises (and dives again) during the past 10 years—a decade that many stock market investors have coined “the lost decade”? For starters, the indexed couch potato strategy let investors sleep more soundly during market drops, thanks to the large bond component.
During 2002, the U.S. stock market was hammered and the average U.S. stock market mutual fund declined 22.8 percent in value. In other words, an investment of $10,000 would have fallen to $7,723. But during that devastating year, the markets were only able to knock the couch potato strategy down 6.9 percent. A $10,000 investment would have dropped to $9,310.3
Between the beginning of 2003 and the beginning of 2008, the U.S. and international stock market indexes rose dramatically, gaining 91 percent and 186 percent respectively.4 If you had money in the markets during these five years, you probably would have increased your portfolio size exponentially, no matter who was managing it. But let's have a look at one of the ugliest years in modern financial history: 2008.
With the global economic crisis, world stock markets took a beating. Of course, long-term investors would have been gleefully rubbing their hands as they took advantage of the lower stock prices, but let's see how the average U.S. mutual fund and the couch potato concept would have fared during that falling market.
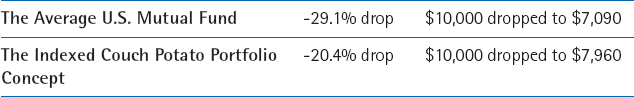
If you thought the average professional could have weathered the storm, you'd be disappointed. Table 5.1 shows that the average actively managed stock market mutual fund (comprised of stocks, without bonds) dropped 29.1 percent in 2008, compared to a drop of 20.4 percent for the indexed couch potato portfolio. And how about the average actively managed balanced fund? Balanced funds don't have the same kind of exposure to the stock market that regular stock market mutual funds have. Balanced funds are usually comprised of 60 percent stocks and 40 percent bonds. When stocks fell dramatically in 2008, the bond component of the average actively managed balanced fund should have cushioned the fall. But that wasn't the case. The average actively managed balanced fund dropped a whopping 28 percent during 2008.6 Why did the average balanced fund manager lose so much money even though 40 percent to 50 percent of their funds' assets were in bonds? The only explanation is that they were afraid, and they sold stocks when the markets fell. As mentioned in my previous chapter, nobody can predict the short-term movements of the stock markets. It's likely that most of the actively managed balanced fund managers in the U.S. were trying to do exactly that—with expensive consequences for their investors, as they sold stocks when prices were low. Following a disciplined couch potato strategy is likely to be far more profitable than allowing a fund manager to mess with your money.
Table 5.1 The Couch Potato Portfolio vs. the Average U.S. Mutual Fund in 20085
Another nice thing about using the couch potato portfolio strategy is that (despite the market crash of 2008–2009) you would have still made money from 2006–2011. During this five-year period—when many actively managed balanced mutual funds lost money—a $10,000 investment in the couch potato portfolio would have grown to more than $12,521.56 without adding money to it. That's an overall gain of 25.2 percent.7
As an investor, I loved the stock market decline of 2008–2009. But as a consultant, it was disheartening. Many people brought their portfolios to me during the economic crisis, revealing investments that had collapsed 40 percent or more in value.
When I looked at their investment holdings, I found something pretty shocking: their investment advisers obviously had little respect for bonds. Most of the people who showed me their statements were older than me, so they should have had bond components that equaled or exceeded mine. But none did. In some cases, they had no bonds at all! Their accounts fell far further than mine when the markets declined and they couldn't take advantage of cheap stock market prices because they didn't have any bonds to sell.
Investors in their 50s and 60s, especially, require bonds in their portfolios. It would be tough to find an investment book that didn't include this fundamental principle. But many of the accounts I saw were fully exposed to the market's gyrations without a protective bond component.
I teach with one fellow whom I refer to as a “cowboy investor.” He's in his mid-50s, and won't have a pension because he spent his career teaching in private schools overseas. He says bonds are for wimps, so he doesn't own any. Buying whatever rises in value (after it rises) and selling whatever falls (after it falls) gives him the distinction of a cowboy who'll never have enough money to leave the ranch.
Combinations of Stocks and Bonds Can Have Powerful Returns
Even when stock markets are rising, a portfolio with a bond component isn't the “party pooper” most cowboy investors think it is. Financial author Daniel Solin notes that from 1973 to 2004, an investor with an allocation of 60 percent in a U.S. stock market index and 40 percent in a total bond market index would have earned an average return of 10.49 percent annually.
An investor taking much more risk and having 100 percent of their portfolio in a stock index would have returns averaging 11.19 percent annually during this period.8
The cowboy investor would have taken on more risk, and for what? An extra 0.7 percent annual return? He would need to have a strong stomach. Table 5.2 demonstrates that his worst year during this 31-year time period would have seen his account plunge by 20.15 percent. In contrast, an account with 40 percent bonds and 60 percent stocks wouldn't have fallen further than 9.15 percent during its worst 12 months.9
If that extra 0.7 percent return annually is worth the stomachchurning volatility, then go for it. But keep in mind that doing so won't allow you to rebalance your account by taking advantage of cheap stock prices when they offer a sale.
When bonds whip cowboys
The premise of rebalancing stock and bond indexes doesn't just work in the United States. The fundamental principle works no matter where you're investing. MoneySense magazine's founding editor, Ian McGugan, won a Canadian National Magazine Award for an article adapting the couch potato strategy for Canadians. His method was simple. An investor splits money evenly between a U.S. stock market index, a Canadian stock market index, and a bond market index.
Table 5.2 Mixed Bag of Stocks and Bonds
| 1973–2004 100% stocks | 60% Stocks/40% bonds |
| 11.19% annual return Worst year: −20.15% | 10.49% annual return Worst year: −9.15% |
At the end of the calendar year, the investor simply rebalances the portfolio back to the original allocation. If the U.S. stock market index did better than the Canadian index, then the investor would sell some of the U.S. index to even things out with the Canadian index.
If the bond index beat both stock indexes, then some of the bond index would be sold to buy some of the Canadian and U.S. stock market indexes. Of course, if you're making monthly contributions to the account, you could rebalance monthly by simply buying the laggard—to keep your allocation evenly split three ways.
(MoneySense tracks a portfolio following this strategy online at the following link: <www.moneysense.ca/2006/04/05/classic-couch-potato-portfolio-historical-performance-tables/>).
You can see, in Table 5.3, how $100 invested in 1975 would have grown if it was rebalanced annually with equal allocations to the Canadian stock index, the U.S. stock index, and the Canadian bond index. Note that from 1975 to the end of 2010, a combination of bond indexes and stock market indexes wasn't just “for wimps.” The rebalancing combination of indexes with bonds actually beat the returns of the Canadian stock market index. You really can employ the safety of bonds and enjoy some decent returns in the process.
Table 5.3 Invested in the Canadian Couch Potato Portfolio vs. Canadian Stock Index (1975–2010):
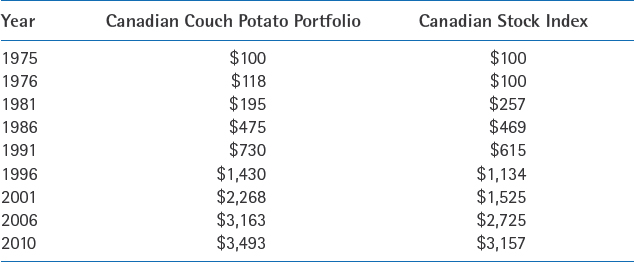
Source: Moneysense.ca (1976–2009 data) Globeinvestor.com (2009–2010 data)10
Creating a disciplined plan to rebalance a portfolio removes the guesswork from investing, and it forces investors to ignore their hearts. As I mentioned before, we don't tend to be rational. Most people like buying shares that have risen in value and they like selling shares that have fallen in value. Smart investors don't behave so irrationally.
Contrary to what many people think, beating a 100 percent stock market index is possible over time using bond indexes as your little helpers. You will end up with less volatility and the possibility of better returns.
Notes
1 David Swensen, Pioneering Portfolio Management (New York: Free Press, 2009), 170.
2 Paul Farrell, The Lazy Person's Guide to Investing (New York: Warner Business Books, 2004), 12.
3 Scott Burns, “Couch Potato Didn't Do the Market Mash,” February 2, 2003, Dallas News online, accessed November 1, 2010, http://www.dallasnews.com/s/dws/bus/scottburns/couch potato/columns/stories/020203dnbizburnscol.d6d1e.html.
4 Morningstar data for VTSMX (Vanguard total stock market index) and VGTSX (Vanguard total international stock market index) 2003–2008.
5 Scott Burns,“Sloth Triumphs Again,” UExpress.com, February 15, 2009, accessed November 1, 2010, http://www.uexpress.com/scottburns/index.html?uc_full_date=20090215.
6 Ibid.
7 “Monthly Self Managed Couch Potato Returns,” AssetBuilder, accessed January 16, 2011, http://assetbuilder.com/couch_potato/couch_potato_results.aspx.
8 Daniel Solin, The Smartest Investment Book You'll Ever Read (New York: Penguin, 2006), 63–64.
9 Ibid., 63.
10 “Couch Potato Performance,” MoneySense online, accessed November 1, 2010, http://www.moneysense.ca/2006/04/05/classic-couch-potato-portfolio-historical-performance-tables/.