
Chapter 4. NetFlow Commercial and Open Source Monitoring and Analysis Software Packages
This chapter covers the following topics:
![]() Commercial NetFlow monitoring and analysis software packages
Commercial NetFlow monitoring and analysis software packages
![]() Open source NetFlow monitoring and analysis software packages
Open source NetFlow monitoring and analysis software packages
Commercial NetFlow Monitoring and Analysis Software Packages
There are several commercial NetFlow monitoring and analysis software packages in the industry. Table 4-1 lists the most popular.
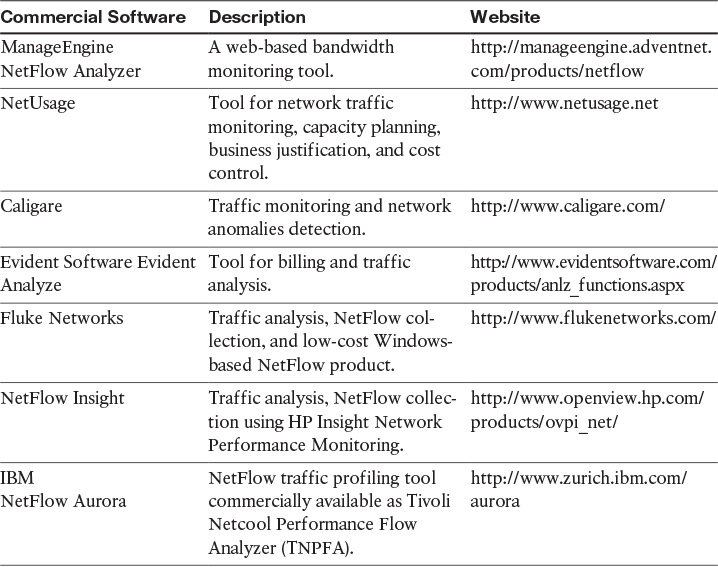
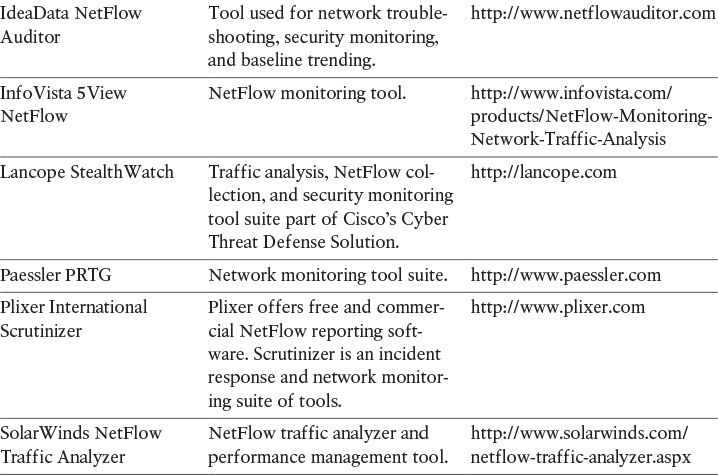
Two of the most popular commercial products are Lancope’s StealthWatch solution and Plixer Scrutinizer, as described in greater detail in the sections that follow.
Lancope’s StealthWatch Solution
Lancope’s StealthWatch solution is a key component of the Cisco Cyber Threat Defense (CTD) Solution. One of the key benefits of Lancope’s StealthWatch is its capability to scale in large enterprises. It also provides integration with the Cisco Identity Services Engine (ISE) for user identity information. Cisco ISE is a security policy management and control system that you can use for access control and security compliance for wired, wireless, and virtual private network (VPN) connections.
Note
The Cisco CTD Solution is covered in detail in Chapter 6, “Cisco Cyber Threat Defense and NetFlow.”
One other major benefit of Lancope’s StealthWatch is its graphical interface, which includes great visualizations of network traffic, customized summary reports, and integrated security and network intelligence for drill-down analysis.
Figure 4-1 shows a screenshot of Lancope’s StealthWatch Management Console (SMC).
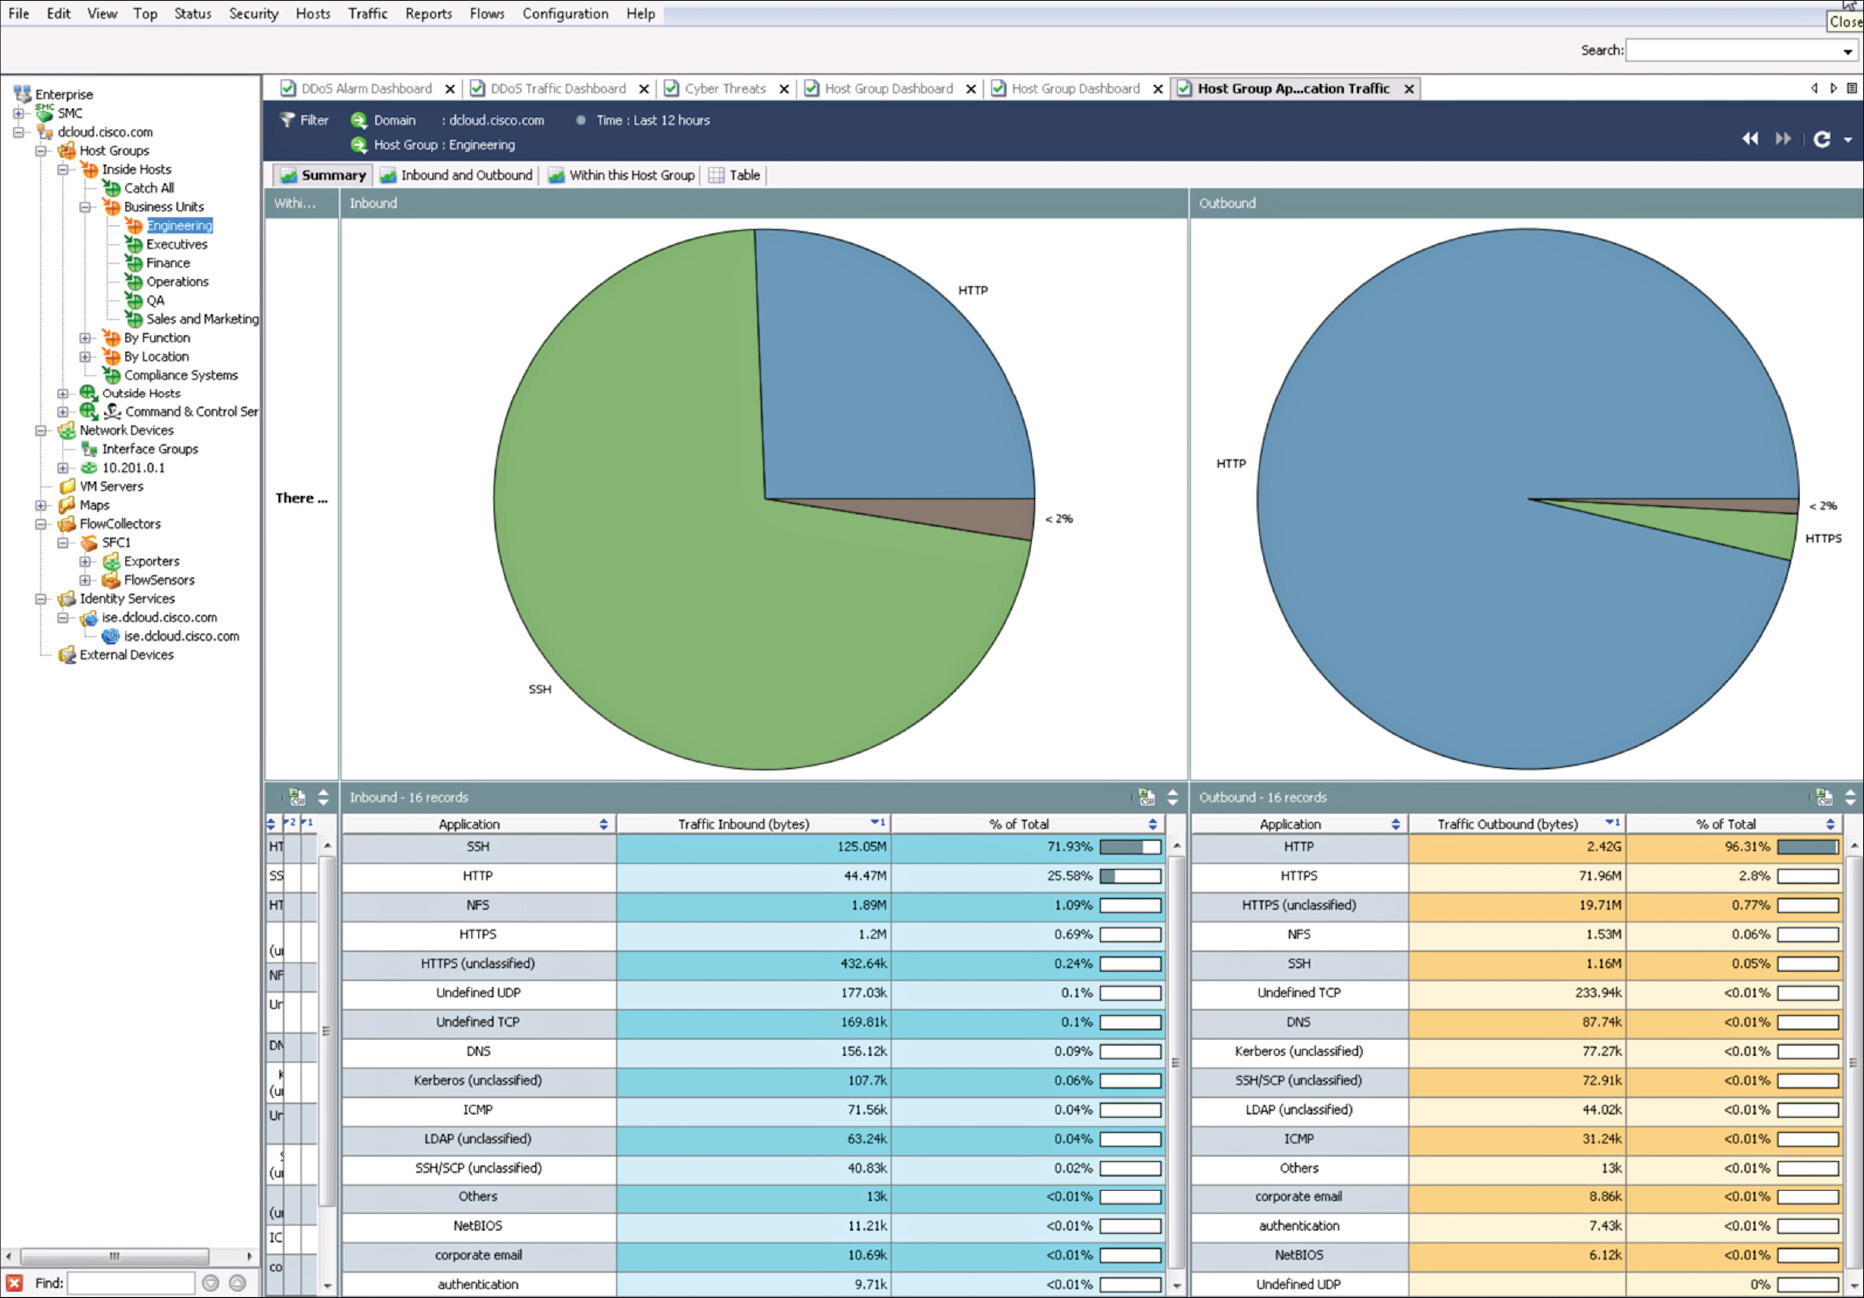
In Figure 4-1, a summary report of inbound and outbound traffic for a predefined host group in the inside network (Engineering) is displayed.
Figure 4-2 shows a report of the top applications observed in the network for the client and server host group called Inside Hosts. In this report, you can see that the top application observed was Skype. You can drill down each application and host to get more detailed information about what is happening in the network.

Lancope has a security research initiative that tracks emerging threat information from around the world called the StealthWatch Labs Intelligence Center (SLIC). Figure 4-3 illustrates the major components of Lancope’s StealthWatch solution.
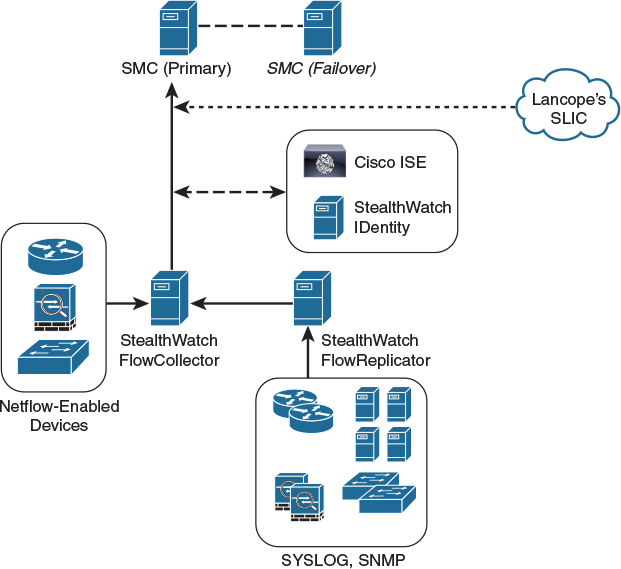
The following are the primary components of the Lancope StealthWatch solution shown in Figure 4-1:
![]() StealthWatch Management Console: Provides centralized management, configuration, and reporting of the other StealthWatch components. It can be deployed in a physical server or a virtual machine (VM). The StealthWatch Management Console provides high-availability features (failover), as shown in Figure 4-1.
StealthWatch Management Console: Provides centralized management, configuration, and reporting of the other StealthWatch components. It can be deployed in a physical server or a virtual machine (VM). The StealthWatch Management Console provides high-availability features (failover), as shown in Figure 4-1.
![]() FlowCollector: A physical or virtual appliance that collects NetFlow data from infrastructure devices.
FlowCollector: A physical or virtual appliance that collects NetFlow data from infrastructure devices.
![]() FlowSensor: A physical or virtual appliance that can generate NetFlow data when legacy Cisco network infrastructure components are not capable of producing line-rate, unsampled NetFlow data. Alternatively, the Cisco NetFlow Generator Appliance (NGA) can be used.
FlowSensor: A physical or virtual appliance that can generate NetFlow data when legacy Cisco network infrastructure components are not capable of producing line-rate, unsampled NetFlow data. Alternatively, the Cisco NetFlow Generator Appliance (NGA) can be used.
![]() FlowReplicator: A physical appliance used to forward NetFlow data as a single data stream to other devices.
FlowReplicator: A physical appliance used to forward NetFlow data as a single data stream to other devices.
![]() StealthWatch IDentity: Provides user identity monitoring capabilities. Administrators can search on user names to obtain a specific user network activity. Identity data can be obtained from the StealthWatch IDentity appliance or through integration with the Cisco ISE.
StealthWatch IDentity: Provides user identity monitoring capabilities. Administrators can search on user names to obtain a specific user network activity. Identity data can be obtained from the StealthWatch IDentity appliance or through integration with the Cisco ISE.
Note
Lancope StealthWatch also support usernames within NetFlow records from Cisco ASA appliances.
Lancope’s StealthWatch solution supports a feature called Network Address Translation (NAT) stitching. NAT stitching uses data from network devices to combine NAT information from inside a firewall (or a NAT device) with information from outside the firewall (or a NAT device) to identify which IP addresses and users are part of a specific flow.
Note
More information about Lancope’s StealthWatch solution is covered in Chapter 6, “Cisco Cyber Threat Defense and NetFlow,” and Chapter 8, “Case Studies.”
Plixer’s Scrutinizer
Plixer’s Scrutinizer is another commercial NetFlow monitoring and analysis software package that has gone through interoperability tests by Cisco. Scrutinizer is used for incident response and network monitoring. Just like several components of Lancope’s StealthWatch solution, Scrutinizer is available as a physical or virtual appliance.
Plixer also sells two other products that provide additional network visibility: FlowPro and Flow Replicator.
FlowPro is an appliance that can be deployed in a specific area of the corporate network to perform deep packet inspection (DPI) combining NetFlow/IPFIX data. Plixer’s Flow Replicator allows several sources of network device and server log data to be replicated to different destinations. Flow Replicator can also be configured as a syslog to IPFIX gateway. It converts syslog messages and forwards them on inside IPFIX datagrams.
Open Source NetFlow Monitoring and Analysis Software Packages
The number of open source NetFlow monitoring and analysis software packages is on the rise. You can use these open source tools to successfully identify security threats within your network.
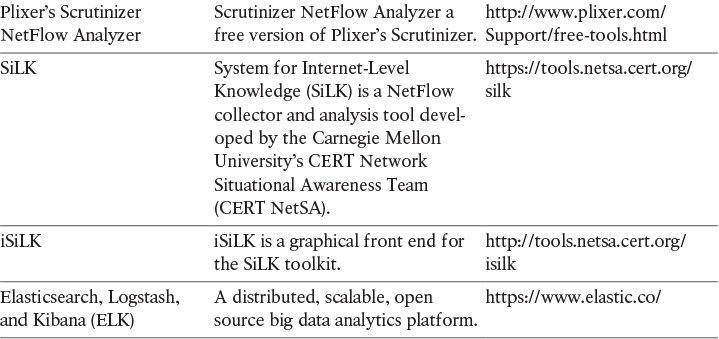
Table 4-2 lists the most popular open source NetFlow monitoring and analysis software packages.
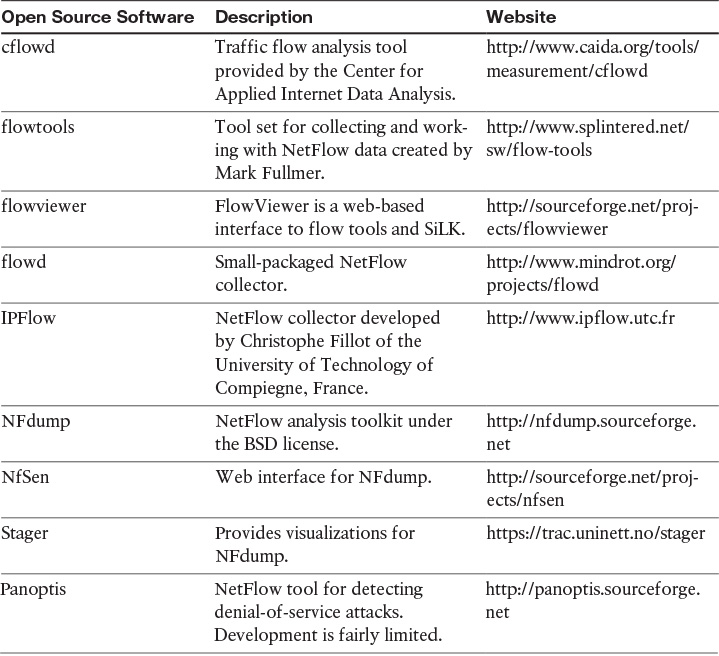
Two of the most popular open source NetFlow collection and analysis toolkits are NFdump (sometimes used with NfSen or Stager) and SiLK, as described in greater detail in the sections that follow.
NFdump
NFdump is a set of Linux-based tools that support NetFlow Versions 5, 7, and 9. You can download NFdump from http://nfdump.sourceforge.net and install it from source. Alternatively, you can easily install NFdump in multiple Linux distributions such as Ubuntu using sudo apt-get install nfdump, as shown in Example 4-1.
Example 4-1 Installing NFdump in Ubuntu
omar@server1:~$ sudo apt-get install nfdump
[sudo] password for omar:
Reading package lists... Done
Building dependency tree
Reading state information... Done
The following packages were automatically installed and are no longer required:
linux-headers-3.13.0-53 linux-headers-3.13.0-53-generic
linux-headers-3.13.0-54 linux-headers-3.13.0-54-generic
linux-image-3.13.0-53-generic linux-image-3.13.0-54-generic
linux-image-extra-3.13.0-53-generic linux-image-extra-3.13.0-54-generic
Use 'apt-get autoremove' to remove them.
The following extra packages will be installed:
fontconfig fonts-dejavu fonts-dejavu-core fonts-dejavu-extra libcairo2
libdatrie1 libdbi1 libgraphite2-3 libharfbuzz0b libpango-1.0-0
libpangocairo-1.0-0 libpangoft2-1.0-0 libpixman-1-0 librrd4 libthai-data
libthai0 libxcb-render0 libxcb-shm0 libxrender1 ttf-dejavu ttf-dejavu-core
ttf-dejavu-extra
Suggested packages:
ttf-baekmuk ttf-arphic-gbsn00lp ttf-arphic-bsmi00lp ttf-arphic-gkai00mp
ttf-arphic-bkai00mp
The following NEW packages will be installed:
fontconfig fonts-dejavu fonts-dejavu-core fonts-dejavu-extra libcairo2
libdatrie1 libdbi1 libgraphite2-3 libharfbuzz0b libpango-1.0-0
libpangocairo-1.0-0 libpangoft2-1.0-0 libpixman-1-0 librrd4 libthai-data
libthai0 libxcb-render0 libxcb-shm0 libxrender1 nfdump ttf-dejavu
ttf-dejavu-core ttf-dejavu-extra
0 upgraded, 23 newly installed, 0 to remove and 9 not upgraded.
Need to get 4,903 kB of archives.
After this operation, 17.1 MB of additional disk space will be used.
Do you want to continue? [Y/n]Y
...<output omitted>
Table 4-3 lists all the components of the NFdump toolkit.

Figure 4-4 illustrates the NFdump architecture and main components.

Routers, firewalls, and any other NetFlow-enabled infrastructure devices can send NetFlow records to NFdump, as shown in Figure 4-4. The command to capture the NetFlow data is nfcapd. All processed NetFlow records are stored in one or more binary files. These binary files are read by nfdump and can be displayed in plain text to standard output (stdout) or written to another file. Example 4-2 demonstrates how the nfcapd command is used to capture and store NetFlow data in a directory called netflow. The server is configured to listen to port 9996 for NetFlow communication.
Example 4-2 Using the nfcapd Command
omar@server1:~$ nfcapd -w -D -l netflow -p 9996
omar@server1:~$ cd netflow
omar@server1:~/netflow$ ls -l
total 544
-rw-r--r-- 1 omar omar 20772 Jun 18 00:45 nfcapd.201506180040
-rw-r--r-- 1 omar omar 94916 Jun 18 00:50 nfcapd.201506180045
-rw-r--r-- 1 omar omar 84108 Jun 18 00:55 nfcapd.201506180050
-rw-r--r-- 1 omar omar 78564 Jun 18 01:00 nfcapd.201506180055
-rw-r--r-- 1 omar omar 106732 Jun 18 01:05 nfcapd.201506180100
-rw-r--r-- 1 omar omar 73692 Jun 18 01:10 nfcapd.201506180105
-rw-r--r-- 1 omar omar 76996 Jun 18 01:15 nfcapd.201506180110
-rw-r--r-- 1 omar omar 276 Jun 18 01:15 nfcapd.current
Flows are read either from a single file or from a sequence of files. In Example 4-2, a series of files were created by the nfcapd daemon. Example 4-3 shows the command options of the nfcapd daemon command.
Example 4-3 nfcapd Daemon Command Options
omar@ server1:~$ nfcapd -h
usage nfcapd [options]
-h this text you see right here
-u userid Change user to username
-g groupid Change group to groupname
-w Sync file rotation with next 5min (default) interval
-t interval set the interval to rotate nfcapd files
-b host bind socket to host/IP addr
-j mcastgroup Join multicast group <mcastgroup>
-p portnum listen on port portnum
-l basdir set the output directory. (no default)
-S subdir Sub directory format. see nfcapd(1) for format
-I Ident set the ident string for stat file. (default 'none')
-H Add port histogram data to flow file.(default 'no')
-n Ident,IP,logdir Add this flow source - multiple streams
-P pidfile set the PID file
-R IP[/port] Repeat incoming packets to IP address/port
-s rate set default sampling rate (default 1)
-x process launch process after a new file becomes available
-z Compress flows in output file.
-B bufflen Set socket buffer to bufflen bytes
-e Expire data at each cycle.
-D Fork to background
-E Print extended format of netflow data. for debugging purpose only.
-T Include extension tags in records.
-4 Listen on IPv4 (default).
-6 Listen on IPv6.
-V Print version and exit.
Example 4-4 demonstrates how to use the nfdump command to process and analyze all files that were created by nfcapd in the netflow directory.
Example 4-4 Processing and Displaying the nfcapd Files with nfdump
omar@server1::~$ nfdump -R netflow -o extended -s srcip -s ip/flows
Top 10 Src IP Addr ordered by flows:
Date first seen Duration Proto Src IP Addr Flows(%)
Packets(%) Bytes(%) pps bps bpp
2015-06-13 22:35:10.805 2.353 any 192.168.1.140 1582(19.5)
0(-nan) 0(-nan) 0 0 0
2015-06-13 22:35:10.829 2.380 any 192.168.1.130 875(10.8)
0(-nan) 0(-nan) 0 0 0
2015-06-13 22:35:10.805 2.404 any 192.168.1.168 807( 9.9)
0(-nan) 0(-nan) 0 0 0
2015-06-13 22:35:11.219 1.839 any 192.168.1.142 679( 8.4)
0(-nan) 0(-nan) 0 0 0
2015-06-13 22:35:10.805 2.258 any 192.168.1.156 665( 8.2)
0(-nan) 0(-nan) 0 0 0
2015-06-13 22:35:10.805 2.297 any 192.168.1.205 562( 6.9)
0(-nan) 0(-nan) 0 0 0
2015-06-13 22:35:10.805 2.404 any 192.168.1.89 450( 5.5)
0(-nan) 0(-nan) 0 0 0
2015-06-13 22:35:11.050 1.989 any 10.248.91.231 248( 3.1)
0(-nan) 0(-nan) 0 0 0
2015-06-13 22:35:11.633 1.342 any 192.168.1.149 234( 2.9)
0(-nan) 0(-nan) 0 0 0
2015-06-13 22:35:11.040 2.118 any 192.168.1.157 213( 2.6)
0(-nan) 0(-nan) 0 0 0
Top 10 IP Addr ordered by flows:
Date first seen Duration Proto IP Addr Flows(%)
Packets(%) Bytes(%) pps bps bpp
2015-06-13 22:35:10.805 2.353 any 192.168.1.140 1582(19.5)
0(-nan) 0(-nan) 0 0 0
2015-06-13 22:35:10.805 2.353 any 10.8.8.8 1188(14.6)
0(-nan) 0(-nan) 0 0 0
2015-06-13 22:35:10.805 2.297 any 192.168.1.1 1041(12.8)
0(-nan) 0(-nan) 0 0 0
2015-06-13 22:35:10.829 2.380 any 192.168.1.130 875(10.8)
0(-nan) 0(-nan) 0 0 0
2015-06-13 22:35:10.805 2.404 any 192.168.1.168 807( 9.9)
0(-nan) 0(-nan) 0 0 0
2015-06-13 22:35:11.219 1.839 any 192.168.1.142 679( 8.4)
0(-nan) 0(-nan) 0 0 0
2015-06-13 22:35:10.805 2.258 any 192.168.1.156 665( 8.2)
0(-nan) 0(-nan) 0 0 0
2015-06-13 22:35:10.805 2.297 any 192.168.1.205 562( 6.9)
0(-nan) 0(-nan) 0 0 0
2015-06-13 22:35:10.825 2.277 any 10.190.38.99 467( 5.8)
0(-nan) 0(-nan) 0 0 0
2015-06-13 22:35:10.805 2.404 any 192.168.1.89 450( 5.5)
0(-nan) 0(-nan) 0 0 0
Summary: total flows: 8115, total bytes: 0, total packets: 0, avg bps: 0, avg
pps: 0, avg bpp: 0
Time window: 2015-06-13 22:35:10 - 2015-06-13 22:35:13
Total flows processed: 8115, Blocks skipped: 0, Bytes read: 457128
Sys: 0.009s flows/second: 829924.3 Wall: 0.008s flows/second: 967222.9
In Example 4-4, you can see the top talkers (top hosts that are sending the most traffic in the network). You can refer to the nfdump man pages for details about usage of the nfdump command (using the man nfdump command). Example 4-5 shows an excerpt of the output of the nfdump man pages showing several examples of the nfdump command usage.
Example 4-5 nfdump Man Pages Excerpt
EXAMPLES
nfdump -r /and/dir/nfcapd.201107110845 -c 100 'proto tcp and ( src ip
172.16.17.18 or dst ip 172.16.17.19 )' Dumps the first 100 netflow records which
match the given filter:
nfdump -r /and/dir/nfcapd.201107110845 -B Map matching flows as bin-
directional single flow.
nfdump -R /and/dir/nfcapd.201107110845:nfcapd.200407110945 'host 192.168.1.2'
Dumps all netflow records of host 192.168.1.2 from July 11 08:45 - 09:45
nfdump -M /to/and/dir1:dir2 -R nfcapd.200407110845:nfcapd.200407110945 -s
record -n 20 Generates the Top 20 statistics from 08:45 to 09:45 from 3 sources
nfdump -r /and/dir/nfcapd.201107110845 -s record -n 20 -o extended Generates
the Top 20 statistics, extended output format
nfdump -r /and/dir/nfcapd.201107110845 -s record -n 20 'in if 5 and bps >
10k' Generates the Top 20 statistics from flows comming from interface 5
nfdump -r /and/dir/nfcapd.201107110845 'inet6 and proto tcp and ( src port >
1024 and dst port 80 ) Dumps all port 80 IPv6 connections to any web server.
NOTES
Generating the statistics for data files of a few hundred MB is no problem.
However be careful if you want to create statistics of several GB of data. This
may consume a lot of memory and can take a while. Flow anonymization has moved
into nfanon.
SEE ALSO
nfcapd(1), nfanon(1), nfprofile(1), nfreplay(1)
NfSen
NfSen is the graphical web-based front end for NFdump. You can download and obtain more information about NFSen at http://nfsen.sourceforge.net.
SiLK
The SiLK analysis suite is a very popular open source command-line Swiss army knife developed by CERT. Administrators and security professionals combine these tools in various ways to perform detailed NetFlow analysis. SiLK includes numerous tools and plug-ins.
The SiLK Packing System includes several applications (daemons) that collect NetFlow data and translate them into a more space efficient format. SiLK stores these records into service-specific binary flat files for use by the analysis suite. Files are organized in a time-based directory hierarchy. The following are the SiLK daemons:
![]() flowcap: Listens to flow generators and stores the data in temporary files.
flowcap: Listens to flow generators and stores the data in temporary files.
![]() rwflowpack: Processes flow data either directly from a flow generator or from files generated by flowcap. Then it converts the data to the SiLK flow record format.
rwflowpack: Processes flow data either directly from a flow generator or from files generated by flowcap. Then it converts the data to the SiLK flow record format.
![]() rwflowappend: Appends flow records to hourly files organized in a time-based directory tree.
rwflowappend: Appends flow records to hourly files organized in a time-based directory tree.
![]() rwsender: Watches an incoming directory for files, moves the files into a processing directory, and transfers the files to one or more rwreceiver processes.
rwsender: Watches an incoming directory for files, moves the files into a processing directory, and transfers the files to one or more rwreceiver processes.
![]() rwreceiver: Receives and processes files transferred from one or more rwsender processes and stores them in a destination directory.
rwreceiver: Receives and processes files transferred from one or more rwsender processes and stores them in a destination directory.
![]() rwpollexec: Monitors a directory for incoming files and runs a user-specified command on each file.
rwpollexec: Monitors a directory for incoming files and runs a user-specified command on each file.
![]() rwpackchecker: Reads SiLK flow records and checks for unusual patterns that may indicate data file corruption.
rwpackchecker: Reads SiLK flow records and checks for unusual patterns that may indicate data file corruption.
![]() packlogic-twoway and packlogic-generic: Plug-ins that rwflowpack may use when categorizing flow records.
packlogic-twoway and packlogic-generic: Plug-ins that rwflowpack may use when categorizing flow records.
SiLK Configuration Files
The following are the SiLK configuration files:
![]() silk.conf: Defines the classes, types, and sensors
silk.conf: Defines the classes, types, and sensors
![]() sensor.conf: Defines sensors and probes used by rwflowpack and flowcap
sensor.conf: Defines sensors and probes used by rwflowpack and flowcap
Filtering, Displaying, and Sorting NetFlow Records with SiLK
The following are the tools included in SiLK used for filtering, displaying, and sorting NetFlow records:
![]() rwfilter: The most important analysis tool in SiLK. It is an application for querying NetFlow records stored in SiLK’s database.
rwfilter: The most important analysis tool in SiLK. It is an application for querying NetFlow records stored in SiLK’s database.
![]() rwcut: Prints the attributes of NetFlow records in a delimited/columnar format. It can be integrated with plug-ins written in C or PySiLK.
rwcut: Prints the attributes of NetFlow records in a delimited/columnar format. It can be integrated with plug-ins written in C or PySiLK.
![]() rwsort: Sorting utility for SiLK’s NetFlow records.
rwsort: Sorting utility for SiLK’s NetFlow records.
SiLK’s Python Extension
SiLK’s Python Extension (PySiLK) can be used to read, manipulate, and write SiLK NetFlow records in Python. PySiLK can be deployed as a standalone Python program or to write plug-ins for several SiLK applications. SiLK Python plug-in (silkpython.so) can be used by PySiLK to define new partitioning rules for rwfilter; new key fields for rwcut, rwgroup, and rwsort; and fields in rwstats and rwuniq.
Counting, Grouping, and Mating NetFlow Records with Silk
The following are the tools included in SiLK used for counting, grouping, and mating NetFlow records:
![]() rwcount: Used to count and summarize NetFlow records across time (referred to as time bins). Its output includes counts of bytes, packets, and flow records for each time bin.
rwcount: Used to count and summarize NetFlow records across time (referred to as time bins). Its output includes counts of bytes, packets, and flow records for each time bin.
![]() rwuniq: User-specified key unique record attributes. It can print columns for the total byte, packet, and/or flow counts for each bin. rwuniq can also count the number of individual values for a field.
rwuniq: User-specified key unique record attributes. It can print columns for the total byte, packet, and/or flow counts for each bin. rwuniq can also count the number of individual values for a field.
![]() rwstats: Summarizes NetFlow records just like rwuniq, but sorts the results by a value field to generate a Top-N or Bottom-N list and prints the results.
rwstats: Summarizes NetFlow records just like rwuniq, but sorts the results by a value field to generate a Top-N or Bottom-N list and prints the results.
![]() rwtotal: Summarizes NetFlow records by a specified key and print the sum of the byte, packet, and flow counts for flows matching such key. rwtotal is faster than rwuniq because it uses a fixed amount of memory; however, it has a limited set of keys.
rwtotal: Summarizes NetFlow records by a specified key and print the sum of the byte, packet, and flow counts for flows matching such key. rwtotal is faster than rwuniq because it uses a fixed amount of memory; however, it has a limited set of keys.
![]() rwaddrcount: Organizes NetFlow records by the source or destination IPv4 address and prints the byte, packet, and flow counts for each IP.
rwaddrcount: Organizes NetFlow records by the source or destination IPv4 address and prints the byte, packet, and flow counts for each IP.
![]() rwgroup: Groups NetFlow records by a user-specified key that include record attributes, labels the records with a group ID that is stored in the Next-Hop IP field, and writes the resulting binary flows to a file or to standard output.
rwgroup: Groups NetFlow records by a user-specified key that include record attributes, labels the records with a group ID that is stored in the Next-Hop IP field, and writes the resulting binary flows to a file or to standard output.
![]() rwmatch: Matches records as queries and responses, marks mated records with an identifier that is stored in the Next-Hop IP field, and writes the binary flow records to the output.
rwmatch: Matches records as queries and responses, marks mated records with an identifier that is stored in the Next-Hop IP field, and writes the binary flow records to the output.
SiLK IPset, Bag, and Prefix Map Manipulation Tools
The following are the tools included in SiLK for IPset, bag, and prefix map manipulation:
![]() rwset: Generates binary IPset files containing the source IP addresses or destination IP addresses in NetFlow records.
rwset: Generates binary IPset files containing the source IP addresses or destination IP addresses in NetFlow records.
![]() rwsetbuild: Reads IP addresses in canonical form or in classless interdomain routing (CIDR) notation from an input file or from the standard input and write a binary IPset file.
rwsetbuild: Reads IP addresses in canonical form or in classless interdomain routing (CIDR) notation from an input file or from the standard input and write a binary IPset file.
![]() rwsetcat: Prints the contents of a binary IPset file as text along with additional information from the NetFlow record.
rwsetcat: Prints the contents of a binary IPset file as text along with additional information from the NetFlow record.
![]() rwsetmember: Determines whether the specified IP address or CIDR block is included in an IPset.
rwsetmember: Determines whether the specified IP address or CIDR block is included in an IPset.
![]() rwsettool: Unifies and determines the intersection, difference, and sampling functions on the input IPset files, generating a new IPset file.
rwsettool: Unifies and determines the intersection, difference, and sampling functions on the input IPset files, generating a new IPset file.
![]() rwbag: Reads NetFlow records and builds binary bags containing key-count pairs.
rwbag: Reads NetFlow records and builds binary bags containing key-count pairs.
![]() rwbagbuild: Creates a binary bag file.
rwbagbuild: Creates a binary bag file.
![]() rwbagcat: Prints binary bag files as text.
rwbagcat: Prints binary bag files as text.
![]() rwbagtool: Adds or subtracts attributes within binary bag files and produces a new binary bag file.
rwbagtool: Adds or subtracts attributes within binary bag files and produces a new binary bag file.
![]() rwpmapbuild: Generates a binary prefix map file for use with the Address Type (addrtype) and Prefix Map (pmapfilter) utilities.
rwpmapbuild: Generates a binary prefix map file for use with the Address Type (addrtype) and Prefix Map (pmapfilter) utilities.
![]() rwpmapcat: Prints a prefix map file as text.
rwpmapcat: Prints a prefix map file as text.
![]() rwpmaplookup: Finds information about specific IP addresses, ports, or protocol information in a binary prefix map file and prints the result as text.
rwpmaplookup: Finds information about specific IP addresses, ports, or protocol information in a binary prefix map file and prints the result as text.
![]() rwipaimport: Used to import a SiLK IPset, bag, or prefix map files into the IP Address Association (IPA) data store.
rwipaimport: Used to import a SiLK IPset, bag, or prefix map files into the IP Address Association (IPA) data store.
![]() rwipaexport: Used to export a set of IP addresses from the IPA data store to a SiLK IPset, bag, or prefix map.
rwipaexport: Used to export a set of IP addresses from the IPA data store to a SiLK IPset, bag, or prefix map.
IP and Port Labeling Files
The addrtype file in SiLK allows an administrator to map an IPv4 address to an integer denoting the IP as internal, external, or nonroutable. The country code file (ccfilter) maps an IPv4 address to a two-letter, lowercase abbreviation of the country where the IP address is located. The prefix map file (pmapfilter) associates IP addresses or protocol/port pairs to string labels based on a user-defined map file. The map file is created by rwpmapbuild.
SiLK Runtime Plug-Ins
The following are SiLK’s runtime plug-ins:
![]() flowrate: Adds switches and fields to compute packets/second, bytes/second, bytes/packet, payload-bytes, and payload-bytes/second. This plug-in must be loaded explicitly in SiLK after initial installation.
flowrate: Adds switches and fields to compute packets/second, bytes/second, bytes/packet, payload-bytes, and payload-bytes/second. This plug-in must be loaded explicitly in SiLK after initial installation.
![]() int-ext-fields: Prints fields containing internal and external IPs and ports (int-ip, ext-ip, int-port, and ext-port).
int-ext-fields: Prints fields containing internal and external IPs and ports (int-ip, ext-ip, int-port, and ext-port).
![]() ipafilter: Known as the IP Association (IPA) plug-in. It works with rwfilter to partition flows based on data in an IPA data store. rwfilter will automatically load this plug-in if it is available. This plug-in requires that SiLK be compiled with IPA support.
ipafilter: Known as the IP Association (IPA) plug-in. It works with rwfilter to partition flows based on data in an IPA data store. rwfilter will automatically load this plug-in if it is available. This plug-in requires that SiLK be compiled with IPA support.
![]() silk-plugin: Enables an administrator to create SiLK plug-ins using C.
silk-plugin: Enables an administrator to create SiLK plug-ins using C.
SiLK Utilities for Packet Capture and IPFIX Processing
The following are the utilities included in SiLK for packet capture and IPFIX processing:
![]() rwp2yaf2silk: Converts a packet-capture (pcap) file to a single file of SiLK flow records. It requires the yaf and rwipfix2silk commands.
rwp2yaf2silk: Converts a packet-capture (pcap) file to a single file of SiLK flow records. It requires the yaf and rwipfix2silk commands.
![]() rwipfix2silk: Converts IPFIX records to the SiLK flow record format.
rwipfix2silk: Converts IPFIX records to the SiLK flow record format.
![]() rwsilk2ipfix: Converts SiLK flow records to IPFIX format.
rwsilk2ipfix: Converts SiLK flow records to IPFIX format.
![]() rwpcut: Reads a packet-capture file and prints its contents in a textual form similar to that produced by rwcut.
rwpcut: Reads a packet-capture file and prints its contents in a textual form similar to that produced by rwcut.
![]() rwpdedupe: Detects and removes duplicate records from multiple packet capture input files.
rwpdedupe: Detects and removes duplicate records from multiple packet capture input files.
![]() rwpmatch: Filters a packet-capture file by writing only packets whose five-tuple and time stamp match corresponding records in a SiLK flow file.
rwpmatch: Filters a packet-capture file by writing only packets whose five-tuple and time stamp match corresponding records in a SiLK flow file.
![]() rwptoflow: Generates a SiLK flow record for every packet.
rwptoflow: Generates a SiLK flow record for every packet.
![]() rwpdu2silk: Creates a stream of SiLK flow records from a file containing NetFlow v5 PDU records.
rwpdu2silk: Creates a stream of SiLK flow records from a file containing NetFlow v5 PDU records.
Utilities to Detect Network Scans
The following are the utilities included in SiLK for network scan detection:
![]() rwscan: Used to detect scanning activity from SiLK flow records.
rwscan: Used to detect scanning activity from SiLK flow records.
![]() rwscanquery: Used to query the scan database generated by rwscan.
rwscanquery: Used to query the scan database generated by rwscan.
SiLK Flow File Utilities
The following are the flow file utilities included in SiLK:
![]() rwappend: Appends the SiLK flow records contained SiLK files.
rwappend: Appends the SiLK flow records contained SiLK files.
![]() rwcat: Reads SiLK flow records from the files named on the command line. Similar to the Linux cat command.
rwcat: Reads SiLK flow records from the files named on the command line. Similar to the Linux cat command.
![]() rwcompare: Compares two SiLK flow files to determine whether they contain the same flow records.
rwcompare: Compares two SiLK flow files to determine whether they contain the same flow records.
![]() rwdedupe: Removes any duplicate flow records. rwdedupe will reorder the records as part of its processing.
rwdedupe: Removes any duplicate flow records. rwdedupe will reorder the records as part of its processing.
![]() rwnetmask: “Zeroizes” the least significant bits of the source, destination, or next-hop IP addresses, and writes the resulting records to a file or standard output.
rwnetmask: “Zeroizes” the least significant bits of the source, destination, or next-hop IP addresses, and writes the resulting records to a file or standard output.
![]() rwrandomizeip: Substitutes records using a pseudo-random IP address for the source and destination IP addresses in a stipulated input file.
rwrandomizeip: Substitutes records using a pseudo-random IP address for the source and destination IP addresses in a stipulated input file.
![]() rwsplit: Splits SiLK files in a set of subfiles from the input.
rwsplit: Splits SiLK files in a set of subfiles from the input.
![]() rwswapbytes: Changes the byte order of the records in a given input SiLK flow file.
rwswapbytes: Changes the byte order of the records in a given input SiLK flow file.
Additional SiLK Utilities
The following are several additional SiLK utilities:
![]() rwfileinfo: Prints file information, including file type, version, and other attributes.
rwfileinfo: Prints file information, including file type, version, and other attributes.
![]() rwsiteinfo: Prints information about the sensors, classes, and types specified in the silk.conf file.
rwsiteinfo: Prints information about the sensors, classes, and types specified in the silk.conf file.
![]() rwtuc: Creates SiLK flow records from textual input.
rwtuc: Creates SiLK flow records from textual input.
![]() rwfglob: Prints the list of files that rwfilter would normally process for a given set of file selection switches.
rwfglob: Prints the list of files that rwfilter would normally process for a given set of file selection switches.
![]() num2dot: Processes delimited text from the standard input, converts integer values in the specified columns to dotted-decimal IP address, and prints the result to standard output.
num2dot: Processes delimited text from the standard input, converts integer values in the specified columns to dotted-decimal IP address, and prints the result to standard output.
![]() rwresolve: Processes delimited text from the standard input, attempts to resolve the IP addresses in the specified columns to hostnames, and prints the result to the standard output.
rwresolve: Processes delimited text from the standard input, attempts to resolve the IP addresses in the specified columns to hostnames, and prints the result to the standard output.
![]() rwrecgenerator: Creates SiLK flow records using a pseudo-random number generator.
rwrecgenerator: Creates SiLK flow records using a pseudo-random number generator.
![]() rwgeoip2ccmap: Generates the country code mapping file required by the ccfilter utility from the MaxMind GeoIP database. For more information about the MaxMind GeoIP database, go to https://www.maxmind.com/en/geolocation_landing.
rwgeoip2ccmap: Generates the country code mapping file required by the ccfilter utility from the MaxMind GeoIP database. For more information about the MaxMind GeoIP database, go to https://www.maxmind.com/en/geolocation_landing.
![]() rwidsquery: Invokes rwfilter to find flow records matching Cisco Sourcefire Snort signatures.
rwidsquery: Invokes rwfilter to find flow records matching Cisco Sourcefire Snort signatures.
![]() silk_config: Prints information about how SiLK was compiled. This information can be used for troubleshooting purposes.
silk_config: Prints information about how SiLK was compiled. This information can be used for troubleshooting purposes.
Chapter 8, “Case Studies” provides several examples of how SiLK is used in a small and medium-sized enterprise.
Elasticsearch, Logstash, and Kibana Stack
Elasticsearch ELK stack is a very powerful open source analytics platform. ELK stands for Elasticsearch, Logstash, and Kibana. Figure 4-5 illustrates the main components of ELK.
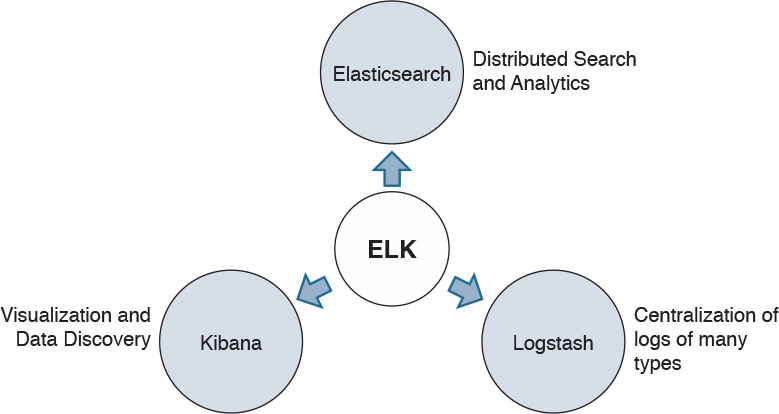
The following sections provide details about the components illustrated in Figure 4-5.
Elasticsearch
Elasticsearch is the name of a distributed search and analytics engine, but it is also the name of the company founded by the folks behind Elasticsearch and Apache Lucene. Elasticsearch is built on top of Apache Lucene, which is a high-performance search and information retrieval library that is written in Java. Elasticsearch is a schema-free, full text search engine with multilanguage support. It provides support for geolocation, suggestive search, autocompletion, and search snippets.
Logstash
Logstash offers centralized log aggregation of many types, such as network infrastructure device logs, server logs, and also Netflow. Logstash is written in JRuby and runs in a Java Virtual Machine (JVM). It has a very simple message-based architecture. Logstash has a single agent that is configured to perform different functions in combination with the other ELK components. Figure 4-6 illustrates Logstash’s architecture.
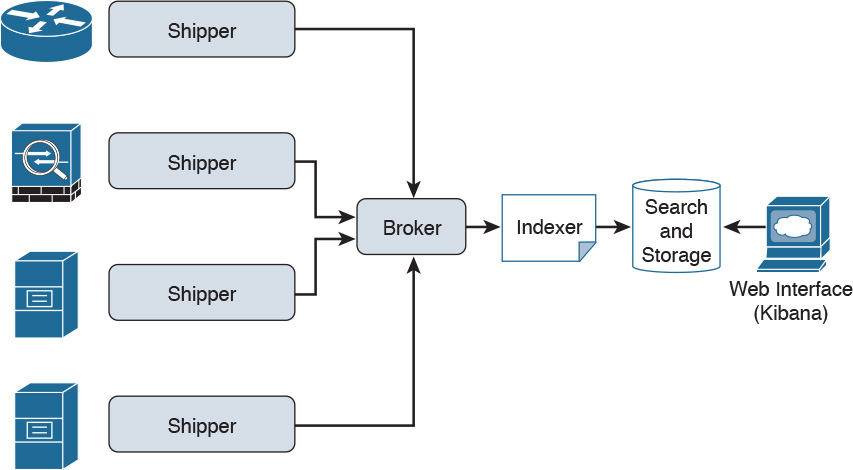
In Figure 4-6, you can see the four major components in the Logstash ecosystem. The following are the details of each component:
![]() The shipper: Sends events to Logstash. Typically, remote agents will only run this component.
The shipper: Sends events to Logstash. Typically, remote agents will only run this component.
![]() The broker and indexer: Receive and index the events.
The broker and indexer: Receive and index the events.
![]() The search and storage: Allows you to search and store events.
The search and storage: Allows you to search and store events.
![]() The web interface: A web-based interface. This web-based interface is called Kibana, and we cover it in the following sessions.
The web interface: A web-based interface. This web-based interface is called Kibana, and we cover it in the following sessions.
Logstash is very scalable because servers running Logstash can run one or more of these aforementioned components independently.
Kibana
Kibana is an analytics and visualization platform architected for Elasticsearch. It provides real-time summary and charting of streaming data, with the ability to share and embed dashboards.
Elasticsearch Marvel and Shield
Marvel and Shield are two additional components that can be integrated with ELK:
![]() Marvel: Provides monitoring of an Elasticsearch deployment. It uses Kibana to visualize the data. It provides a detailed explanation of things that are happening within the ELK deployment that are very useful for troubleshooting and additional analysis. You can obtain information about Marvel at http://www.elasticsearch.org/overview/marvel.
Marvel: Provides monitoring of an Elasticsearch deployment. It uses Kibana to visualize the data. It provides a detailed explanation of things that are happening within the ELK deployment that are very useful for troubleshooting and additional analysis. You can obtain information about Marvel at http://www.elasticsearch.org/overview/marvel.
![]() Shield: Provides security features to ELK such as role-based access control, authentication, IP filtering, encryption of ELK data, and audit logging. Shield is not free, and it requires a license. You can obtain more information about Shield at http://www.elasticsearch.org/overview/shield.
Shield: Provides security features to ELK such as role-based access control, authentication, IP filtering, encryption of ELK data, and audit logging. Shield is not free, and it requires a license. You can obtain more information about Shield at http://www.elasticsearch.org/overview/shield.
Elasticsearch also provides integration with big data platforms such as Hadoop.
The following sections provide several tips and guidance on how to deploy ELK for NetFlow analysis.
ELK Deployment Topology
The topology illustrated in Figure 4-7 is used in the following examples.

In Figure 4-7, a NetFlow-enabled router (R1) is deployed in the network to monitor traffic between the corporate network and the Internet. ELK is installed on a server running Ubuntu Server to collect and analyze NetFlow records generated by R1.
Installing ELK
Java is required for Elasticsearch and Logstash to work. You can install OpenJDK or Oracle Java. In the following example, Oracle Java is installed. You can use the sudo add-apt-repository -y ppa:webupd8team/java command to add the Oracle Java Personal Package Archive (PPA) to the Ubuntu Server, as shown in Example 4-6.
Example 4-6 Adding the Oracle Java PPA
omar@elk-srv1:~$ sudo add-apt-repository -y ppa:webupd8team/java
gpg: keyring `/tmp/tmpe2orytku/secring.gpg' created
gpg: keyring `/tmp/tmpe2orytku/pubring.gpg' created
gpg: requesting key EEA14886 from hkp server keyserver.ubuntu.com
gpg: /tmp/tmpe2orytku/trustdb.gpg: trustdb created
gpg: key EEA14886: public key "Launchpad VLC" imported
gpg: Total number processed: 1
gpg: imported: 1 (RSA: 1)
OK
omar@omar-srv1:~$
After you add the PPA, update the apt package database with the sudo apt-get update command, as shown in Example 4-7.
Example 4-7 Updating the apt Package Database
omar@elk-srv1:~$ sudo apt-get update
sudo: unable to resolve host omar-srv1
Ign http://us.archive.ubuntu.com trusty InRelease
Ign http://us.archive.ubuntu.com trusty-updates InRelease
Ign http://us.archive.ubuntu.com trusty-backports InRelease
Hit http://us.archive.ubuntu.com trusty Release.gpg
Ign http://security.ubuntu.com trusty-security InRelease
Get:1 http://us.archive.ubuntu.com trusty-updates Release.gpg [933 B]
Get:2 http://us.archive.ubuntu.com trusty-backports Release.gpg [933 B]
Ign http://ppa.launchpad.net trusty InRelease
Hit http://us.archive.ubuntu.com trusty Release
Get:3 http://security.ubuntu.com trusty-security Release.gpg [933 B]
<...output omited>
Ign http://us.archive.ubuntu.com trusty/multiverse Translation-en_US
Ign http://us.archive.ubuntu.com trusty/restricted Translation-en_US
Ign http://us.archive.ubuntu.com trusty/universe Translation-en_US
Fetched 4,014 kB in 6s (590 kB/s)
Reading package lists... Done
omar@omar-srv1:~$
Install the latest stable version of Oracle Java with the sudo apt-get -y install oracle-javaXX-installer command (XX is the version of Java). Oracle Java 8 is installed as follows:
omar@elk-srv1:~$ sudo apt-get -y install oracle-java8-installer
Installing Elasticsearch
The following are the steps necessary in order to install Elasticsearch in Ubuntu Server:
Step 1. Add the Elasticsearch public GPG key into apt with the following command:
wget -O - http://packages.elasticsearch.org/GPG-KEY-elasticsearch |
sudo apt-key add -
Step 2. Create the Elasticsearch source list with the following command:
echo 'deb http://packages.elasticsearch.org/elasticsearch/1.4/debian
stable main' |
sudo tee /etc/apt/sources.list.d/elasticsearch.list
Step 3. Use the sudo apt-get update command to update your apt package database.
Step 4. Install Elasticsearch with the sudo apt-get -y install elasticsearch=1.4.4 command. In this example, Elasticsearch Version 1.4.4 is installed. For the latest version of Elasticsearch, visit https://www.elastic.co.
Step 5. The Elasticsearch configuration resides in the /etc/elasticsearch/elasticsearch.yml file. To edit the configuration file, use your favorite editor. (Vi is used in this example: sudo vi /etc/elasticsearch/elasticsearch.yml.) It is a best practice to restrict access to the Elasticsearch installation on port 9200 to only local host traffic. Uncomment the line that specifies network.host in the elasticsearch.yml file and replace its value with localhost. Example 4-8 includes the complete elasticsearch.yml file for your reference.
Example 4-8 The elasticsearch.yml Configuration File
# This file contains an overview of various configuration settings,
# targeted at operations staff. Application developers should
# consult the guide at <http://elasticsearch.org/guide>.
#
# The installation procedure is covered at
# <http://elasticsearch.org/guide/en/elasticsearch/reference/current/setup.html>.
#
# Elasticsearch comes with reasonable defaults for most settings,
# so you can try it out without bothering with configuration.
#
# Most of the time, these defaults are just fine for running a production
# cluster. If you're fine-tuning your cluster, or wondering about the
# effect of certain configuration option, please _do ask_ on the
# mailing list or IRC channel [http://elasticsearch.org/community].
# Any element in the configuration can be replaced with environment variables
# by placing them in ${...} notation. For example:
#
#node.rack: ${RACK_ENV_VAR}
# For information on supported formats and syntax for the config file, see
# <http://elasticsearch.org/guide/en/elasticsearch/reference/current/setup-configu-
ration.html>
################################### Cluster ###################################
# Cluster name identifies your cluster for auto-discovery. If you're running
# multiple clusters on the same network, make sure you're using unique names.
#
#cluster.name: elasticsearch
#################################### Node #####################################
# Node names are generated dynamically on startup, so you're relieved
# from configuring them manually. You can tie this node to a specific name:
#
#node.name: "Franz Kafka"
# Every node can be configured to allow or deny being eligible as the master,
# and to allow or deny to store the data.
#
# Allow this node to be eligible as a master node (enabled by default):
#
#node.master: true
#
# Allow this node to store data (enabled by default):
#
#node.data: true
# You can exploit these settings to design advanced cluster topologies.
#
# 1. You want this node to never become a master node, only to hold data.
# This will be the "workhorse" of your cluster.
#
#node.master: false
#node.data: true
#
# 2. You want this node to only serve as a master: to not store any data and
# to have free resources. This will be the "coordinator" of your cluster.
#
#node.master: true
#node.data: false
#
# 3. You want this node to be neither master nor data node, but
# to act as a "search load balancer" (fetching data from nodes,
# aggregating results, etc.)
#
#node.master: false
#node.data: false
# Use the Cluster Health API [http://localhost:9200/_cluster/health], the
# Node Info API [http://localhost:9200/_nodes] or GUI tools
# such as <http://www.elasticsearch.org/overview/marvel/>,
# <http://github.com/karmi/elasticsearch-paramedic>,
# <http://github.com/lukas-vlcek/bigdesk> and
# <http://mobz.github.com/elasticsearch-head> to inspect the cluster state.
# A node can have generic attributes associated with it, which can later be used
# for customized shard allocation filtering, or allocation awareness. An attribute
# is a simple key value pair, similar to node.key: value, here is an example:
#
#node.rack: rack314
# By default, multiple nodes are allowed to start from the same installation loca-
tion
# to disable it, set the following:
#node.max_local_storage_nodes: 1
#################################### Index ####################################
# You can set a number of options (such as shard/replica options, mapping
# or analyzer definitions, translog settings, ...) for indices globally,
# in this file.
#
# Note, that it makes more sense to configure index settings specifically for
# a certain index, either when creating it or by using the index templates API.
#
# See <http://elasticsearch.org/guide/en/elasticsearch/reference/current/index-mod-
ules.html> and
# <http://elasticsearch.org/guide/en/elasticsearch/reference/current/indices-create-
index.html>
# for more information.
# Set the number of shards (splits) of an index (5 by default):
#
#index.number_of_shards: 5
# Set the number of replicas (additional copies) of an index (1 by default):
#
#index.number_of_replicas: 1
# Note, that for development on a local machine, with small indices, it usually
# makes sense to "disable" the distributed features:
#
#index.number_of_shards: 1
#index.number_of_replicas: 0
# These settings directly affect the performance of index and search operations
# in your cluster. Assuming you have enough machines to hold shards and
# replicas, the rule of thumb is:
#
# 1. Having more *shards* enhances the _indexing_ performance and allows to
# _distribute_ a big index across machines.
# 2. Having more *replicas* enhances the _search_ performance and improves the
# cluster _availability_.
#
# The "number_of_shards" is a one-time setting for an index.
#
# The "number_of_replicas" can be increased or decreased anytime,
# by using the Index Update Settings API.
#
# Elasticsearch takes care about load balancing, relocating, gathering the
# results from nodes, etc. Experiment with different settings to fine-tune
# your setup.
# Use the Index Status API (<http://localhost:9200/A/_status>) to inspect
# the index status.
#################################### Paths ####################################
# Path to directory containing configuration (this file and logging.yml):
#
#path.conf: /path/to/conf
# Path to directory where to store index data allocated for this node.
#
#path.data: /path/to/data
#
# Can optionally include more than one location, causing data to be striped across
# the locations (a la RAID 0) on a file level, favoring locations with most free
# space on creation. For example:
#
#path.data: /path/to/data1,/path/to/data2
# Path to temporary files:
#
#path.work: /path/to/work
# Path to log files:
#
#path.logs: /path/to/logs
# Path to where plugins are installed:
#
#path.plugins: /path/to/plugins
#################################### Plugin ###################################
# If a plugin listed here is not installed for current node, the node will not
start.
#
#plugin.mandatory: mapper-attachments,lang-groovy
################################### Memory ####################################
# Elasticsearch performs poorly when JVM starts swapping: you should ensure that
# it _never_ swaps.
#
# Set this property to true to lock the memory:
#
#bootstrap.mlockall: true
# Make sure that the ES_MIN_MEM and ES_MAX_MEM environment variables are set
# to the same value, and that the machine has enough memory to allocate
# for Elasticsearch, leaving enough memory for the operating system itself.
#
# You should also make sure that the Elasticsearch process is allowed to lock
# the memory, eg. by using `ulimit -l unlimited`.
############################## Network And HTTP ###############################
# Elasticsearch, by default, binds itself to the 0.0.0.0 address, and listens
# on port [9200-9300] for HTTP traffic and on port [9300-9400] for node-to-node
# communication. (The range means that if the port is busy, it will automatically
# try the next port).
# Set the bind address specifically (IPv4 or IPv6):
#
#network.bind_host: 192.168.0.1
# Set the address other nodes will use to communicate with this node. If not
# set, it is automatically derived. It must point to an actual IP address.
#
#network.publish_host: 192.168.0.1
# Set both 'bind_host' and 'publish_host':
#
network.host: localhost
# Set a custom port for the node to node communication (9300 by default):
#
#transport.tcp.port: 9300
# Enable compression for all communication between nodes (disabled by default):
#
#transport.tcp.compress: true
# Set a custom port to listen for HTTP traffic:
#
#http.port: 9200
# Set a custom allowed content length:
#
#http.max_content_length: 100mb
# Disable HTTP completely:
#
#http.enabled: false
################################### Gateway ###################################
# The gateway allows for persisting the cluster state between full cluster
# restarts. Every change to the state (such as adding an index) will be stored
# in the gateway, and when the cluster starts up for the first time,
# it will read its state from the gateway.
# There are several types of gateway implementations. For more information, see
# <http://elasticsearch.org/guide/en/elasticsearch/reference/current/modules-gate-
way.html>.
# The default gateway type is the "local" gateway (recommended):
#
#gateway.type: local
# Settings below control how and when to start the initial recovery process on
# a full cluster restart (to reuse as much local data as possible when using shared
# gateway).
# Allow recovery process after N nodes in a cluster are up:
#
#gateway.recover_after_nodes: 1
# Set the timeout to initiate the recovery process, once the N nodes
# from previous setting are up (accepts time value):
#
#gateway.recover_after_time: 5m
# Set how many nodes are expected in this cluster. Once these N nodes
# are up (and recover_after_nodes is met), begin recovery process immediately
# (without waiting for recover_after_time to expire):
#
#gateway.expected_nodes: 2
############################# Recovery Throttling #############################
# These settings allow to control the process of shards allocation between
# nodes during initial recovery, replica allocation, rebalancing,
# or when adding and removing nodes.
# Set the number of concurrent recoveries happening on a node:
#
# 1. During the initial recovery
#
#cluster.routing.allocation.node_initial_primaries_recoveries: 4
#
# 2. During adding/removing nodes, rebalancing, etc
#
#cluster.routing.allocation.node_concurrent_recoveries: 2
# Set to throttle throughput when recovering (eg. 100mb, by default 20mb):
#
#indices.recovery.max_bytes_per_sec: 20mb
# Set to limit the number of open concurrent streams when
# recovering a shard from a peer:
#
#indices.recovery.concurrent_streams: 5
################################## Discovery ##################################
# Discovery infrastructure ensures nodes can be found within a cluster
# and master node is elected. Multicast discovery is the default.
# Set to ensure a node sees N other master eligible nodes to be considered
# operational within the cluster. This should be set to a quorum/majority of
# the master-eligible nodes in the cluster.
#
#discovery.zen.minimum_master_nodes: 1
# Set the time to wait for ping responses from other nodes when discovering.
# Set this option to a higher value on a slow or congested network
# to minimize discovery failures:
#
#discovery.zen.ping.timeout: 3s
# For more information, see
# <http://elasticsearch.org/guide/en/elasticsearch/reference/current/modules-discov-
ery-zen.html>
# Unicast discovery allows to explicitly control which nodes will be used
# to discover the cluster. It can be used when multicast is not present,
# or to restrict the cluster communication-wise.
#
# 1. Disable multicast discovery (enabled by default):
#
#discovery.zen.ping.multicast.enabled: false
#
# 2. Configure an initial list of master nodes in the cluster
# to perform discovery when new nodes (master or data) are started:
#
#discovery.zen.ping.unicast.hosts: ["host1", "host2:port"]
# EC2 discovery allows to use AWS EC2 API in order to perform discovery.
#
# You have to install the cloud-aws plugin for enabling the EC2 discovery.
#
# For more information, see
# <http://elasticsearch.org/guide/en/elasticsearch/reference/current/modules-discov-
ery-ec2.html>
#
# See <http://elasticsearch.org/tutorials/elasticsearch-on-ec2/>
# for a step-by-step tutorial.
# GCE discovery allows to use Google Compute Engine API in order to perform discov-
ery.
#
# You have to install the cloud-gce plugin for enabling the GCE discovery.
#
# For more information, see <https://github.com/elasticsearch/elasticsearch-cloud-
gce>.
# Azure discovery allows to use Azure API in order to perform discovery.
#
# You have to install the cloud-azure plugin for enabling the Azure discovery.
#
# For more information, see <https://github.com/elasticsearch/elasticsearch-cloud-
azure>.
################################## Slow Log ##################################
# Shard level query and fetch threshold logging.
#index.search.slowlog.threshold.query.warn: 10s
#index.search.slowlog.threshold.query.info: 5s
#index.search.slowlog.threshold.query.debug: 2s
#index.search.slowlog.threshold.query.trace: 500ms
#index.search.slowlog.threshold.fetch.warn: 1s
#index.search.slowlog.threshold.fetch.info: 800ms
#index.search.slowlog.threshold.fetch.debug: 500ms
#index.search.slowlog.threshold.fetch.trace: 200ms
#index.indexing.slowlog.threshold.index.warn: 10s
#index.indexing.slowlog.threshold.index.info: 5s
#index.indexing.slowlog.threshold.index.debug: 2s
#index.indexing.slowlog.threshold.index.trace: 500ms
################################## GC Logging ################################
#monitor.jvm.gc.young.warn: 1000ms
#monitor.jvm.gc.young.info: 700ms
#monitor.jvm.gc.young.debug: 400ms
#monitor.jvm.gc.old.warn: 10s
#monitor.jvm.gc.old.info: 5s
#monitor.jvm.gc.old.debug: 2s
################################## Security ################################
# Uncomment if you want to enable JSONP as a valid return transport on the
# http server. With this enabled, it may pose a security risk, so disabling
# it unless you need it is recommended (it is disabled by default).
#
#http.jsonp.enable: true
http.cors.enabled: true
http.cors.allow-origin: "http://elk-srv1.example.com"
Step 6. Restart the Elasticsearch service with the sudo service elasticsearch restart command. You can also use the sudo update-rc.d elasticsearch defaults 95 10 command to start Elasticsearch automatically upon boot.
Install Kibana
The following are the steps necessary to install Kibana in Ubuntu Server:
Step 1. Download Kibana from https://www.elastic.co/downloads/kibana.
Step 2. The Kibana configuration file is config/kibana.yml. Edit the file, as shown in the following example:
omar@elk-srv1:~$ vi ~/kibana-4*/config/kibana.yml
Step 3. Find the line that specifies host. By default, 0.0.0.0 is configured. Replace it with localhost. This way Kibana will be accessible only to the local host. In this example, Nginx will be installed, and it will reverse proxy to allow external access.
Step 4. Copy the Kibana files to a more suitable directory. The /opt directory is used in the following example:
omar@elk-srv1:~$ sudo mkdir -p /opt/kibana
omar@elk-srv1:~$ sudo cp -R ~/kibana-4*/* /opt/kibana/
Step 5. To run Kibana as a service, download a init script with the following command:
cd /etc/init.d && sudo wget
https://gist.githubusercontent.com/thisismitch/8b15ac909aed214ad04a/
raw/bce61d85643c2dc
dfbc2728c55a41dab444dca20/kibana4
Step 6. Enable and start the Kibana service with the following commands:
omar@elk-srv1:~$ sudo chmod +x /etc/init.d/kibana4
omar@elk-srv1:~$ sudo update-rc.d kibana4 defaults 96 9
omar@elk-srv1:~$ sudo service kibana4 start
Installing Nginx
In this example, Nginx is used as a reverse proxy to allow external access to Kibana. Complete the following steps to install Nginx:
Step 1. Use the sudo apt-get install nginx apache2-utils command to install Ngnix.
Step 2. You can use htpasswd to create an admin user. In this example, secadmin is the admin user:
sudo htpasswd -c /etc/nginx/htpasswd.users secadmin
Step 3. Edit the Nginx default server block (/etc/nginx/sites-available/default) and update the server_name to match your server’s name. The following is the /etc/nginx/sites-available/default file contents used in this example:
server {
listen 80;
server_name elk-srv1.example.com;
auth_basic "Restricted Access";
auth_basic_user_file /etc/nginx/htpasswd.users;
location / {
proxy_pass http://localhost:5601;
proxy_http_version 1.1;
proxy_set_header Upgrade $http_upgrade;
proxy_set_header Connection 'upgrade';
proxy_set_header Host $host;
proxy_cache_bypass $http_upgrade;
}
}
Step 4. Restart Nginx with the sudo service nginx restart command.
You should now be able to access Kibana in your browser via the fully qualified domain name (FQDN) or its IP address.
Install Logstash
Complete the following steps to install Logstash in the Ubuntu Server:
Step 1. Download Logstash from https://www.elastic.co/downloads/logstash. Alternatively, you can add the Logstash repository in Ubuntu and update the package database, as shown here:
omar@elk-srv1:~$ echo 'deb http://packages.elasticsearch.org/
logstash/1.5/debian stable
main' | sudo tee /etc/apt/sources.list.d/logstash.list
omar@elk-srv1:~$ sudo apt-get update
Step 2. Install Logstash with the sudo apt-get install logstash command, as shown here:
omar@elk-srv1:~$ sudo apt-get install logstash
Step 3. The Logstash configuration files are under /etc/logstash/conf.d. The configuration files are in JSON format. The configuration consists of three sections: inputs, filters, and outputs:
input {
udp {
port => 9996
codec => netflow {
definitions => "/opt/logstash/codecs/netflow/netflow.yaml"
versions => 9
}
}
}
output {
stdout { codec => rubydebug }
if ( [host] =~ "172.18.104.1" ) {
elasticsearch {
index => "logstash_netflow-%{+YYYY.MM.dd}"
host => "localhost"
}
} else {
elasticsearch {
index => "logstash-%{+YYYY.MM.dd}"
host => "localhost"
}
}
}
In this example, Logstash is configured to accept NetFlow records from R1 (172.18.104.1). The NetFlow data is exported to Elasticsearch with the logstash_netflow-YYYY.MM.dd index named; where YYYY.MM.dd is the date when the NetFlow data was received. The server is configured to listen on UDP port 9996.
Note
You can find additional examples and resources at https://github.com/santosomar/netflow. You can also contribute with your own examples and code there.
The following template is used for the server to be able to parse the fields from NetFlow:
curl -XPUT localhost:9200/_template/logstash_netflow9 -d '{
"template" : "logstash_netflow9-*",
"settings": {
"index.refresh_interval": "5s"
},
"mappings" : {
"_default_" : {
"_all" : {"enabled" : false},
"properties" : {
"@version": { "index": "analyzed", "type": "integer" },
"@timestamp": { "index": "analyzed", "type": "date" },
"netflow": {
"dynamic": true,
"type": "object",
"properties": {
"version": { "index": "analyzed", "type": "integer" },
"flow_seq_num": { "index": "not_analyzed", "type": "long" },
"engine_type": { "index": "not_analyzed", "type":
"integer" },
"engine_id": { "index": "not_analyzed", "type":
"integer" },
"sampling_algorithm": { "index": "not_analyzed", "type":
"integer" },
"sampling_interval": { "index": "not_analyzed", "type":
"integer" },
"flow_records": { "index": "not_analyzed", "type":
"integer" },
"ipv4_src_addr": { "index": "analyzed", "type": "ip" },
"ipv4_dst_addr": { "index": "analyzed", "type": "ip" },
"ipv4_next_hop": { "index": "analyzed", "type": "ip" },
"input_snmp": { "index": "not_analyzed", "type": "long" },
"output_snmp": { "index": "not_analyzed", "type": "long" },
"in_pkts": { "index": "analyzed", "type": "long" },
"in_bytes": { "index": "analyzed", "type": "long" },
"first_switched": { "index": "not_analyzed", "type": "date" },
"last_switched": { "index": "not_analyzed", "type": "date" },
"l4_src_port": { "index": "analyzed", "type": "long" },
"l4_dst_port": { "index": "analyzed", "type": "long" },
"tcp_flags": { "index": "analyzed", "type": "integer" },
"protocol": { "index": "analyzed", "type": "integer" },
"src_tos": { "index": "analyzed", "type": "integer" },
"src_as": { "index": "analyzed", "type": "integer" },
"dst_as": { "index": "analyzed", "type": "integer" },
"src_mask": { "index": "analyzed", "type": "integer" },
"dst_mask": { "index": "analyzed", "type": "integer" }
}
}
}
}
}
}'
The preceding template is used for Elasticsearch to be able to process all indices that start with logstash_netflow9.
Note
Refer to the Elasticsearch documentation for more information at https://www.elastic.co/guide/index.html.
Tip
Do not forget to review examples and provide your own at https://github.com/santosomar/netflow.
Summary
There are numerous commercial and open source NetFlow monitoring and analysis solutions in the market. This chapter provided an overview of these solutions. It provided details on two very popular commercial NetFlow monitoring and analysis solutions: Lancope’s StealthWatch and Plixer’s Scrutinizer. Many small and medium-sized organizations use open source alternatives for NetFlow monitoring and analysis. This chapter listed several of the most popular open source tools and provided details on several popular toolkits: NFdump, SiLK, Elasticsearch, Logstash, and Kibana. Chapter 6 and Chapter 8 provide several examples of how these commercial and open source tools are used by small, medium, and large organizations.