
Chapter 5. Big Data Analytics and NetFlow
This chapter covers the following topics:
![]() Introduction to big data analytics for cyber security
Introduction to big data analytics for cyber security
![]() NetFlow and other telemetry sources for big data analytics for cyber security
NetFlow and other telemetry sources for big data analytics for cyber security
![]() Open Security Operations Center (OpenSOC)
Open Security Operations Center (OpenSOC)
![]() Understanding big data scalability: Big data analytics in the Internet of Everything (IoE)
Understanding big data scalability: Big data analytics in the Internet of Everything (IoE)
Introduction to Big Data Analytics for Cyber Security
Big data analytics is the practice of studying large amounts of data of a variety of types and a variety of courses to learn interesting patterns, unknown facts, and other useful information. Big data analytics can play a crucial role in cyber security. Many in the industry are changing the tone of their conversation, saying that it is no longer if or when your network will be compromised, but the assumption is that your network has already been hacked or compromised, and suggest focusing on minimizing the damage and increasing visibility to aid in identification of the next hack or compromise.
Advanced analytics can be run against very large diverse data sets to find indicators of compromise (IOCs). These data sets can include different types of structured and unstructured data processed in a “streaming” fashion or in batches. NetFlow plays an important role for big data analytics for cyber security, and you will learn why as you read through in this chapter.
What Is Big Data?
There are a lot of very interesting definitions for the phenomenon called big data. It seems that a lot of people have different views of what big data is. Let’s cut through the marketing hype and get down to the basics of the subject. A formal definition for big data can be obtained in the Merriam-Webster dictionary: http://www.merriam-webster.com/dictionary/big%20data.
An accumulation of data that is too large and complex for processing by traditional database management tools.
Big data usually includes data sets with sizes beyond the ability of commonly used software tools to capture, curate, manage, and process the data within a tolerable elapsed time.
The size of data that can be classified as big data is a moving target. It can range from a few terabytes to yottabytes of data in a single data set. For instance:
![]() A petabyte is 1000 terabytes.
A petabyte is 1000 terabytes.
![]() An exabyte is 1000 petabytes.
An exabyte is 1000 petabytes.
![]() A zettabyte is 1000 exabytes.
A zettabyte is 1000 exabytes.
![]() A yoyabyte is 1000 zettabytes.
A yoyabyte is 1000 zettabytes.
Tip
Cisco has created the Cisco Visual Networking Index (VNI). Cisco VNI is an ongoing initiative to forecast and analyze the growth and use of the Internet, in addition to the data being transferred. You can find details of the Cisco VNI global IP traffic forecast and the methodology behind it at http://www.cisco.com/go/vni.
Unstructured Versus Structured Data
The term unstructured data is used when referring to data that does not have a predefined data model or is not organized in a predetermined way. Typically, unstructured data is defined as data that is not typically tracked in a “structured” or traditional row-column database. The prime examples of unstructured data are as follows:
![]() Multimedia content such as videos, photos, and audio files
Multimedia content such as videos, photos, and audio files
![]() E-mail messages
E-mail messages
![]() Social media (Facebook, Twitter, LinkedIn) status updates
Social media (Facebook, Twitter, LinkedIn) status updates
![]() Presentations
Presentations
![]() Word processing documents
Word processing documents
![]() Blog posts
Blog posts
![]() Executable files
Executable files
In the world of cyber security, a lot of the network can be also categorized as unstructured:
![]() Syslog
Syslog
![]() Simple Network Management Protocol (SNMP) logs
Simple Network Management Protocol (SNMP) logs
![]() Server and host logs
Server and host logs
![]() Packet captures
Packet captures
![]() Executables
Executables
![]() Malware
Malware
![]() Exploits
Exploits
Industry experts estimate that the majority of the data in any organization is unstructured, and the amount of unstructured data is growing significantly. There are numerous, disparate data sources. NetFlow is one of the largest single sources, and it can grow to tens of terabytes of data per day in large organizations, and it is expected to grow over the years to petabytes. The differentiation in the usefulness of any big data solution is the merging of numerous data sources and sizes that are all in the same infrastructure and providing the ability to query across all of these different data sets using the same language and tools.
There is an industry concept called Not-Only SQL (NoSQL), which is the name given to several databases that do not require SQL to process data. However, some of these databases support both SQL and non-SQL forms of data processing.
Big data analytics can be done in combination of advanced analytics disciplines such as predictive analytics and data mining.
Note
Cisco acquired Cognitive Security in 2013, a company focused on applying artificial intelligence techniques to detect advanced cyber threats. The new Cisco security solutions integrate a range of sophisticated technologies to identify and analyze key threats through advanced behavioral analysis of real-time data.
Extracting Value from Big Data
Any organization can collect data just for the matter of collecting data; however, the usefulness of such data depends on how actionable such data is to make any decisions (in addition to whether the data is regularly monitored and analyzed).
There are three high-level key items for big data analytics:
![]() Information management: An ongoing management and process control for big data analytics.
Information management: An ongoing management and process control for big data analytics.
![]() High-performance analytics: The ability to gain fast actionable information from big data and being able to solve complex problems using more data.
High-performance analytics: The ability to gain fast actionable information from big data and being able to solve complex problems using more data.
![]() Flexible deployment options: Options for on-premises or cloud-based, software-as-a-service (SaaS) tactics for big data analytics.
Flexible deployment options: Options for on-premises or cloud-based, software-as-a-service (SaaS) tactics for big data analytics.
There are a few high-level approaches for accelerating the analysis of giant data sets. The following are the most common:
![]() Grid computing: A centralized grid infrastructure for dynamic analysis with high availability and parallel processing.
Grid computing: A centralized grid infrastructure for dynamic analysis with high availability and parallel processing.
![]() Intra-database processing: Performing data management, analytics, and reporting tasks using scalable architectures.
Intra-database processing: Performing data management, analytics, and reporting tasks using scalable architectures.
![]() In-memory analytics: Quickly solves complex problems using in-memory, multiuse access to data and rapidly runs new scenarios or complex analytical computations.
In-memory analytics: Quickly solves complex problems using in-memory, multiuse access to data and rapidly runs new scenarios or complex analytical computations.
![]() Support for Hadoop: Stores and processes large volumes of data on commodity hardware. Hadoop will be covered in a few pages in the section “Hadoop.”
Support for Hadoop: Stores and processes large volumes of data on commodity hardware. Hadoop will be covered in a few pages in the section “Hadoop.”
![]() Visualizations: Quickly visualize correlations and patterns in big data to identify opportunities for further analysis and to improve decision making.
Visualizations: Quickly visualize correlations and patterns in big data to identify opportunities for further analysis and to improve decision making.
Examples of technologies used in big data analytics are covered in detail later in this chapter.
NetFlow and Other Telemetry Sources for Big Data Analytics for Cyber Security
As discussed in Chapter 1, “Introduction to NetFlow and IPFIX,” NetFlow provides detailed network telemetry that allows the administrator to:
![]() See what is actually happening across your entire network
See what is actually happening across your entire network
![]() Regain control of your network, in case of denial-of-service (DoS) attack
Regain control of your network, in case of denial-of-service (DoS) attack
![]() Quickly identify compromised endpoints and network infrastructure devices
Quickly identify compromised endpoints and network infrastructure devices
![]() Monitor network usage of employees, contractors, or partners
Monitor network usage of employees, contractors, or partners
![]() Obtain network telemetry during security incident response and forensics
Obtain network telemetry during security incident response and forensics
![]() Detect firewall misconfigurations and inappropriate access to corporate resources
Detect firewall misconfigurations and inappropriate access to corporate resources
As previously mentioned, NetFlow data can grow to tens of terabytes of data per day in large organizations, and it is expected to grow over the years to petabytes. However, many other telemetry sources can be used in conjunction with NetFlow to identify, classify, and mitigate potential threats in your network. Figure 5-1 shows examples of these telemetry sources and how they “feed” into a collection engine.

As illustrated in Figure 5-1, NetFlow data, syslog, SNMP logs, server and host logs, packet captures, and files (such as executables, malware, exploits) can be parsed, formatted, and combined with threat intelligence information and other “enrichment data” (network metadata) to perform analytics. This process is not an easy one; this is why Cisco has created an open source framework for big data analytics called Open Security Operations Center (OpenSOC). The following section provides an in-depth look at the OpenSOC framework.
OpenSOC
OpenSOC was created by Cisco to attack the “big data problem” for their Managed Threat Defense offering. Cisco has developed a fully managed service delivered by Cisco Security Solutions to help customers protect against known intrusions, zero-day attacks, and advanced persistent threats. Cisco has a global network of security operations centers (SOCs) ensuring constant awareness and on-demand analysis 24 hours a day, 7 days a week. They needed the ability to capture full packet-level data and extract protocol metadata to create a unique profile of customer’s network and monitor them against Cisco threat intelligence. As you can imagine, performing big data analytics for one organization is a challenge, Cisco has to perform big data analytics for numerous customers including very large enterprises. The goal with OpenSOC is to have a robust framework based on proven technologies to combine machine learning algorithms and predictive analytics to detect today’s security threats.
The following are some of the benefits of OpenSOC:
![]() The ability to capture raw network packets, store those packets, and perform traffic reconstruction
The ability to capture raw network packets, store those packets, and perform traffic reconstruction
![]() Collect any network telemetry, perform enrichment, and generate real-time rules-based alerts
Collect any network telemetry, perform enrichment, and generate real-time rules-based alerts
![]() Perform real-time search and cross-telemetry matching
Perform real-time search and cross-telemetry matching
![]() Automated reports
Automated reports
![]() Anomaly detection and alerting
Anomaly detection and alerting
![]() Integration with existing analytics tools
Integration with existing analytics tools
Note
OpenSOC is open sourced under the Apache license.
The primary components of OpenSOC include the following:
![]() Hadoop
Hadoop
![]() Flume
Flume
![]() Kafka
Kafka
![]() Storm
Storm
![]() Hive
Hive
![]() Elasticsearch
Elasticsearch
![]() HBase
HBase
![]() Third-party analytic tool support (R, Python-based tools, Power Pivot, Tableau, and so on)
Third-party analytic tool support (R, Python-based tools, Power Pivot, Tableau, and so on)
The sections that follow cover these components in more detail.
Hadoop
The Apache Hadoop or “Hadoop” is a project supported and maintained by the Apache Software Foundation. Hadoop is a software library designed for distributed processing of large data sets across clusters of computers. One of the advantages of Hadoop is its ability to using simple programming models to perform big data processing. Hadoop can scale from a single server instance to thousands of servers. Each Hadoop server or node performs local computation and storage. Cisco uses Hadoop clusters in OpenSOC to process large amounts of network data for their customers, as part of the Managed Threat Defense solution, and it also uses Hadoop for its internal threat intelligence ecosystem.
Hadoop includes the following modules:
![]() Hadoop Common: The underlying utilities that support the other Hadoop modules.
Hadoop Common: The underlying utilities that support the other Hadoop modules.
![]() Hadoop Distributed File System (HDFS): A highly scalable and distributed file system.
Hadoop Distributed File System (HDFS): A highly scalable and distributed file system.
![]() Hadoop YARN: A framework design for job scheduling and cluster resource management.
Hadoop YARN: A framework design for job scheduling and cluster resource management.
![]() Hadoop MapReduce (MapR): A system designed for parallel processing of large data sets based on YARN.
Hadoop MapReduce (MapR): A system designed for parallel processing of large data sets based on YARN.
Figure 5-2 illustrates a Hadoop cluster.
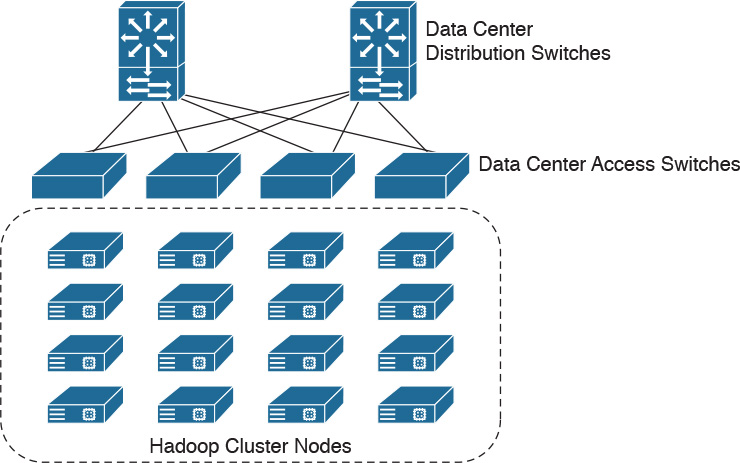
In Figure 5-2, a total of 16 servers are configured in a Hadoop cluster and connected to the data center access switches for big data processing.
HDFS
HDFS is a highly scalable and distributed file system that can scale to thousands of cluster nodes, millions of files, and petabytes of data. HDFS is optimized for batch processing where data locations are exposed to allow computations to take place where the data resides. HDFS provides a single namespace for the entire cluster to allow for data coherency in a write-once, read-many access model. In other words, clients can only append to existing files in the node. In HDFS, files are separated into blocks, which are typically 64 MB in size and are replicated in multiple data nodes. Clients access data directly from data nodes. Figure 5-3 shows a high-level overview of the HDFS architecture.

In Figure 5-3, the NameNode (or Namespace Node) maps a filename to a set of blocks and the blocks to the data nodes where the block resides. There are a total of four data nodes, each with a set of data blocks. The NameNode performs cluster configuration management and controls the replication engine for blocks throughout the cluster. The NameNode metadata includes the following:
![]() The list of files
The list of files
![]() List of blocks for each file
List of blocks for each file
![]() List of data nodes for each block
List of data nodes for each block
![]() File attributes such as creation time and replication factor
File attributes such as creation time and replication factor
The NameNode also maintains a transaction log that records file creations, deletions, and modifications.
Each DataNode includes a block server that stores data in the local file system, stores metadata of a block, and provisions data and metadata to the clients. DataNodes also periodically send a report of all existing blocks to the NameNode and forward data to other specified DataNodes as needed. DataNodes send a heartbeat message to the NameNode on a periodic basis (every 3 seconds by default), and the NameNode uses these heartbeats to detect any DataNode failures. Clients can read or write data to each data block, as shown in Figure 5-3.
Flume
OpenSOC uses Flume for collecting, aggregating, and moving large amounts of network telemetry data (like NetFlow, syslog, SNMP, and so on) from many different sources to a centralized data store. Flume is also licensed under the Apache license. Figure 5-4 shows how different network telemetry sources are sent to Flume agents for processing.

Flume has the following components and concepts:
![]() Event: A specific unit of data that is transferred by Flume, such as a single NetFlow record.
Event: A specific unit of data that is transferred by Flume, such as a single NetFlow record.
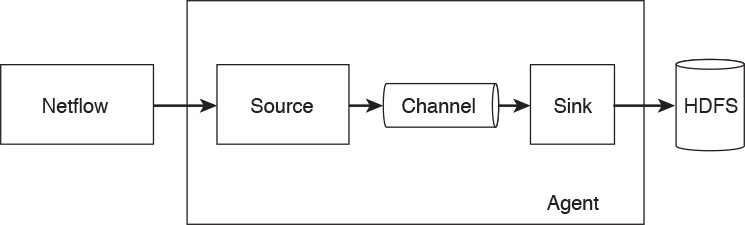
![]() Source: The source of the data. These sources are either actively queried for new data or they can passively wait for data to be delivered to them. The source of this data can be NetFlow collectors, server logs from Splunk, or similar entities.
Source: The source of the data. These sources are either actively queried for new data or they can passively wait for data to be delivered to them. The source of this data can be NetFlow collectors, server logs from Splunk, or similar entities.
![]() Sink: Delivers the data to a specific destination.
Sink: Delivers the data to a specific destination.
![]() Channel: The conduit between the source and the sink.
Channel: The conduit between the source and the sink.
![]() Agent: A Java virtual machine running Flume that comprises a group of sources, sinks, and channels.
Agent: A Java virtual machine running Flume that comprises a group of sources, sinks, and channels.
![]() Client: Creates and transmits the event to the source operating within the agent.
Client: Creates and transmits the event to the source operating within the agent.
Figure 5-5 illustrates Flume’s high-level architecture and its components.
Kafka
OpenSOC uses Kafka as its messaging system. Kafka is a distributed messaging system that is partitioned and replicated. Kafka uses the concept of topics. Topics are feeds of messages in specific categories. For example, Kafka can take raw packet captures and telemetry information from Flume (after processing NetFlow, syslog, SNMP, or any other telemetry data), as shown in Figure 5-6.
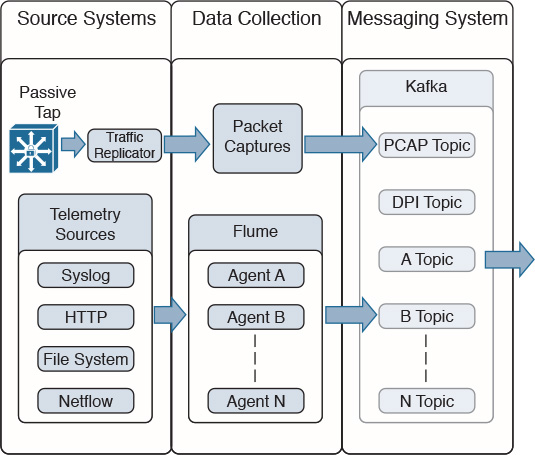
In Figure 5-6, a topic is a category or feed name to which log messages and telemetry information are exchanged (published). Each topic is an ordered, immutable sequence of messages that is continually appended to a commit log.
Kafka provides a single “consumer” abstraction layer, as illustrated in Figure 5-7.
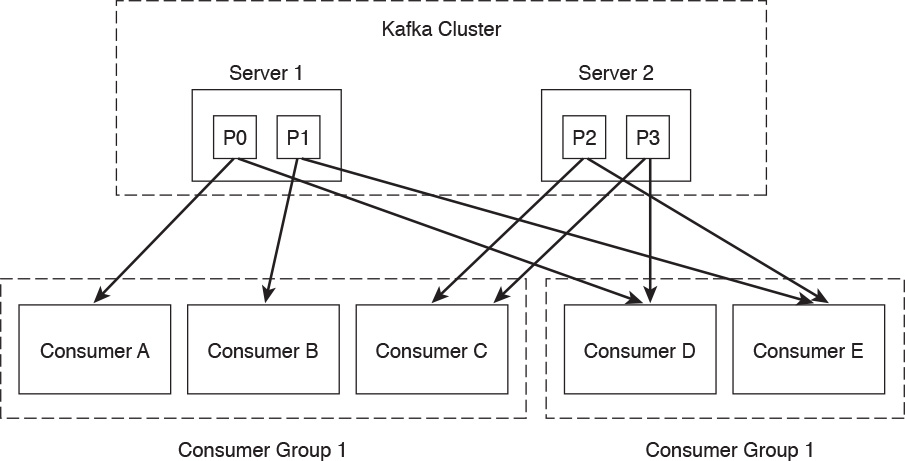
Consumers are organized in consumer groups, and each message published to a topic is sent to one consumer instance within each subscribing consumer group.
Note
Consumers can be in separate processes or on separate machines.
All consumer instances that belong to the same consumer group are processed in a traditional queue load balancing. Consumers in different groups process messages in a publish-subscribe mode, where all the messages are broadcast to all consumers.
In Figure 5-7, the Kafka cluster contains two servers (Server 1 and Server 2), each with two different partitions. Server 1 contains partition 0 (P0) and partition 1 (P1). Server 2 contains partition 2 (P2) and partition 3 (P3). Two consumer groups are illustrated. Consumer Group 1 contains consumers A, B, and C. Consumer Group 2 contains consumers: D and E.
Kafka provides parallelism to provide ordering guarantees and load balancing over a pool of consumer processes. However, there cannot be more consumer instances than partitions.
Storm
Storm is an open source, distributed, real-time computation system under the Apache license. It provides real-time processing and can be used with any programming language.
Hadoop consists of two major components: HDFS and MapReduce. The early implementations of Hadoop and MapReduce were designed on batch analytics, which does not provide any real-time processing. In SOCs, you often cannot process data in batches, and so it can take several hours to complete the analysis.
Note
Depending on the amount of data, the number of nodes in the cluster, the technical specifications of each node, and the complexity of the analytics, MapReduce can take anywhere from minutes to hours to perform a job. In security, you need to respond fast!
OpenSOC uses Storm because it provides real-time streaming and because of its amazing ability to process big data, at scale, in real time. Storm can process data at over a million tuples processed per second per node. Figure 5-8 shows how Kafka topics feed information to Storm to provide real-time processing.

Note
You can obtain more detailed information and download Storm at https://storm.incubator.apache.org.
Hive
Hive is a data warehouse infrastructure that provides data summarization and ad hoc querying. Hive is also a project under the Apache license. OpenSOC uses Hive because of its querying capabilities. Hive provides a mechanism to query data using a SQL-like language that is called HiveQL. In the case of batch processing, Hive allows MapR programmers use their own custom mappers.
Figure 5-9 shows how Storm feeds into Hive to provide data summarization and querying.

Storm can also feed into HBase and Elasticsearch. These are covered in the following sections.
Elasticsearch
Elasticsearch is a scalable and real-time search and analytics engine that is also used by OpenSOC. Elasticsearch has a very strong set of application programming interfaces (APIs) and query domain-specific languages (DSLs). It provides full query DSL based on JSON to define such queries. Figure 5-10 shows how Storm feeds into Elasticsearch to provide real-time indexing and querying.

Note
You can obtain more detailed information and download Elasticsearch at http://www.elasticsearch.org.
HBase
HBase is scalable and distributed database that supports structured data storage for large tables. You guessed right: HBase is also under the Apache license! OpenSOC uses HBase because it provides random and real-time read/write access large data sets.
Note
HBase is a nonrelational database modeled after Google’s Bigtable.
HBase provides linear and modular scalability with consistent database reads and writes.
It also provides automatic and configurable high-availability (failover) support between Region Servers. HBase is a type of “NoSQL” database that can be scaled by adding Region Servers that are hosted on separate servers.
Figure 5-11 shows how Storm feeds into HBase to provide real-time indexing and querying.
![]() R-based and Python-based tools
R-based and Python-based tools
![]() Power Pivot
Power Pivot
![]() Tableau
Tableau
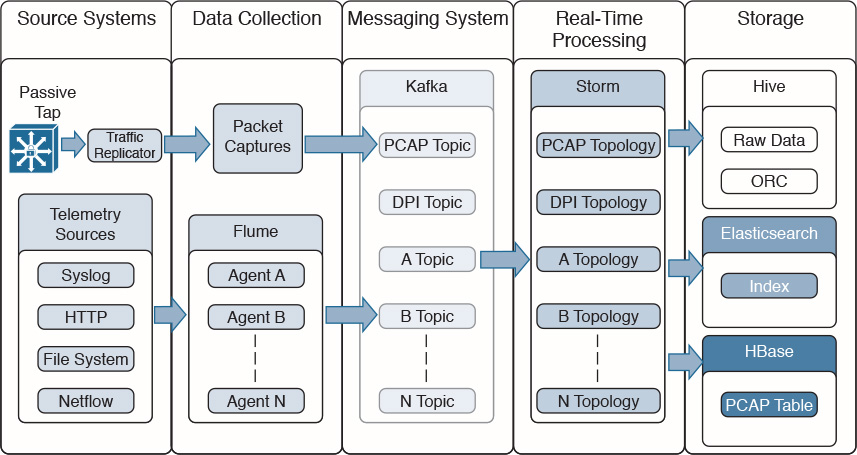
Figure 5-12 shows the complete OpenSOC architecture, including analytics tools and web services for additional search, visualizations, and packet capture (PCAP) reconstruction.

Other Big Data Projects in the Industry
There are other Hadoop-related projects used in the industry for processing and visualizing big data. The following are a few examples:
![]() Ambari: A web-based tool and dashboard for provisioning, managing, and monitoring Apache Hadoop clusters.
Ambari: A web-based tool and dashboard for provisioning, managing, and monitoring Apache Hadoop clusters.
![]() Avro: A data serialization system.
Avro: A data serialization system.
![]() Cassandra: A scalable multimaster database with no single points of failure.
Cassandra: A scalable multimaster database with no single points of failure.
![]() Chukwa: A data collection system for managing large distributed systems.
Chukwa: A data collection system for managing large distributed systems.
![]() Mahout: A scalable machine learning and data mining library.
Mahout: A scalable machine learning and data mining library.
![]() Pig: A high-level data-flow language and execution framework for parallel computation.
Pig: A high-level data-flow language and execution framework for parallel computation.
![]() Spark: A fast and general compute engine for Hadoop data.
Spark: A fast and general compute engine for Hadoop data.
![]() Tez: A generalized data-flow programming framework, built on Hadoop YARN.
Tez: A generalized data-flow programming framework, built on Hadoop YARN.
![]() ZooKeeper: A high-performance coordination service for distributed applications.
ZooKeeper: A high-performance coordination service for distributed applications.
![]() Berkeley Data Analytics Stack (BDAS): A framework created by Berkeley’s AMPLabs. BDAS has a three-dimensional approach: algorithms, machines, and people. The following are the primary components of BDAS:
Berkeley Data Analytics Stack (BDAS): A framework created by Berkeley’s AMPLabs. BDAS has a three-dimensional approach: algorithms, machines, and people. The following are the primary components of BDAS:
![]() Akaros: An operating system for many-core architectures and large-scale SMP systems
Akaros: An operating system for many-core architectures and large-scale SMP systems
![]() GraphX: A large-scale graph analytics
GraphX: A large-scale graph analytics
![]() Mesos: Dynamic resource sharing for clusters
Mesos: Dynamic resource sharing for clusters
![]() MLbase: Distributed machine learning made easy
MLbase: Distributed machine learning made easy
![]() PIQL: Scale independent query processing
PIQL: Scale independent query processing
![]() Shark: Scalable rich analytics SQL engine for Hadoop
Shark: Scalable rich analytics SQL engine for Hadoop
![]() Spark: Cluster computing framework
Spark: Cluster computing framework
![]() Sparrow: Low-latency scheduling for interactive cluster services
Sparrow: Low-latency scheduling for interactive cluster services
![]() Tachyon: Reliable file sharing at memory speed across cluster frameworks
Tachyon: Reliable file sharing at memory speed across cluster frameworks
You can find detailed information about BDAS and Berkeley’s AMPLabs at https://amplab.cs.berkeley.edu
Understanding Big Data Scalability: Big Data Analytics in the Internet of Everything
Evidently, the challenges of big data analytics include the following:
![]() Data capture capabilities
Data capture capabilities
![]() Data management (curation)
Data management (curation)
![]() Storage
Storage
![]() Adequate and real-time search
Adequate and real-time search
![]() Sharing and transferring of information
Sharing and transferring of information
![]() Deep-dive and automated analysis
Deep-dive and automated analysis
![]() Adequate visualizations
Adequate visualizations
Big data has become a hot topic due to the overabundance of data sources inundating today’s data stores as applications proliferate. These challenges will become even bigger as the world moves to the Internet of Everything (IoE), a term coined by Cisco. IoE is based on the foundation of the Internet of Things (IoT) by adding network intelligence that allows convergence, orchestration, and visibility across previously disparate systems. IoT is the networked connection of physical objects. IoT is one of many technology transitions that enable the IoE.
The goal is to make networked connections more relevant by turning information into actions that create new capabilities. The IoE consists of many technology transitions, including the IoT. The key concepts are as follows:
![]() Machine-to-machine connections: Including things such as IoT sensors, remote monitoring, industrial control systems, and so on
Machine-to-machine connections: Including things such as IoT sensors, remote monitoring, industrial control systems, and so on
![]() People-to-people connections: Including collaboration technologies such as TelePresence, WebEx, and so on
People-to-people connections: Including collaboration technologies such as TelePresence, WebEx, and so on
![]() Machine-to-people connections: Including traditional and new applications
Machine-to-people connections: Including traditional and new applications
Big data analytics for cyber security in an IoE world will require substantial engineering to address the huge data sets. Scalability will be a huge challenge. In addition, the endless variety of IoT applications presents a security operational challenge. We are starting to experience these challenges nowadays. For instance, in a factory floor, embedded programmable logic controllers (PLCs) that operate manufacturing systems and robots can be a huge target for bad actors. Do we know all the potential true indicators of compromise so that we can perform deep-dive analysis and perform good incident response?
The need to combine threat intelligence and big data analytics will be paramount in this ever-changing world.
Summary
Today, networks are becoming exponentially bigger and more complex. To maintain visibility and control of the network, many organizations are leveraging or planning to combine big data analytics with real-time, predictive analysis to detect attacks and protect against advanced malware across their networks. This combination can help security professionals address the ever-changing nature of threats that threaten their most important asset, which is data. This chapter provided an overview of the technologies and processes to use big data analytics for cyber security. NetFlow and other telemetry sources play a big role in big data analytics for cyber security. This chapter explained how you can use these telemetry sources to look for indicators of compromise in your network.
Cisco has developed and open source OpenSOC to provide a framework for big data analytics for cyber security. In this chapter, you learned the technologies and architectures used in OpenSOC and how they play a crucial role for security operations. The IoE introduces a lot of security challenges. One of the biggest challenges introduced is the ability to scale to large data sets. It is unavoidable that big data will continue to play a big role in cyber security.