
Chapter 7. Troubleshooting NetFlow
This chapter covers the following topics:
![]() Troubleshooting NetFlow in Cisco IOS Software
Troubleshooting NetFlow in Cisco IOS Software
![]() Troubleshooting NetFlow in Cisco IOS-XE Software
Troubleshooting NetFlow in Cisco IOS-XE Software
![]() Troubleshooting NetFlow in Cisco NX-OS Software
Troubleshooting NetFlow in Cisco NX-OS Software
![]() Troubleshooting NetFlow in Cisco IOS-XR Software
Troubleshooting NetFlow in Cisco IOS-XR Software
![]() Troubleshooting NetFlow in the Cisco ASA
Troubleshooting NetFlow in the Cisco ASA
![]() Troubleshooting NetFlow in the Cisco NetFlow Generation Appliance
Troubleshooting NetFlow in the Cisco NetFlow Generation Appliance
Troubleshooting Utilities and Debug Commands
This chapter focuses on the different techniques and best practices available when troubleshooting NetFlow deployments and configurations. It assumes that you already understand the topics covered in previous chapters, such as configuration and deployment of NetFlow in all the supported devices.
Before you start learning in-depth troubleshooting techniques and detailed information about debug commands, it is recommended that you understand the impact of debug commands in production environments. Use debug commands with caution at all times. The impact of using some of the debug commands will depend on your environment and the CPU and memory utilization of your network infrastructure device. In some cases, it is recommended that these commands be used only under the direction of your router technical support representative when troubleshooting specific problems.
Enabling debugging can disrupt operation of an infrastructure device when networks are experiencing high load conditions.
Before debugging, look at your CPU load with the show processes cpu command in Cisco IOS, IOS-XE, and IOS-XR devices and with the show cpu command in Cisco Adaptive Security Appliance (ASA) devices.
Tip
The whitepaper titled “Troubleshooting High CPU Utilization on Cisco Routers” is a great resource to learn more information about how to analyze CPU utilization in Cisco IOS devices. You can find the whitepaper at http://www.cisco.com/c/en/us/support/docs/routers/10000-series-routers/15095-highcpu.html.
The document in the following link provides information on how to monitor and troubleshoot the performance of a Cisco ASA security appliance: http://www.cisco.com/c/en/us/support/docs/security/asa-5500-x-series-next-generation-firewalls/113185-asaperformance.html.
Cisco routers, switches, and the Cisco ASA can display debug outputs to various interfaces, including the console, aux, and vty ports. These devices can also log messages to an internal buffer to an external syslog server.
When you are connected to the console, no extra configuration is needed in order to see the debug command output; however, make sure that the logging console level is set to an appropriate level and that logging has not been disabled with the no logging console command. Excessive debugs to the console port of a router can cause it to hang or become extremely slow. This is because the router, switch, or Cisco ASA routinely prioritizes console output before other device functions.
If you are connected via Telnet or Secure Shell (SSH), you must use the terminal monitor command to see the debug output.
Note
SSH is the recommended and most secure connection option of the two.
You can also log messages to an internal buffer. If you enable the logging to an internal buffer, the log messages are copied to an internal buffer instead of to the device displaying them to the console. The buffer is a circular buffer. In other words, newer messages overwrite older messages.
To log messages to an internal buffer, use the logging buffered command in Cisco IOS, Cisco IOS-XE, Cisco IOS-XR, and Cisco ASA devices. Example 7-1 shows the different options of the logging buffered command in a Cisco IOS router.
Example 7-1 The logging buffered Command in Cisco IOS Devices
R1(config)# logging buffered ?
<0-7> Logging severity level
<4096-2147483647> Logging buffer size
alerts Immediate action needed (severity=1)
critical Critical conditions (severity=2)
debugging Debugging messages (severity=7)
discriminator Establish MD-Buffer association
emergencies System is unusable (severity=0)
errors Error conditions (severity=3)
filtered Enable filtered logging
informational Informational messages (severity=6)
notifications Normal but significant conditions (severity=5)
warnings Warning conditions (severity=4)
xml Enable logging in XML to XML logging buffer
Example 7-2 shows the different options of the logging buffered command in a Cisco ASA.
Example 7-2 The logging buffered Command in the Cisco ASA
asa(config)# logging buffered ?
configure mode commands/options:
<0-7> Enter syslog level (0 - 7)
WORD Specify the name of logging list
alerts Immediate action needed (severity=1)
critical Critical conditions (severity=2)
debugging Debugging messages (severity=7)
emergencies System is unusable (severity=0)
errors Error conditions (severity=3)
informational Informational messages (severity=6)
notifications Normal but significant conditions (severity=5)
warnings Warning conditions (severity=4)
To display the messages that are logged in the buffer, use the privileged EXEC command show logging. Example 7-3 demonstrates how to enable logging buffered at severity 6 (informational), and then an example of the output of the show logging command in the Cisco ASA.
Example 7-3 Example of logging buffered and show logging Commands in the Cisco ASA
asa(config)# logging buffered informational
asa(config)# show logging
Syslog logging: enabled
Facility: 20
Timestamp logging: disabled
Standby logging: disabled
Debug-trace logging: disabled
Console logging: disabled
Monitor logging: disabled
Buffer logging: level informational, 11 messages logged
Trap logging: disabled
Permit-hostdown logging: disabled
History logging: disabled
Device ID: disabled
Mail logging: disabled
ASDM logging: level informational, 15635932 messages logged
%ASA-5-111008: User 'enable_15' executed the 'logging buffered informational' command.
%ASA-5-111010: User 'enable_15', running 'CLI' from IP 192.168.1.89, executed
'logging buffered informational'
%ASA-6-305011: Built dynamic UDP translation from inside:192.168.1.101/19141 to
outside:172.18.89.12/19141
%ASA-6-305011: Built dynamic UDP translation from inside:192.168.1.101/50613 to
outside:172.18.89.12/50613
%ASA-6-305011: Built dynamic TCP translation from inside:192.168.1.101/42701 to
outside:172.99.89.12/42701
%ASA-6-305012: Teardown dynamic TCP translation from inside:192.168.1.101/55345 to
outside:172.18.89.12/55345 duration 0:00:31
Note
For more information about the Cisco ASA logs and syslog messages, go to cisco.com/go/asa or refer to the third edition of the Cisco Press book Cisco ASA: All-in-One Next-Generation Firewall, IPS, and VPN Services.
Example 7-4 shows an example of the output of the show logging command in a Cisco IOS router. The command is the same in Cisco IOS and Cisco IOS-XE.
Example 7-4 Example of show logging Command in Cisco IOS and Cisco IOS-XE
R1# show logging
Syslog logging: enabled (0 messages dropped, 3 messages rate-limited, 0 flushes, 0
overruns, xml disabled, filtering disabled)
No Active Message Discriminator.
No Inactive Message Discriminator.
Console logging: level debugging, 24 messages logged, xml disabled,
filtering disabled
Monitor logging: level debugging, 0 messages logged, xml disabled,
filtering disabled
Buffer logging: level debugging, 24 messages logged, xml disabled,
filtering disabled
Exception Logging: size (8192 bytes)
Count and timestamp logging messages: disabled
Persistent logging: disabled
No active filter modules.
Trap logging: level informational, 28 message lines logged
Logging Source-Interface: VRF Name:
Log Buffer (8192 bytes):
*Dec 20 03:16:37.013: %SYS-5-CONFIG_I: Configured from console by console
You can specify the size of the buffer and the severity level of the messages to be
logged.
In the Cisco ASA, you can specify the size of the logging buffer by using the logging buffer-size command, as demonstrated in Example 7-5.
Example 7-5 Example of logging buffer-size Command in the Cisco ASA
asa(config)# logging buffer-size ?
configure mode commands/options:
<4096-52428800> Specify logging buffer size in bytes
In Cisco IOS and Cisco IOS-XE, you can specify the size of the logging buffer using the logging buffered command, as previously shown in Example 7-1.
To clear the log in Cisco IOS and Cisco IOS-XE, you can use the clear log command. In the Cisco ASA, you can use the clear logging buffer command to clear the internal logging buffer, the clear logging asdm command to clear the ASDM logging buffer, and the clear logging queue to clear all the logging-related queues. These options are shown in Example 7-6.
Example 7-6 Cisco ASA clear logging Command Options
asa(config)# clear logging ?
exec mode commands/options:
asdm Clear ASDM logging buffer
buffer Clear internal logging buffer
queue Clear logging related queues
Another best practice is to enable millisecond (msec) time stamps in your infrastructure device. In Cisco IOS, you can enable time stamps with the service timestamps command, as shown in Example 7-7.
Example 7-7 The service timestamps Command
R1(config)# service timestamps debug datetime msec
R1(config)# service timestamps log datetime msec
In Example 7-7, the service timestamps debug datetime msec command is used to enable time stamps for debug messages, and the service timestamps log datetime msec command is used to enable time stamps for any other log messages.
These commands add time stamps in the format MMM DD HH:MM:SS, indicating the date and time according to the system clock. When the device clock has not been set, the date and time are preceded by an asterisk to indicate that the date and time are probably inaccurate.
With Cisco ASA devices, time stamps are enabled with the logging timestamp command.
Tip
It is highly recommended that you use a Network Time Protocol (NTP) server to synchronize the clock in all your network infrastructure devices.
Troubleshooting NetFlow in Cisco IOS and Cisco IOS XE Devices
In this section, you will learn several useful commands, tools, and methodologies that are useful when troubleshooting NetFlow configurations in IOS Software. Figure 7-1 shows the network topology of branch office of the fictitious company called SecureMe, Inc. located in Research Triangle Park (RTP), North Carolina. This topology is used as an example for the following scenarios.

The RTP office hosts a call center where more than 200 employees access several internal applications. The security and network administrators want to enable Flexible NetFlow in the router labeled RTP-R1 to monitor the traffic between the hosts in the call center and the application servers. The hosts in the call center are in the 10.1.10.0/24 network, and the application servers are in the 10.2.20.0/24 network, as shown in Figure 7-1. The router RTP-R1 also has a connection to a management network where the security administrator has a server running Elasticsearch, Logstash, and Kibana (otherwise known as ELK). This server is configured with the IP address 172.18.104.179.
Cisco IOS Router Flexible NetFlow Configuration
The goal is for RTP-R1 to monitor all IPv4 traffic coming from the hosts in the call center. Example 7-8 shows the relevant Flexible NetFlow and interface configuration of RTP-R1.
Example 7-8 RTP-R1 Flexible NetFlow Configuration
flow exporter EXPORTER-1
description exports to ELK
destination 172.18.104.179
transport udp 9995
!
!
flow record RTP-FLOW-RECORD-1
description basic traffic analysis in RTP
match ipv4 protocol
match ipv4 source address
match ipv4 destination address
collect counter bytes
collect counter packets
collect timestamp sys-uptime first
collect timestamp sys-uptime last
!
!
flow monitor RTP-FLOW-MONITOR-1
exporter EXPORTER-1
record RTP-FLOW-RECORD-1
!
!
interface GigabitEthernet0/0
ip address 10.1.1.1 255.255.255.0
ip flow monitor RTP-FLOW-MONITOR-1 input
duplex auto
speed auto
media-type rj45
!
interface GigabitEthernet0/1
ip address 10.2.1.1 255.255.255.0
duplex auto
speed auto
media-type rj45
!
interface GigabitEthernet0/2
ip address 10.1.48.1 255.255.255.0
duplex auto
speed auto
media-type rj45
!
In Example 7-8, a flow exporter is configured with the name EXPORTER-1. The destination host is the ELK server with the IP address 172.18.104.179 and configured to send Flexible NetFlow information using UDP port 9995. You can also use the show running-config flow exporter command to view all flow exporter configurations, as shown in Example 7-9.
Example 7-9 show running-config flow exporter Command Output
RTP-R1# show running-config flow exporter
Current configuration:
!
flow exporter EXPORTER-1
description exports to ELK
destination 172.18.104.179
transport udp 9995
!
A flow record is configured called RTP-FLOW-RECORD-1. You can also use the show running-config flow record to see all flow records that have been configured in the Cisco IOS device, as shown in Example 7-10.
Example 7-10 show running-config flow record Command Output
RTP-R1# show running-config flow record
Current configuration:
!
flow record RTP-FLOW-RECORD-1
description basic traffic analysis in RTP
match ipv4 protocol
match ipv4 source address
match ipv4 destination address
collect counter bytes
collect counter packets
collect timestamp sys-uptime first
collect timestamp sys-uptime last
!
This flow record is configured to match IPv4 traffic based on the following:
![]() Protocol
Protocol
![]() Source address
Source address
![]() Destination address
Destination address
The RTP-FLOW-RECORD-1 flow record is also configured to collect the following information:
![]() The total number of bytes transferred in a specific flow
The total number of bytes transferred in a specific flow
![]() The total number of packets in such flow
The total number of packets in such flow
![]() The time when the first packet was seen
The time when the first packet was seen
![]() The time when the most recent packet was seen
The time when the most recent packet was seen
You can use the show flow record name command to see the details of the configured flow record. Example 7-11 includes the output of the show flow record RTP-FLOW-RECORD-1 command displaying the details of the RTP-FLOW-RECORD-1 flow record.
Example 7-11 show flow record RTP-FLOW-RECORD-1 Command Output
RTP-R1# show flow record RTP-FLOW-RECORD-1
flow record RTP-FLOW-RECORD-1:
Description: basic traffic analysis in RTP
No. of users: 1
Total field space: 25 bytes
Fields:
match ipv4 protocol
match ipv4 source address
match ipv4 destination address
collect counter bytes
collect counter packets
collect timestamp sys-uptime first
collect timestamp sys-uptime last
As you learned in previous chapters, a flow record must have at least one match criterion for use as the key field, and usually it has at least one collect criterion for use as a non-key field. There are hundreds of possible combinations for the options you can configure in flow records.
You can display several record options by using the show flow record command. Example 7-12 shows the output of the show flow record command for your reference. The show flow record command can show traditional NetFlow collection schemes, IPv4 input NetFlow with origin autonomous systems (AS), and many other fields. The output of this command gives you a good reference of the fields that can be used to customize a Flexible NetFlow record.
Example 7-12 show flow record Command Output
RTP-R1# show flow record
flow record netflow-original:
Description: Traditional IPv4 input NetFlow with origin ASs
! The BGP—Origin AS Validation feature helps prevent network administrators from
inadvertently
! advertising routes to networks they do not control.
! This feature uses a Resource Public Key Infrastructure (RPKI) server to authenticate
that
! certain BGP prefixes originated from an expected autonomous system before the
prefixes
! are allowed to be advertised.
No. of users: 0
Total field space: 53 bytes
Fields:
match ipv4 tos
match ipv4 protocol
match ipv4 source address
match ipv4 destination address
match transport source-port
match transport destination-port
match interface input
match flow sampler
collect routing source as
collect routing destination as
collect routing next-hop address ipv4
collect ipv4 source mask
collect ipv4 destination mask
collect transport tcp flags
collect interface output
collect counter bytes
collect counter packets
collect timestamp sys-uptime first
collect timestamp sys-uptime last
flow record netflow ipv4 original-input:
Description: Traditional IPv4 input NetFlow with ASs
!This includes the router's own AS.
No. of users: 0
Total field space: 53 bytes
Fields:
match ipv4 tos
match ipv4 protocol
match ipv4 source address
match ipv4 destination address
match transport source-port
match transport destination-port
match interface input
match flow sampler
collect routing source as
collect routing destination as
collect routing next-hop address ipv4
collect ipv4 source mask
collect ipv4 destination mask
collect transport tcp flags
collect interface output
collect counter bytes
collect counter packets
collect timestamp sys-uptime first
collect timestamp sys-uptime last
flow record netflow ipv4 original-input peer:
Description: Traditional IPv4 input NetFlow with peer ASs
! This includes the peer AS.
No. of users: 0
Total field space: 53 bytes
Fields:
match ipv4 tos
match ipv4 protocol
match ipv4 source address
match ipv4 destination address
match transport source-port
match transport destination-port
match interface input
match flow sampler
collect routing source as peer
collect routing destination as peer
collect routing next-hop address ipv4
collect ipv4 source mask
collect ipv4 destination mask
collect transport tcp flags
collect interface output
collect counter bytes
collect counter packets
collect timestamp sys-uptime first
collect timestamp sys-uptime last
<output omitted for brevity>
The following are the highlights of the other NetFlow record options categories that are not displayed in Example 7-12:
![]() Traditional IPv4 output NetFlow with ASs
Traditional IPv4 output NetFlow with ASs
![]() Traditional IPv4 output NetFlow with peer ASs
Traditional IPv4 output NetFlow with peer ASs
![]() AS aggregation schemes
AS aggregation schemes
![]() AS aggregation scheme with peer ASs
AS aggregation scheme with peer ASs
![]() AS and TOS aggregation schemes
AS and TOS aggregation schemes
![]() AS and TOS aggregation scheme with peer ASs
AS and TOS aggregation scheme with peer ASs
![]() BGP next-hop and TOS aggregation schemes
BGP next-hop and TOS aggregation schemes
![]() BGP next-hop and TOS aggregation scheme with peer ASs
BGP next-hop and TOS aggregation scheme with peer ASs
![]() Destination prefix aggregation schemes
Destination prefix aggregation schemes
![]() Destination prefix aggregation scheme with peer AS
Destination prefix aggregation scheme with peer AS
![]() Destination prefix and TOS aggregation schemes
Destination prefix and TOS aggregation schemes
![]() Destination prefix and TOS aggregation scheme with peer AS
Destination prefix and TOS aggregation scheme with peer AS
![]() Source and destination prefixes aggregation schemes
Source and destination prefixes aggregation schemes
![]() Source and destination prefixes aggregation scheme with peer ASs
Source and destination prefixes aggregation scheme with peer ASs
![]() Prefixes and ports aggregation scheme
Prefixes and ports aggregation scheme
![]() Prefixes and TOS aggregation schemes
Prefixes and TOS aggregation schemes
![]() Prefixes and TOS aggregation scheme with peer ASs
Prefixes and TOS aggregation scheme with peer ASs
![]() Protocol and ports aggregation scheme
Protocol and ports aggregation scheme
![]() Protocol, ports, and TOS aggregation scheme
Protocol, ports, and TOS aggregation scheme
![]() Source AS and prefix aggregation schemes
Source AS and prefix aggregation schemes
![]() Source AS and prefix aggregation scheme with peer AS
Source AS and prefix aggregation scheme with peer AS
![]() Source prefix and TOS aggregation schemes
Source prefix and TOS aggregation schemes
![]() Source prefix and TOS aggregation scheme with peer AS
Source prefix and TOS aggregation scheme with peer AS
![]() Traditional IPv6 input NetFlow with ASs
Traditional IPv6 input NetFlow with ASs
![]() Traditional IPv6 input NetFlow with peer ASs
Traditional IPv6 input NetFlow with peer ASs
![]() Traditional IPv6 output NetFlow with ASs
Traditional IPv6 output NetFlow with ASs
![]() Traditional IPv6 output NetFlow with peer ASs
Traditional IPv6 output NetFlow with peer ASs
![]() AS aggregation schemes
AS aggregation schemes
![]() AS aggregation scheme with peer ASs
AS aggregation scheme with peer ASs
![]() BGP next-hop aggregation schemes
BGP next-hop aggregation schemes
![]() BGP next-hop aggregation scheme with peer ASs
BGP next-hop aggregation scheme with peer ASs
![]() Destination prefix aggregation schemes
Destination prefix aggregation schemes
![]() Destination prefix aggregation scheme with peer AS
Destination prefix aggregation scheme with peer AS
![]() Source and destination prefixes aggregation schemes
Source and destination prefixes aggregation schemes
![]() Source and destination prefixes aggregation scheme with peer ASs
Source and destination prefixes aggregation scheme with peer ASs
![]() Protocol and ports aggregation scheme
Protocol and ports aggregation scheme
![]() Source AS and prefix aggregation schemes
Source AS and prefix aggregation schemes
![]() Source AS and prefix aggregation scheme with peer AS
Source AS and prefix aggregation scheme with peer AS
![]() Basic traffic analysis in RTP
Basic traffic analysis in RTP
Troubleshooting Communication Problems with the NetFlow Collector
In this scenario, the network security administrator noticed that he was not getting any NetFlow data in his NetFlow collector (the ELK server previously illustrated in Figure 7-1). First, the show flow exporter command is used to make sure that the correct destination IP address was configured, as demonstrated in Example 7-13.
Example 7-13 show flow exporter Command Output
RTP-R1# show flow exporter
Flow Exporter EXPORTER-1:
Description: exports to ELK
Export protocol: NetFlow Version 9
Transport Configuration:
Destination IP address: 172.18.104.179
Source IP address: 10.1.48.1
Transport Protocol: UDP
Destination Port: 9995
Source Port: 64715
DSCP: 0x0
TTL: 255
Output Features: Not Used
The IP address of the ELK server is correctly configured (172.18.104.179). In addition, the administrator checks that the correct transport protocol (UDP) and destination port (9995 in this example) are configured. The show flow exporter statistics is also used. The router displays that 1733 packets have been sent to the exporter, accounting for 145590 bytes of data. Example 7-14 includes the output of the show flow exporter statistics command.
Example 7-14 show flow exporter statistics Command Output
RTP-R1# show flow exporter statistics
Flow Exporter EXPORTER-1:
Packet send statistics (last cleared 1w4d ago):
Successfully sent: 1733 (145590 bytes)
Client send statistics:
Client: Flow Monitor RTP-FLOW-MONITOR-1
Records added: 21
- sent: 21
Bytes added: 525
- sent: 525
The administrator also uses the debug flow exporter command to troubleshoot the communication to the NetFlow collector (ELK server). Example 7-15 demonstrates the debug flow exporter.
Example 7-15 The debug flow exporter Command
RTP-R1# debug flow exporter
*Jan 5 00:21:02.907: FLOW EXP: Export packet sent successfully via fast switch
After the debug flow exporter command is enabled in Example 7-15, a debug message is shown indicating that a flow exporter packet has been sent to the NetFlow collector. There are several additional options for the debug flow exporter command, as shown in Example 7-16.
Example 7-16 debug flow exporter Command Options
RTP-R1# debug flow exporter ?
EXPORTER-1 exports to ELK
error Flow exporter errors
event Flow exporter events
name Flow exporter name keyword
packets Flow exporter packet information
<cr>
If multiple flow exporters are configured, you can specify the name of the configured exporter you want to troubleshoot. Example 7-17 shows how to enable debug flow exporter just for the EXPORTER-1 exporter.
Example 7-17 Debugging a Specific Flow Exporter
RTP-R1# debug flow exporter EXPORTER-1
Flow Exporter EXPORTER-1:
Flow Exporter standard debugging is on
The following are the optional keywords of the debug flow exporter command:
![]() error: Enables debugging for flow exporter errors
error: Enables debugging for flow exporter errors
![]() event: Enables debugging for flow exporter events
event: Enables debugging for flow exporter events
![]() name: Specifies the name of a configured flow exporter
name: Specifies the name of a configured flow exporter
![]() packets: Packet-level debugging for flow exporters
packets: Packet-level debugging for flow exporters
Remember that NetFlow uses UDP for communication. UDP is connectionless, meaning that the sender transmits data without any confirmation that the destination received the data. Subsequently, the next thing is to make sure that basic IP connectivity between the router and the ELK server is even possible. The administrator uses one of the most fundamental tools available, ping. He notices that he cannot even ping the server, as shown in Example 7-18.
Example 7-18 ping Command Output
RTP-R1# ping 172.18.104.179
Type escape sequence to abort.
Sending 5, 100-byte ICMP Echos to 172.18.104.179, timeout is 2 seconds:
.....
Success rate is 0 percent (0/5)
The administrator then verifies that RTP-R1 has a route for the 172.18.104.179 host by using the show ip route 172.18.104.179 command, as shown in Example 7-19.
Example 7-19 show ip route 172.18.104.179 Command Output
RTP-R1# show ip route 172.18.104.179
Routing entry for 172.18.0.0/16
Known via "static", distance 1, metric 0
Routing Descriptor Blocks:
* 10.1.48.3
Route metric is 0, traffic share count is 1
RTP-R1 does have a static route to the 172.18.0.0/16 network, but it was incorrectly configured. The route was pointing to 10.1.48.3 instead of the RTP-R4 router (10.1.48.2) in the management network. After the administrator corrects the route, he was able to ping the ELK server and see all the NetFlow data in the Kibana dashboard.
Additional Useful Troubleshooting Debug and Show Commands
The following are several additional debug and show commands that are very useful when troubleshooting NetFlow problems in a Cisco IOS device.
Verifying a Flow Monitor Configuration
You can use the show flow interface command to verify the configuration of a flow monitor in a specific interface. Example 7-20 shows the output of the show flow interface GigabitEthernet 0/0 command, detailing the flow monitor configuration of the Gigabit Ethernet 0/0 interface.
Example 7-20 show flow interface GigabitEthernet 0/0 Command Output
RTP-R1# show flow interface GigabitEthernet 0/0
Interface GigabitEthernet0/0
FNF: monitor: RTP-FLOW-MONITOR-1
direction: Input
traffic(ip): on
As you can see in Example 7-20, the flexible NetFlow flow monitor RTP-FLOW-MONITOR-1 has been associated to interface Gigabit Ethernet0/0. The direction of the traffic that is being monitored by the flow monitor has been configured to input. There are two possible values (input and output). When a flow monitor is configured with the input keyword, it monitors all traffic is being received by the interface. When a flow monitor is configured with the output keyword, it monitors all traffic is being transmitted by such interface.
The show flow monitor command can also be used to verify the configuration of an existing flow monitor, as shown in Example 7-21.
Example 7-21 show flow monitor Command Output
RTP-R1# show flow monitor
Flow Monitor RTP-FLOW-MONITOR-1:
Description: User defined
Flow Record: RTP-FLOW-RECORD-1
Flow Exporter: EXPORTER-1
Cache:
Type: normal
Status: allocated
Size: 4096 entries / 229392 bytes
Inactive Timeout: 15 secs
Active Timeout: 1800 secs
Update Timeout: 1800 secs
Synchronized Timeout: 600 secs
You can also specify the name of the flow monitor to display the information for a specific flow monitor. There are two additional optional keywords you can use with this command (cache and statistics), as demonstrated in Example 7-22.
Example 7-22 show flow monitor Command Options
RTP-R1# show flow monitor RTP-FLOW-MONITOR-1 ?
cache Flow monitor cache contents
statistics Flow monitor statistics
| Output modifiers
<cr>
Example 7-23 displays the status, statistics, and data for the flow monitor named RTP-FLOW-MONITOR-1.
Example 7-23 show flow monitor RTP-FLOW-MONITOR-1 cache Command Output
RTP-R1# show flow monitor RTP-FLOW-MONITOR-1 cache
Cache type: Normal
Cache size: 4096
Current entries: 4
High Watermark: 5
Flows added: 13
Flows aged: 9
- Active timeout ( 1800 secs) 0
- Inactive timeout ( 15 secs) 9
- Event aged 0
- Watermark aged 0
- Emergency aged 0
IPV4 SOURCE ADDRESS: 10.1.10.10
IPV4 DESTINATION ADDRESS: 10.2.20.21
IP PROTOCOL: 1
counter bytes: 2000
counter packets: 20
timestamp first: 00:52:58.943
timestamp last: 00:53:06.079
IPV4 SOURCE ADDRESS: 10.1.11.11
IPV4 DESTINATION ADDRESS: 10.2.20.21
IP PROTOCOL: 1
counter bytes: 1000
counter packets: 10
timestamp first: 00:53:07.743
timestamp last: 00:53:07.884
IPV4 SOURCE ADDRESS: 10.1.12.12
IPV4 DESTINATION ADDRESS: 10.2.20.21
IP PROTOCOL: 1
counter bytes: 2000
counter packets: 20
timestamp first: 00:53:08.867
timestamp last: 00:53:10.239
IPV4 SOURCE ADDRESS: 10.1.1.2
IPV4 DESTINATION ADDRESS: 10.2.20.21
IP PROTOCOL: 1
counter bytes: 17700
counter packets: 177
timestamp first: 00:53:18.419
timestamp last: 00:53:20.833
Example 7-24 displays the high-level statistics, and data for the flow monitor named RTP-FLOW-MONITOR-1.
Example 7-24 show flow monitor RTP-FLOW-MONITOR-1 statistics Command Output
RTP-R1# show flow monitor RTP-FLOW-MONITOR-1 statistics
Cache type: Normal
Cache size: 4096
Current entries: 1
High Watermark: 5
Flows added: 13
Flows aged: 12
- Active timeout ( 1800 secs) 0
- Inactive timeout ( 15 secs) 12
- Event aged 0
- Watermark aged 0
- Emergency aged 0
Displaying Flow Exporter Templates and Export IDs
An exporter template describes the NetFlow data and the flow set contains the actual data. This allows for flexible export. The show flow exporter templates command can be used to display the exporter template information such as the fields in the template, the version of the exporter format, the name of the exporter, the associated flow monitor, and other information. Example 7-25 shows the output of the show flow exporter templates command.
Example 7-25 show flow exporter templates Command Output
RTP-R1# show flow exporter templates
Flow Exporter EXPORTER-1:
Client: Flow Monitor RTP-FLOW-MONITOR-1
Exporter Format: NetFlow Version 9
Template ID : 256
Source ID : 0
Record Size : 25
Template layout
_____________________________________________________________________
| Field | Type | Offset | Size |
---------------------------------------------------------------------
| ipv4 source address | 8 | 0 | 4 |
| ipv4 destination address | 12 | 4 | 4 |
| ip protocol | 4 | 8 | 1 |
| counter bytes | 1 | 9 | 4 |
| counter packets | 2 | 13 | 4 |
| timestamp sys-uptime first | 22 | 17 | 4 |
| timestamp sys-uptime last | 21 | 21 | 4 |
---------------------------------------------------------------------
The show flow exporter export-ids command is a useful command that can be used as a reference when learning the different NetFlow or IPFIX export fields that can be exported and their IDs. You have three options with this command, as shown in Example 7-26.
Example 7-26 show flow exporter templates Command Options
RTP-R1# show flow exporter export-ids ?
ipfix IPFIX (Version 10)
netflow-v5 NetFlow Version 5
netflow-v9 NetFlow Version 9
Example 7-27 shows the output of the show flow exporter export-ids netflow-v9 command. This command output can be used as a reference to learn the NetFlow Version 9 export fields.
Example 7-27 show flow exporter export-ids netflow-v9 Command Output
RTP-R1# show flow exporter export-ids netflow-v9
Export IDs used by fields in NetFlow-v9 export format:
misc unsupported : 37027
datalink source-vlan-id : 58
datalink destination-vlan-id : 59
datalink encap-size : 242
datalink ethertype : 256
datalink length header : 240
datalink length payload : 241
datalink section header : 315
datalink vlan input : 58
datalink dot1q vlan input : 243
datalink dot1q vlan output : 254
datalink dot1q ce-vlan : 245
datalink dot1q priority : 244
datalink dot1q ce-priority : 246
datalink l2vpn metro vcid : 247
datalink l2vpn metro vctype : 248
datalink mac source-address : 56
datalink mac destination-address : 80
datalink mac source address input : 56
datalink mac source address output : 81
datalink mac destination address input : 80
datalink mac destination address output : 57
ip version : 60
ip tos : 5
<output omitted for brevity>
You can also use the debug flow exporter and debug flow monitor commands to display flow monitor transactions and flow exporter communications to the NetFlow collector. Example 7-28 shows the output of these commands. In this example, you can see the step-by-step process of how a source interface is selected by the flow exporter and how the flow monitor (mon-1) is created. In addition, you can see that the exporter (exporter-1) is successfully registered to the flow monitor (mon-1). After the flow record (record-1) is created, you can see that the source and destination IP addresses are recorded. At the end of the output of the debugs, you can see that the packet is queued to be sent to the collector.
Example 7-28 debug flow exporter and debug flow monitor Command Output
*Jan 26 16:43:55.310: FLOW EXP: Source interface Ethernet3/6 has had change of
IP address
*Jan 26 16:43:55.310: FLOW EXP: Selected Source IP address 0.0.0.0, dst 14.0.0.1
*Jan 26 16:43:55.318: FLOW EXP: Source interface Ethernet3/6 has had change of
IP address
*Jan 26 16:43:55.318: FLOW EXP: Selected Source IP address 0.0.0.0, dst 14.0.0.1
*Jan 26 16:43:55.462: FLOW EXP: Source interface Ethernet3/6 has had change of
IP address
*Jan 26 16:43:55.462: FLOW EXP: Selected Source IP address 14.0.0.2, dst 14.0.0.1
*Jan 26 16:43:55.462: FLOW EXP: Source interface Ethernet3/6 has had change of
IP address
*Jan 26 16:43:55.462: FLOW EXP: Selected Source IP address 14.0.0.2, dst 14.0.0.1
*Jan 26 16:44:02.682: FLOW MON: 'mon-1' created.
*Jan 26 16:44:02.750: FLOW EXP: Exporter exporter-1 successfully registered
Client mon-1
*Jan 26 16:44:02.834: Flow record: Master(record-1) Created
*Jan 26 16:44:03.694: FLOW EXP: Selected Source IP address 14.0.0.2, dst 14.0.0.1
*Jan 26 16:44:04.694: FLOW MON: Running ip input feature on Ethernet3/7
*Jan 26 16:44:04.694: FLOW MON: Running ip post input feature on Ethernet3/6
*Jan 26 16:44:04.694: FLOW MON: Running ip input feature on Ethernet3/7
*Jan 26 16:44:04.694: FLOW MON: Running ip post input feature on Ethernet3/6
*Jan 26 16:44:04.694: FLOW MON: Running ip input feature on Ethernet3/7
*Jan 26 16:44:04.694: FLOW MON: Running ip post input feature on Ethernet3/6
*Jan 26 16:44:04.694: FLOW MON: Running ip input feature on Ethernet3/7
*Jan 26 16:44:04.694: FLOW MON: Running ip post input feature on Ethernet3/6
*Jan 26 16:44:05.694: FLOW EXP: Time based resending of Template (ID: 256,
Exporter: em_1)
*Jan 26 16:44:05.694: FLOW EXP: Packet queued for process send
There are many application types that can be associated by the exporter. You can use the show flow exporter option application table command to display the detailed application options that can be used. You can familiarize yourself with all the supported applications by looking at the output of Example 7-29.
Example 7-29 show flow exporter option application table Command Output
RTP-R1# show flow exporter option application table
Engine: prot (IANA_L3_STANDARD, ID: 1)
! Different routing protocols are supported, as well as other Layer 3 standard
tunneling protocols.
appID Name Description
----- ---- -----------
1:8 egp Exterior Gateway Protocol
1:88 eigrp Enhanced Interior Gateway Routing Protocol
1:47 gre General Routing Encapsulation
1:1 icmp Internet Control Message Protocol
1:4 ipinip IP in IP
1:58 ipv6-icmp ICMP for IPv6
1:115 l2tp Layer 2 Tunneling Protocol
1:89 ospf Open Shortest Path First
1:46 rsvp Resource Reservation Protocol
! The following are the Layer 4 standard protocols supported by the flow exporter
! in Flexible NetFlow.
Engine: port (IANA_L4_STANDARD, ID: 3)
appID Name Description
----- ---- -----------
3:179 bgp Border Gateway Protocol
3:53 dns Domain Name Server lookup
3:79 finger Finger
3:21 ftp File Transfer Protocol
3:70 gopher Internet Gopher protocol, online document
management.
3:80 http World Wide Web traffic
3:143 imap Internet Mail Access Protocol
3:194 irc Internet Relay Chat
3:88 kerberos Kerberos Authentication Protocol
3:389 ldap Lightweight Directory Access Protocol
3:2049 nfs Network File System
3:119 nntp Network news transfer protocol
3:123 ntp Network Time Protocol
3:110 pop3 Post Office Protocol 3
3:1723 pptp Point-to-Point Tunneling Protocol
3:515 printer spooler
3:520 rip Routing Information Protocol
3:554 rtsp Real Time Streaming Protocol
3:990 secure-ftp FTP - File Transfer Protocol control over TLS/SSL
3:443 secure-http Secured HTTP using SSL or TLS
3:993 secure-imap Internet Message Access Protocol over TLS/SSL
3:994 secure-irc Secure Internet Relay Chat
3:636 secure-ldap secure LDAP - Lightweight Directory Access Protocol
3:563 secure-nntp Secure Network News Transfer Protocol
3:995 secure-pop3 Secure POP3 (Post Office Protocol), standard for
e-mail
3:992 secure-telnet Telnet protocol over SSL/TLS
3:5060 sip Session Initiation Protocol
3:25 smtp Simple Mail Transfer Protocol
3:161 snmp Simple Network Messaging Protocol
3:1080 socks Generic proxy protocol for TCP/IP-based networking
application
3:1700 sqlnet DEPRECATED, Please refer to oracle-sqlnet
3:1433 sqlserver Microsoft SQL Server
3:22 ssh Secure Shell
3:3478 stun-nat Session Traversal Utilities for NAT (STUN)
3:111 sunrpc SUN Remote Procedure Call
3:23 telnet Telnet - virtual text-oriented terminal over
network
3:69 tftp Trivial File Transfer Protocol
3:5222 xmpp-client Extensible Messaging and Presence Protocol (XMPP)
Client
3:6000 xwindows X-Windows remote access
! In this example, NBAR was not configured and no applications are displayed.
Engine: NBAR (NBAR_CUSTOM, ID: 6)
appID Name Description
----- ---- -----------
! The following are the standard Layer 7 supported applications.
Engine: layer7 (CISCO_L7_GLOBAL, ID: 13)
appID Name Description
----- ---- -----------
13:0 unclassified Unclassified traffic
13:1 unknown Unknown application
13:69 bittorrent bittorrent p2p file sharing client
13:80 cifs Common Internet File System
13:56 citrix Citrix Systems Metaframe 3.0
13:12 cuseeme CU-SeeMe desktop video conference
13:13 dhcp Dynamic Host Configuration Protocol
13:439 dht Distributed sloppy Hash Table protocol
13:70 directconnect Direct Connect Version 2.0, peer-to-peer file
sharing program
13:67 edonkey eDonkey p2p file sharing client
13:49 exchange MS-Exchange
13:57 fasttrack DEPRECATED, traffic will not match
13:58 gnutella Gnutella Version2 Traffic, peer-to-peer
file-sharing program
13:64 h323 H323 Protocol
13:9 ipsec IPSec traffic
13:59 kazaa2 DEPRECATED, traffic will not match
13:62 mgcp Media Gateway Control Protocol
13:1310 ms-rpc Microsoft Remote Procedure Call
13:26 netbios DEPRECATED, traffic will not match
13:426 netshow Microsoft Netshow, media streaming protocol
13:2000 notes DEPRECATED, Please refer to lotus-notes
13:47 novadigm Novadigm EDM
13:32 pcanywhere Symantec pcAnywhere remote desktop
13:66 rtcp Real Time Control Protocol
13:61 rtp Real Time Protocol
13:84 sap SAP Systems Applications Product in Data
processing
13:63 skinny Skinny Call Control Protocol
13:83 skype Skype Peer-to-Peer Internet Telephony Protocol
13:453 ssl Secure Socket Layer Protocol
13:427 streamwork Xing Technology StreamWorks player
13:41 syslog System Logging Utility
13:114 telepresence-control Cisco Telepresence-control
13:425 vdolive VDOLive streaming video
13:68 winmx WinMx file-sharing application
13:113 telepresence-media telepresence-media stream
13:478 telepresence-data telepresence-data stream
13:414 webex-meeting webex-meeting stream
13:81 cisco-phone Cisco IP Phones and PC-based Unified Communicators
13:472 vmware-view VMWARE View
13:473 wyze-zero-client WYZE Zero client
13:5060 sip Session Initiation Protocol
13:554 rtsp RTSP Protocol
13:496 jabber Jabber Protocol
13:5222 xmpp-client XMPP Client
13:777 ip-camera IP Video Surveillance Camera
13:778 surveillance-distribution Surveillance Distribution
RTP-R1#
Debugging Flow Records
You can enable debugging for Flexible NetFlow flow records by using the debug flow record command in privileged EXEC mode. The debug flow record command has several command options, as shown in Example 7-30.
Example 7-30 debug flow record Command Options
RTP-R1# debug flow record ?
RTP-FLOW-RECORD-1 User defined
clone-1 User defined
default-rtp User defined
default-tcp User defined
detailed Show detailed information
error Only show errors
name Debug a specific Flow Record
netflow Traditional NetFlow collection schemes
netflow-original User defined
netflow-v5 User defined
options Records used to define Flow Exporter options
<cr>
When troubleshooting NetFlow communications or record construction problems, you can start by using the debug flow record error command. If the output of the debug flow record error debugs do not provide you with the information you need to understand the problem, you can then use the debug flow record detailed command to display more detailed information
Preventing Export Storms with Flexible NetFlow
A Flexible NetFlow feature called Prevent Export Storms allows a network administrator to avoid “export storms” at a collecting device. These NetFlow export storms can take place especially when multiple Flexible NetFlow-enabled devices are configured to export NetFlow records to the same collector at the same synchronized time. These storms can take place due to the creation of the synchronized cache type. The concept called export spreading helps mitigate export storms. Synchronized cache with spreading requires the addition of the interval time stamp field for the synchronized cache.
This feature was introduced in Cisco IOS XE Release 3.11S.
It is recommended to add the interval as a key when no spreading is configured. When export spread is not configured, the default behavior is to immediately export the NetFlow record.
Note
The spread time must be smaller than half of the interval. Thus, it will be set to half the interval time or to the configured spread interval, whichever is lower, but not lower than one second.
You should configure spreading when the interval synchronization timeout is lower than 10 seconds. This is so that the asynchronous monitors will be able to aggregate the data within a few seconds.
Note
The default spread interval is 30 seconds. The maximum synchronized interval timeout value is 300 seconds. The maximum synchronized interval timeout value could be larger for native Flexible NetFlow monitors.
It is important to understand that the NetFlow/IPFIX header time stamp is set to the time when the record leaves the device, not when the record leaves the NetFlow cache. This is a common misconception. The time stamp fields in the record itself capture the time stamp of the packets and are accounted for in the NetFlow cache.
To configure the Prevent Export Storms feature, use the flow monitor type performance-monitor command. Example 7-31 shows an example configuration.
Example 7-31 Preventing Export Storms
RTP-R1# config terminal
Enter configuration commands, one per line. End with CNTL/Z.
RTP-R1(config)#flow monitor type performance-monitor RTP-perf-mon
RTP-R1(config-flow-monitor)#cache type synchronized
RTP-R1(config-flow-monitor)#cache timeout synchronized 12 export-spread 5
RTP-R1(config-flow-monitor)#exporter EXPORTER-1
RTP-R1(config-flow-monitor)#end
You can use the show flow monitor type performance-monitor command to show the details of the performance monitor configuration and statistics, as shown in Example 7-32.
Example 7-32 show flow monitor type performance-monitor Command Output
RTP-R1# show flow monitor type performance-monitor
Flow Monitor type performance-monitor RTP-perf-mon:
Description :User defined
Flow Record :default-tcp
Flow Exporter :EXPORTER-1
Cache type :synchronized
entries :2000
interval :12 (seconds)
history size :0 (intervals)
timeout :1 (intervals)
export spreading:TRUE
spreading seconds:5 (seconds)
Interface applied :0
Troubleshooting NetFlow in Cisco NX-OS Software
Several NetFlow troubleshooting commands in NX-OS are very similar to the ones in Cisco IOS and Cisco IOS XE Software. For instance, to view the statistics for the configured flow exporters, you can use the show flow exporter command, as shown in Example 7-33.
Example 7-33 show flow exporter NX-OS Command Output
switch# show flow exporter
Flow Exporter RTP-DC-EXPORTER-1:
Export Version 5
Exporter Statistics
Number of Flow Records Exported 406
Number of Export Packets Sent 1235
Number of Export Bytes Sent 3676523
Number of Destination Unreachable Events 0
Number of No Buffer Events 0
Number of Packets Dropped (No Route to Host) 0
Number of Packets Dropped (other) 0
Number of Packets Dropped (LC to RP Error) 0
Number of Packets Dropped (Output Drops) 0
Time statistics were last cleared: Never
Flow exporter timeout:
Export Version 5
Exporter Statistics
Number of Flow Records Exported 0
Number of Export Packets Sent 0
Number of Export Bytes Sent 0
Number of Destination Unreachable Events 0
Number of No Buffer Events 0
Number of Packets Dropped (No Route to Host) 0
Number of Packets Dropped (other) 0
Number of Packets Dropped (LC to RP Error) 0
Number of Packets Dropped (Output Drops) 0
Time statistics were last cleared: Never
Flow exporter test-exporter:
Description: test server in San Jose CA
Export Version 5
Exporter Statistics
Number of Flow Records Exported 0
Number of Export Packets Sent 0
Number of Export Bytes Sent 0
Number of Destination Unreachable Events 0
Number of No Buffer Events 0
Number of Packets Dropped (No Route to Host) 0
Number of Packets Dropped (other) 0
Number of Packets Dropped (LC to RP Error) 0
Number of Packets Dropped (Output Drops) 0
Time statistics were last cleared: Never
To view the configuration of a flow monitor applied to a given interface, you can use the show flow interface command, as demonstrated in Example 7-34.
Example 7-34 show flow interface Command Output in Cisco NX-OS
switch# show flow interface ethernet 0/0
Interface Ethernet0/0
FNF: monitor: RTP-DC-MONITOR-1
direction: Output
traffic(ip): on
Example 7-35 demonstrates how to display the status and statistics for the flow monitor named RTP-DC-MONITOR-1.
Example 7-35 show flow monitor RTP-DC-MONITOR-1 cache Command Output in Cisco NX-OS
switch# show flow monitor RTP-DC-MONITOR-1 cache
SrcAddr DstAddr Dir PktCnt ByteCnt
10.1.1.1 10.1.1.2 Egr 246 16412
10.1.1.1 10.1.1.2 Egr 1 70
10.1.1.1 10.1.1.2 Egr 1 74
10.1.1.1 10.1.1.2 Egr 1 74
20.1.1.1 20.1.1.2 Egr 1 74
The following are the fields in each column in Example 7-35:
![]() SrcAddr: The source address
SrcAddr: The source address
![]() DstAddr: The destination address
DstAddr: The destination address
![]() PktCnt: The number of packets that have been monitored and accounted for
PktCnt: The number of packets that have been monitored and accounted for
![]() ByteCnt: The number of bytes that have been monitored and accounted for
ByteCnt: The number of bytes that have been monitored and accounted for
You can display the status and statistics for a Flexible NetFlow flow monitor by using the show flow sw-monitor name statistics command, as shown in Example 7-36.
Example 7-36 show flow sw-monitor RTP-DC-MONITOR-1 statistics Command Output in Cisco NX-OS
switch# show flow sw-monitor RTP-DC-MONITOR-1 statistics
Cache type: Normal
Cache size: 4096
Current entries: 4
High Watermark: 6
Flows added: 124
Flows aged: 115
- Active timeout ( 1800 secs) 0
- Inactive timeout ( 15 secs) 112
- Event aged 0
- Watermark aged 0
- Emergency aged 0
Several additional commands can help you display NetFlow configuration statistics and prove useful when troubleshooting NetFlow problems in Cisco NX-OS devices:
![]() show flow record netflow layer2-switched input: Used to display information about Layer 2 NetFlow configuration
show flow record netflow layer2-switched input: Used to display information about Layer 2 NetFlow configuration
![]() show flow timeout: Used to display information about NetFlow timeouts
show flow timeout: Used to display information about NetFlow timeouts
![]() show hardware flow aging: Used to display information about NetFlow aging flows in hardware
show hardware flow aging: Used to display information about NetFlow aging flows in hardware
![]() show hardware flow entry address table-address type {ip | ipv6} [module module]: Used to display information about NetFlow table entries in hardware
show hardware flow entry address table-address type {ip | ipv6} [module module]: Used to display information about NetFlow table entries in hardware
![]() show hardware flow ip: Used to display information about NetFlow IPv4 flows in hardware
show hardware flow ip: Used to display information about NetFlow IPv4 flows in hardware
![]() show hardware flow sampler: Used to display information about the NetFlow sampler in hardware
show hardware flow sampler: Used to display information about the NetFlow sampler in hardware
![]() show hardware flow utilization: Used to display information about NetFlow table utilization in the hardware
show hardware flow utilization: Used to display information about NetFlow table utilization in the hardware
![]() show sampler name: Used to display information about NetFlow samplers
show sampler name: Used to display information about NetFlow samplers
Troubleshooting NetFlow in Cisco IOS-XR Software
This section covers several tips useful when troubleshooting NetFlow-related problems in Cisco IOS XR devices. Even though most of the commands are very similar to the ones you learned earlier in this chapter for Cisco IOS, Cisco IOS-XE, and Cisco NX-OS platforms, the NetFlow architecture differs significantly in Cisco IOS-XR. In Cisco IOS-XR, NetFlow is not hardware accelerated, but instead it is distributed. Each individual line card runs its own instance of NetFlow, and resources are shared between the interfaces and network processing units (NPUs) on the line card. It is very important that you become familiar with the NetFlow architecture in Cisco IOS-XR to be able to successfully troubleshoot any problems you may encounter.
Figure 7-2 illustrates a high-level architecture of a Cisco ASR 9000 series router line card.

In Figure 7-2, the first NPU is configured with one interface, the second has two interfaces, and the third NPU has one interface. When you have one interface to one NPU, the full interface rate is available for NetFlow processing. For instance, on a Cisco ASR 9000 series router, it will be 100,000 packets per second (pps) in Trident cards and 200,000 pps in Typhoon-based cards. When two interfaces are enabled on an NPU, the total capacity of such NPUs is shared, depending on the type of the line card.
Figure 7-3 illustrates a diagram that explains the packet and NetFlow configuration flow in a Cisco ASR 9000 running Cisco IOS-XR software. This process is also very similar in Cisco Carrier Routing System (CRS) and Cisco Network Convergence System (NCS) devices.
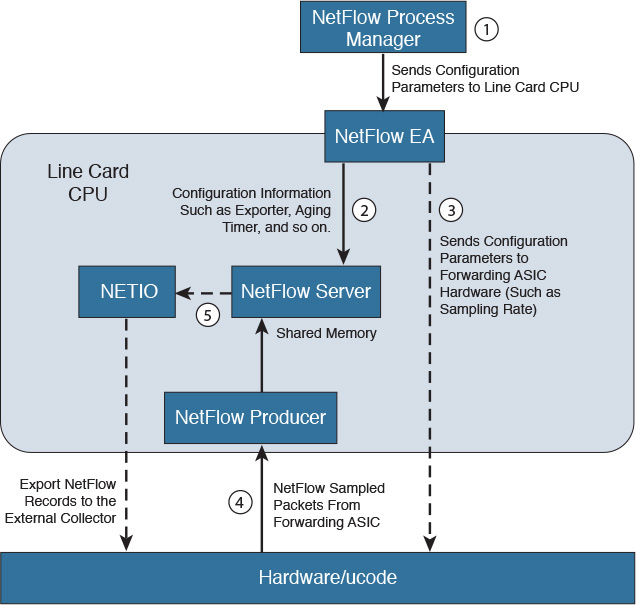
The following are the steps illustrated in Figure 7-3:
Step 1. The NetFlow process manager is responsible for sending the configuration parameters to the line card CPU.
Step 2. The NetFlow execution agent (EA) sends configuration parameters (such as the exporter information, aging timers, and so on) to the NetFlow server.
Step 3. The NetFlow EA also sends other configuration parameters to the forwarding application-specific integrated circuit (ASIC), such as the NetFlow sampling rate.
Step 4. Once traffic is collected, the NetFlow sampled packets pass through the sampling policer. The hardware ucode extracts data from the header fields and sends them to the line card CPU (NetFlow producer) to construct a flow record. The line card CPU sends the flow record to the NetFlow cache, and they remain in the line card cache until they are aged due to either timer expiry or cache exhaustion. There are two timers running for flow aging: the active timer and the inactive timer.
Step 5. The NetFlow server is also responsible for sending the sampled NetFlow records to the NETIO and subsequently to the external NetFlow collector.
The recording of flow attributes in supported line cards is done by the line card CPU. All flow packets from the NPs are punted to line card CPU. To prevent flow packets arriving from the network processor (NP) at an overwhelming rate, the punt path is policed by internal programming policers on all the NPs that have NetFlow-enabled interfaces. The policer rate is determined based on the CPU capable rate divided by number of NetFlow enabled interfaces on each NP.
Now that you have learned a few concepts of the NetFlow packet flow and architecture in Cisco IOS XR devices, let’s examine some of the show commands that are very useful for troubleshooting. Several of these commands are very similar to the commands you learned earlier in this chapter.
Flow Exporter Statistics and Diagnostics
One of the most useful commands to display detailed information about the flow exporter configuration in a Cisco IOS-XR device is the show flow exporter command. Example 7-37 shows the output of this command.
Example 7-37 show flow exporter Command Output in Cisco IOS-XR
RP/0/RP0/CPU0:router# show flow exporter RTP-exp-1 location 0/0/CPU0
Flow Exporter: NFC
Used by flow monitors: RTP-flow-mon-1
Status: Normal
Transport UDP
Destination 172.18.104.179 (50001)
Source 10.1.1.24 (5956)
Flows exported: 0 (0 bytes)
Flows dropped: 0 (0 bytes)
Templates exported: 1 (88 bytes)
Templates dropped: 0 (0 bytes)
Option data exported: 0 (0 bytes)
Option data dropped: 0 (0 bytes)
Option templates exported: 2 (56 bytes)
Option templates dropped: 0 (0 bytes)
Packets exported: 21 (1008 bytes)
Packets dropped: 0 (0 bytes)
Total export over last interval of:
1 hour: 0 pkts
0 bytes
0 flows
1 minute: 21 pkts
1008 bytes
0 flows
1 second: 0 pkts
0 bytes
0 flows
In Example 7-37, the location keyword is used to specify the location where the cache resides. The node-id argument is expressed in the rack/slot/module notation. In this example, the node-id is 0/0/CPU0.
Tip
You can use the show platform command to see the location of all nodes installed in the router.
In the output of the show flow exporter command shown in Example 7-37, you can see the following information:
![]() The flow monitor associated to this exporter (RTP-flow-mon-1 in this example).
The flow monitor associated to this exporter (RTP-flow-mon-1 in this example).
![]() The transport protocol (UDP).
The transport protocol (UDP).
![]() The exporter destination address.
The exporter destination address.
![]() The status of the exporter. Normal means that the exporter is active and that the router can export packets. Disabled means that the exporter cannot send packets because the collector is unreachable or the configuration is in complete.
The status of the exporter. Normal means that the exporter is active and that the router can export packets. Disabled means that the exporter cannot send packets because the collector is unreachable or the configuration is in complete.
![]() The flows exported and dropped (in bytes).
The flows exported and dropped (in bytes).
![]() The templates exported and dropped (in bytes).
The templates exported and dropped (in bytes).
![]() The option data exported and dropped (in bytes).
The option data exported and dropped (in bytes).
![]() The option templates exported and dropped (in bytes).
The option templates exported and dropped (in bytes).
![]() The average export rate, in bytes per packets. The information there is shown for intervals of the last hour, 1 minute, and 1 second.
The average export rate, in bytes per packets. The information there is shown for intervals of the last hour, 1 minute, and 1 second.
Another useful command is the show flow exporter-map command demonstrated in Example 7-38.
Example 7-38 show flow exporter-map Command Output in Cisco IOS-XR
RP/0/RP0/CPU0:router# show flow exporter-map rtp-map1
Flow Exporter Map : rtp-map1
-------------------------------------------------
Id : 2
DestinationIpAddr : 172.18.104.179
SourceIfName : Loopback0
SourceIpAddr : 10.1.1.24
DSCP : 10
TransportProtocol : UDP
TransportDestPort : 9995
Export Version: 9
Common Template Timeout : 1800 seconds
Options Template Timeout : 1800 seconds
Data Template Timeout : 600 seconds
Interface-Table Export Timeout : 1800 seconds
Sampler-Table Export Timeout : 0 seconds
The following are the fields shown in Example 7-38:
![]() The name of the exporter map (rtp-map1 in this example).
The name of the exporter map (rtp-map1 in this example).
![]() The ID of the exporter map (2 in this example).
The ID of the exporter map (2 in this example).
![]() The destination IP address of the exporter (172.18.104.179).
The destination IP address of the exporter (172.18.104.179).
![]() The source interface (Loopback 0).
The source interface (Loopback 0).
![]() The source IP address (10.1.1.24).
The source IP address (10.1.1.24).
![]() The differentiated services code point (DSCP) value for export packets configured with the flow exporter-map command.
The differentiated services code point (DSCP) value for export packets configured with the flow exporter-map command.
![]() The transport protocol. Cisco IOS XR software only supports UDP as the transport protocol.
The transport protocol. Cisco IOS XR software only supports UDP as the transport protocol.
![]() The configured destination port for UDP packets.
The configured destination port for UDP packets.
![]() The NetFlow version used (version 9 in this example). Only NetFlow Version 9 is supported in Cisco IOS-XR.
The NetFlow version used (version 9 in this example). Only NetFlow Version 9 is supported in Cisco IOS-XR.
![]() The configured common template timeout.
The configured common template timeout.
![]() The configured options template timeout.
The configured options template timeout.
![]() The configured data template timeout.
The configured data template timeout.
![]() The export timeout value for the interface table.
The export timeout value for the interface table.
![]() The export timeout value for the sampler table.
The export timeout value for the sampler table.
Flow Monitor Statistics and Diagnostics
You can use the show flow monitor command to display flow monitor information for a specific monitor map cache, as shown in Example 7-39. In Example 7-39, the name of the flow monitor is RTP-flow-mon-1, and the location is 0/0/CPU0.
Example 7-39 show flow monitor Command Output in Cisco IOS-XR
RP/0/RP0/CPU0:router# show flow monitor RTP-flow-mon-1 cache location 0/0/CPU0
Cache summary for Flow Monitor RTP-flow-mon-1:
Cache size: 65535
Current entries: 4
High Watermark: 62258
Flows added: 4
Flows not added: 0
Ager Polls: 60
- Active timeout 0
- Inactive timeout 0
- TCP FIN flag 0
- Watermark aged 0
- Emergency aged 0
- Counter wrap aged 0
- Total 0
Periodic export:
- Counter wrap 0
- TCP FIN flag 0
Flows exported 4
Matching entries: 4
IPV4SrcAddr IPV4DstAddr L4SrcPort L4DestPort BGPDstOrigAS BGPSrcOrigAS
IPV4DstPrfxLen
IPV4SrcPrfxLen IPV4Prot IPV4TOS InputInterface OutputInterface L4TCPFlags
ForwardStatus
ForwardReason FirstSwitched LastSwitched ByteCount PacketCount Dir Sampler ID
10.1.17.2 10.1.18.2 0 0 0 0
24 24 $
61 normal HundredGigE /0/0/8 HundredGigE 0/0/0/12 0
Fwd 0 00
00:02:43:800 00 00:02:49:980 37200 620 In 0
10.1.18.2 .10.1.17.2 0 0 0 0
24 24 $
61 normal HundredGigE 0/0/0/12 HundredGigE 0/0/0/8 0
Fwd 0 00
00:02:43:791 00 00:02:49:980 37200 620 In 0
10.1.17.2 10.1.18.2 0 0 0 0
24 0 $
61 normal HundredGigE 0/0/0/8 HundredGigE 0/0/0/12 0
Fwd 0 00
00:02:43:798 00 00:02:49:980 34720 620 Out 0
10.1.18.2 10.1.17.2 0 0 0 0
24 0 $
61 normal HundredGigE 0/0/0/12 HundredGigE 0/0/0/8 0
Fwd 0 00
00:02:43:797 00 00:02:49:980 34720 620 Out 0
L4SrcPort L4DestPort BGPDstOrigAS BGPSrcOrigAS IPV4DstPrfxLen
In Example 7-39, the cache summary displays general cache information for RTP-flow-mon-1:
![]() The cache size for the specified flow monitor map
The cache size for the specified flow monitor map
![]() The current number of entries in the cache
The current number of entries in the cache
![]() The high watermark for this cache
The high watermark for this cache
![]() The number of flows added to the cache
The number of flows added to the cache
![]() The number of flows not added to the cache
The number of flows not added to the cache
The Ager Polls section displays the following ager statistics:
![]() The active timeout
The active timeout
![]() The inactive timeout
The inactive timeout
![]() The number of TCP FIN flags
The number of TCP FIN flags
![]() Watermark aged
Watermark aged
![]() Emergency aged
Emergency aged
![]() Counter wrap aged
Counter wrap aged
![]() Total count for all the ager polls
Total count for all the ager polls
The periodic export count section includes statistics for the following:
![]() Counter wrap
Counter wrap
![]() TCP FIN flag
TCP FIN flag
The last section of the output of Example 7-39 shows the number of flows exported, matching entries, and the actual flow entries.
The show flow monitor command is very useful and can be combined in many different combinations depending on the information you want to display and evaluate. The following are several examples of its usage:
![]() If you want to match on access control lists (ACLs) and one or more fields, use the following options:
If you want to match on access control lists (ACLs) and one or more fields, use the following options:
show flow monitor monitor_name cache match {ipv4 {acl name | source-address
match_options |destination-address match_options | protocol match_options | tos
match-options }| ipv6 {acl name | source-address match_options | destination-
address match_options | protocol match_options | tc match_options}| layer4
{source-port-overloaded match_options | destination- port-overloaded match_
options | tcp-flags match_flags_options}| bgp {source-as match_options |
destination-as match_options}| interface {ingress match_if_options | egress
match_if_options }| timestamp {first match_options | last match_options}|
counters {byte match_options | packets match_options}| misc {forwarding-
status match_options | direction match_dir_options}}
![]() You can use the following options to sort flow record information according to a particular field:
You can use the following options to sort flow record information according to a particular field:
show flow monitor monitor_name cache sort {ipv4 {source-address | destination-
address | tos | protocol}| ipv4 {source-address | destination-address | tc |
protocol}| mpls {label-2 | label-3 | label-4 | label-5 | label-6 | label-type
| prefix | top-label }| layer4 {source-port-overloaded | destination-
port-overloaded }| bgp {source-as | destination-as}| timestamp {first |
last}| counters {bytes | packets}| misc {forwarding-status | direction}{top |
bottom}
![]() You can use the following options to include or exclude one or more fields in the show flow monitor command output:
You can use the following options to include or exclude one or more fields in the show flow monitor command output:
show flow monitor monitor_name cache {include | exclude}{ipv4 {source-address
| destination-address | tos | protocol}| ipv6 {source-address | destination-
address | tc | flow-label | option-headers | protocol}| mpls {label-2 |
label-3 | label-4 | label-5 | label-6 | top-label}| layer4 {source-port-overloaded
| destination-port-overloaded}| bgp {source-as | destination-as}| timestamp
{first | last}| counters {bytes | packets}| misc {forwarding-status match_
options | direction match_dir_options}}
![]() The following options can be used to display summarized flow record statistics:
The following options can be used to display summarized flow record statistics:
show flow monitor monitor_name cache summary location node_id
![]() You can use the following options to display only key field, packet, and byte information for the flow records:
You can use the following options to display only key field, packet, and byte information for the flow records:
show flow monitor monitor_name cache brief location node_id
![]() You can use the following options to display flow record information for a particular node only:
You can use the following options to display flow record information for a particular node only:
show flow monitor monitor_name cache location node_id
The show flow monitor monitor_name cache summary command can also be used with any combinations of the following options:
![]() format
format
![]() match
match
![]() include
include
![]() exclude
exclude
![]() sort
sort
![]() summary
summary
![]() location
location
Example 7-40 demonstrates and lists those options.
Example 7-40 show flow monitor monitor-name cache summary Command Options in Cisco IOS-XR
RP/0/RP0/CPU0:router# show flow monitor rtp-map1 cache summary ?
brief Show just the key fields
exclude Exclude field
format Display format
include Include field
location Specify a location
match Match criteria
sort Sorting criteria
You can use the show flow monitor-map command to display information about a configured flow monitor-map, as shown in Example 7-41.
Example 7-41 show flow monitor-map Command Output
RP/0/RP0/CPU0:router# show flow monitor-map rtp-map1
Flow Monitor Map : rtp-map1
-------------------------------------------------
Id: 1
RecordMapName: ipv4
ExportMapName: RTP-exp-1
CacheAgingMode: Permanent
CacheMaxEntries: 10000
CacheActiveTout: N/A
CacheInactiveTout: N/A
CacheUpdateTout: 60 seconds
The following are the fields displayed in the output of the show flow monitor-map command shown in Example 7-41:
![]() The name of the flow monitor map (rtp-map1).
The name of the flow monitor map (rtp-map1).
![]() The flow monitor map ID.
The flow monitor map ID.
![]() The name of the export map that is associated with this monitor map (RTP-exp-1).
The name of the export map that is associated with this monitor map (RTP-exp-1).
![]() The Current aging mode configured on this cache. In this example, Permanent indicates that the removal of entries from the monitor map flow cache is disabled. This is a configurable value that can be configured using the flow monitor-map command.
The Current aging mode configured on this cache. In this example, Permanent indicates that the removal of entries from the monitor map flow cache is disabled. This is a configurable value that can be configured using the flow monitor-map command.
![]() The number of flow entries currently allowed in the flow cache before the oldest entry is removed. This is a configurable value that can be configured using the flow monitor-map command.
The number of flow entries currently allowed in the flow cache before the oldest entry is removed. This is a configurable value that can be configured using the flow monitor-map command.
![]() The active flow timeout configured for this cache, in seconds. You can modify the configured active flow timeout using the flow monitor-map command.
The active flow timeout configured for this cache, in seconds. You can modify the configured active flow timeout using the flow monitor-map command.
![]() The inactive flow timeout configured for this cache, in seconds. This is also configurable using the flow monitor-map command.
The inactive flow timeout configured for this cache, in seconds. This is also configurable using the flow monitor-map command.
![]() The update timeout configured for this cache, in seconds. You guess correctly; this is also configurable using the flow monitor-map command.
The update timeout configured for this cache, in seconds. You guess correctly; this is also configurable using the flow monitor-map command.
Displaying NetFlow Producer Statistics in Cisco IOS-XR
Earlier in this chapter, you learned the role of the NetFlow producer. You can display detailed information about the NetFlow producer by using the show flow platform producer statistics command and specifying the location of the node of the NetFlow producer you want to examine. Example 7-42 displays the output of the show flow platform producer statistics command.
Example 7-42 show flow platform producer statistics Command Output
RP/0/RP0/CPU0:router# show flow platform producer statistics location 0/0/CPU0
Mon Jan 5 09:25:22.552 UTC
NetFlow Platform Producer Counters:
IPv4 Ingress Packets: 51447246
IPv4 Egress Packets: 51447242
IPv6 Ingress Packets: 0
IPv6 Egress Packets: 0
MPLS Ingress Packets: 0
MPLS Egress Packets: 0
Drops (no space): 0
Drops (other): 0
Unknown Ingress Packets: 0
Unknown Egress Packets: 0
Worker waiting: 8677
SPP Packets: 4332602
Flow Packets: 95894488
Flow Packets per SPP Frame: 40
Example 7-42 shows the NetFlow Producer statistics for the location 0/0/CPU0. The following counters are displayed:
![]() The number of IPV4 packets that were received from the remote end
The number of IPV4 packets that were received from the remote end
![]() The number of transmitted IPV4 packets
The number of transmitted IPV4 packets
![]() The number of Multiprotocol Label Switching (MPLS) packets that were received from the remote end
The number of Multiprotocol Label Switching (MPLS) packets that were received from the remote end
![]() The number of transmitted MPLS packets
The number of transmitted MPLS packets
![]() The number of packets that the producer could not enqueue to the NetFlow server because the server input ring was full
The number of packets that the producer could not enqueue to the NetFlow server because the server input ring was full
![]() The number of packets that the producer could not enqueue to the NetFlow server due to errors other than the server input ring being full
The number of packets that the producer could not enqueue to the NetFlow server due to errors other than the server input ring being full
![]() The number of unrecognized packets received from the remote end that were dropped
The number of unrecognized packets received from the remote end that were dropped
![]() The number of packets transmitted to the remote end that was dropped because they were not recognized by the remote end
The number of packets transmitted to the remote end that was dropped because they were not recognized by the remote end
![]() The number of times that the producer needed to use the server
The number of times that the producer needed to use the server
![]() The number of sequenced packet protocol (SPP) packets transmitted to the remote end
The number of sequenced packet protocol (SPP) packets transmitted to the remote end
![]() The number of flow packets transmitted to the remote end
The number of flow packets transmitted to the remote end
![]() The number of flow packets per SPP frame transmitted to the remote end
The number of flow packets per SPP frame transmitted to the remote end
You can clear statistics collected by the NetFlow producer by using the clear flow platform producer statistics location command in EXEC mode, as follows:
RP/0/RP0/CPU0:router# clear flow platform producer statistics location 0/0/CPU0
Additional Useful Cisco IOS-XR Show Commands
You can use several additional commands low-level troubleshooting:
![]() show flow platform nfea sampler: Used to display NetFlow sampler map information and statistics.
show flow platform nfea sampler: Used to display NetFlow sampler map information and statistics.
![]() show flow platform nfea interface: Used to display NetFlow EA information and statistics for a given interface.
show flow platform nfea interface: Used to display NetFlow EA information and statistics for a given interface.
![]() show flow platform nfea sp location: Used to display NetFlow EA sampling profile information and statistics for a given location.
show flow platform nfea sp location: Used to display NetFlow EA sampling profile information and statistics for a given location.
![]() show flow platform nfea policer np: Used to display NetFlow EA policer information and statistics for a given node.
show flow platform nfea policer np: Used to display NetFlow EA policer information and statistics for a given node.
![]() show flow trace: Useful to show low level information about the NetFlow manager, NetFlow server, NetFlow EA, and others.
show flow trace: Useful to show low level information about the NetFlow manager, NetFlow server, NetFlow EA, and others.
Example 7-43 shows the different options of the show flow trace command.
Example 7-43 show flow trace Command Options
RP/0/RSP0/CPU0:router# show flow trace ?
all Include traces from all flow subsystems
ea Include traces from execution agent
ma Include traces from management agent
mgr Include traces from manager
platform Include traces from platform specific component
server Include traces from server
worker Include traces from the worker thread
Troubleshooting NetFlow in the Cisco ASA
There are a few useful commands when troubleshooting NetFlow in the Cisco ASA. The topology in Figure 7-4 is used in the following examples. A regional office in Austin, Texas, has a Cisco ASA 5525-X configured for NetFlow Secure Event Logging (NSEL).

The Cisco ASA in Austin is configured to send NetFlow records to a collector with the IP address of 192.168.1.205, which is reached by the management interface of the Cisco ASA. The network administrator notices that he is not receiving NetFlow information in the collector, even though basic IP connectivity is successful.
First let’s see whether NetFlow records (packets) are being sent by the Cisco ASA by using the show flow-export counters command, as shown in Example 7-44.
Example 7-44 show flow-export counters Command Output in the Cisco ASA
aus-asa# show flow-export counters
destination: management 192.168.1.205 9901
Statistics:
packets sent 369388
Errors:
block allocation failure 0
invalid interface 0
template send failure 0
no route to collector 0
failed to get lock on block 0
source port allocation failure 0
In Example 7-44, the Cisco ASA shows that it has sent 369,388 packets to the NetFlow collector. You can see that the destination is correctly set to 192.168.1.205, which resides in the management interface. You can also see that the ASA is configured to send the NetFlow packets using UDP 9901. The error counters are all zero. The show flow-export counters command can help you determine whether there are any errors in the transmission of NetFlow records/packets because of any of the following reasons:
![]() Memory block allocation failures
Memory block allocation failures
![]() Invalid interface being configured or sourced
Invalid interface being configured or sourced
![]() NetFlow template send failures
NetFlow template send failures
![]() No route to the NetFlow collector
No route to the NetFlow collector
![]() Failed to get lock on memory block
Failed to get lock on memory block
![]() UDP source port allocation failures
UDP source port allocation failures
After analyzing the output of the show flow-export counters command, the administrator decides to use the capture command to capture all packets sourced from the Cisco ASA to the NetFlow collector. The capture command is extremely useful when troubleshooting any communication problems in the Cisco ASA, because it converts the Cisco ASA in a sniffer capturing all packets for a given criteria. The syntax of the capture command is as follows:
capture capture_name [ type { asp-drop all [ drop-code ] | tls-proxy | raw-data
| lacp | isakmp [ikev1| ikev2] | inline-tag [ tag ] | webvpn user webvpn-user }]
[ access-list access_list_name ][ interface asa_dataplane ] [ buffer buf_size ]
[ ethernet-type type ] [ interface interface_name ][ reinject-hide ] [ packet-
length bytes ] [ circular-buffer ] [ trace trace_count ] [ real-time ][ trace ]
[ match prot { host source- ip | source -ip mask | any }{ host destination- ip
| destination -ip mask | any } [ operator port ]
Example 7-45 shows the configuration of the capture command entered by the administrator in the Cisco ASA in Austin.
Example 7-45 Collecting NetFlow Packet Captures Using the capture Command
aus-asa(config)# capture netflow-cap interface management match udp host 192.168.1.1
host 192.168.1.205 eq 9901
In Example 7-45, the capture name is netflow-cap and the capture is applied to the management interface. The administrator wants to collect all UDP traffic sourced from the management interface of the Cisco ASA (192.168.1.1) to the NetFlow collector (192.168.1.205) over UDP port 9901.
You can use the show capture command to review the capture configuration and to make sure that the capture is working and collecting traffic, as shown in Example 7-46.
Example 7-46 show capture Command Output
aus-asa# show capture
capture netflow-cap type raw-data interface management [Capturing - 15276 bytes]
match udp host 192.168.1.1 host 192.168.1.205 eq 9901
To view the details of the packet capture, use the show capture capture_name detail command, as demonstrated in Example 7-47.
Example 7-47 show capture netflow-cap detail Command Output
aus-asa# show capture netflow-cap detail
21 packets captured
1: 19:09:56.956844 0006.f62a.ee45 000c.294d.1125 0x0800 Length: 946
192.168.1.1.13955 > 192.168.1.205.9901: [udp sum ok] udp 904 (ttl 255,
id 56808)
2: 19:10:01.984949 0006.f62a.ee45 000c.294d.1125 0x0800 Length: 1242
192.168.1.1.13955 > 192.168.1.205.9901: [udp sum ok] udp 1200 (ttl 255,
id 50882)
3: 19:10:07.013121 0006.f62a.ee45 000c.294d.1125 0x0800 Length: 714
192.168.1.1.13955 > 192.168.1.205.9901: [udp sum ok] udp 672 (ttl 255,
id 54557)
4: 19:10:12.041211 0006.f62a.ee45 000c.294d.1125 0x0800 Length: 1414
192.168.1.1.13955 > 192.168.1.205.9901: [udp sum ok] udp 1372 (ttl 255,
id 58539)
5: 19:10:17.069317 0006.f62a.ee45 000c.294d.1125 0x0800 Length: 1210
192.168.1.1.13955 > 192.168.1.205.9901: [udp sum ok] udp 1168 (ttl 255,
id 44241)
6: 19:10:22.097407 0006.f62a.ee45 000c.294d.1125 0x0800 Length: 1138
192.168.1.1.13955 > 192.168.1.205.9901: [udp sum ok] udp 1096 (ttl 255,
id 45668)
7: 19:10:27.125527 0006.f62a.ee45 000c.294d.1125 0x0800 Length: 714
192.168.1.1.13955 > 192.168.1.205.9901: [udp sum ok] udp 672 (ttl 255,
id 47482)
8: 19:10:32.153632 0006.f62a.ee45 000c.294d.1125 0x0800 Length: 898
192.168.1.1.13955 > 192.168.1.205.9901: [udp sum ok] udp 856 (ttl 255,
id 47263)
9: 19:10:37.181722 0006.f62a.ee45 000c.294d.1125 0x0800 Length: 686
192.168.1.1.13955 > 192.168.1.205.9901: [udp sum ok] udp 644 (ttl 255,
id 41339)
10: 19:10:42.209828 0006.f62a.ee45 000c.294d.1125 0x0800 Length: 874
192.168.1.1.13955 > 192.168.1.205.9901: [udp sum ok] udp 832 (ttl 255,
id 42217)
11: 19:10:47.237948 0006.f62a.ee45 000c.294d.1125 0x0800 Length: 1382
192.168.1.1.13955 > 192.168.1.205.9901: [udp sum ok] udp 1340 (ttl 255,
id 37157)
12: 19:10:52.266023 0006.f62a.ee45 000c.294d.1125 0x0800 Length: 922
192.168.1.1.13955 > 192.168.1.205.9901: [udp sum ok] udp 880 (ttl 255,
id 46611)
13: 19:10:57.294143 0006.f62a.ee45 000c.294d.1125 0x0800 Length: 1398
192.168.1.1.13955 > 192.168.1.205.9901: [udp sum ok] udp 1356 (ttl 255,
id 36149)
14: 19:11:01.869629 0006.f62a.ee45 000c.294d.1125 0x0800 Length: 1514
192.168.1.1.13955 > 192.168.1.205.9901: [udp sum ok] udp 1472 (ttl 255,
id 55718)
15: 19:11:06.897795 0006.f62a.ee45 000c.294d.1125 0x0800 Length: 1118
192.168.1.1.13955 > 192.168.1.205.9901: [udp sum ok] udp 1076 (ttl 255,
id 42311)
16: 19:11:11.925885 0006.f62a.ee45 000c.294d.1125 0x0800 Length: 854
192.168.1.1.13955 > 192.168.1.205.9901: [udp sum ok] udp 812 (ttl 255,
id 61926)
17: 19:11:16.953991 0006.f62a.ee45 000c.294d.1125 0x0800 Length: 758
192.168.1.1.13955 > 192.168.1.205.9901: [udp sum ok] udp 716 (ttl 255,
id 56845)
18: 19:11:21.982111 0006.f62a.ee45 000c.294d.1125 0x0800 Length: 418
192.168.1.1.13955 > 192.168.1.205.9901: [udp sum ok] udp 376 (ttl 255,
id 56342)
19: 19:11:27.010253 0006.f62a.ee45 000c.294d.1125 0x0800 Length: 1006
192.168.1.1.13955 > 192.168.1.205.9901: [udp sum ok] udp 964 (ttl 255,
id 54177)
20: 19:11:30.156318 0006.f62a.ee45 000c.294d.1125 0x0800 Length: 1474
192.168.1.1.13955 > 192.168.1.205.9901: [udp sum ok] udp 1432 (ttl 255,
id 52633)
21: 19:11:35.172537 0006.f62a.ee45 000c.294d.1125 0x0800 Length: 1502
192.168.1.1.13955 > 192.168.1.205.9901: [udp sum ok] udp 1460 (ttl 255,
id 45542)
21 packets shown
In Example 7-47, a total of 21 packets were captured, and you can see the details of each packet. To view the actual dump of each of the packets collected, you can use the show capture capture_name dump command, as shown in Example 7-48.
Example 7-48 show capture netflow-cap dump Command Output
aus-asa# show capture netflow-cap dump
21 packets captured
1: 19:09:56.956844 192.168.1.1.13955 > 192.168.1.205.9901: udp 904
0x0000 000c 294d 1125 0006 f62a ee45 0800 4500 ..)M.%...*.E..E.
0x0010 03a4 dde8 0000 ff11 5641 c0a8 0101 c0a8 ........VA......
0x0020 01cd 3683 26ad 0390 7bb1 0009 000c 47de ..6.&...{.....G.
0x0030 3675 54ab 27d4 0005 a318 0000 0000 0100 6uT.'...........
0x0040 0068 0017 0850 c0a8 01cd 0000 0004 c0a8 .h...P..........
0x0050 0101 0000 ffff 0103 03c0 a801 cdc0 a801 ................
0x0060 0100 0000 0001 0000 0000 014a bc93 8432 ...........J...2
0x0070 0000 014a bc93 8432 0000 0000 0000 0000 ...J...2........
0x0080 0000 0000 0000 0000 0000 0000 0000 0000 ................
0x0090 0000 0000 0000 0000 0000 0000 0000 0000 ................
0x00a0 0000 0000 0000 0107 0080 0017 0850 c0a8 .............P..
0x00b0 01cd 0000 0004 c0a8 0101 0000 ffff 0103 ................
0x00c0 03c0 a801 cdc0 a801 0100 0000 0005 07e2 ................
0x00d0 0000 014a bc93 8432 0000 0224 0000 0000 ...J...2...$....
0x00e0 0000 014a bc93 8432 0017 0850 c0a8 01cd ...J...2...P....
0x00f0 0000 0004 c0a8 0101 0000 ffff 0103 03c0 ................
0x0100 a801 cdc0 a801 0100 0000 0002 07e2 0000 ................
0x0110 014a bc93 8432 0000 0224 0000 0000 0000 .J...2...$......
0x0120 014a bc93 8432 0100 0068 0017 0851 c0a8 .J...2...h...Q..
0x0130 0159 eede 0004 ac12 6c2b 0035 0008 1100 .Y......l+.5....
0x0140 000a 756e 24ac 126c 2bee de00 3501 0000 ..un$..l+...5...
0x0150 0000 014a bc93 8568 0000 014a bc93 8568 ...J...h...J...h
0x0160 433a 1af1 2bc0 c8ca 0000 0000 0000 0000 C:..+...........
0x0170 0000 0000 0000 0000 0000 0000 0000 0000 ................
0x0180 0000 0000 0000 0000 0000 0000 0000 0107 ................
0x0190 00c0 0017 0851 c0a8 0159 eede 0004 ac12 .....Q...Y......
0x01a0 6c2b 0035 0008 1100 000a 756e 24ac 126c l+.5......un$..l
0x01b0 2bee de00 3505 07e2 0000 014a bc93 8586 +...5......J....
0x01c0 0000 0020 0000 0127 0000 014a bc93 8568 ... ...'...J...h
0x01d0 0017 0851 c0a8 0159 eede 0004 ac12 6c2b ...Q...Y......l+
0x01e0 0035 0008 1100 000a 756e 24ac 126c 2bee .5......un$..l+.
0x01f0 de00 3502 07e2 0000 014a bc93 8586 0000 ..5......J......
0x0200 0020 0000 0127 0000 014a bc93 8568 0017 . ...'...J...h..
0x0210 081d c0a8 0182 d751 0004 4a7d 8965 01bb .......Q..J}.e..
0x0220 0003 0600 00ae 6359 0c4a 7d89 65d7 5101 ......cY.J}.e.Q.
0x0230 bb05 0000 0000 014a bc93 86c6 0000 0a3b .......J.......;
0x0240 0000 0352 0000 014a bc92 94d6 0000 0100 ...R...J........
0x0250 0068 0017 0852 c0a8 0185 cc0f 0004 0c95 .h...R..........
0x0260 da49 01bb 0003 0600 00ae 6359 0c0c 95da .I........cY....
0x0270 49cc 0f01 bb01 0000 0000 014a bc93 92b0 I..........J....
0x0280 0000 014a bc93 92b0 433a 1af1 2bc0 c8ca ...J....C:..+...
0x0290 0000 0000 0000 0000 0000 0000 0000 0000 ................
0x02a0 0000 0000 0000 0000 0000 0000 0000 0000 ................
0x02b0 0000 0000 0000 0107 00fc 0017 0852 c0a8 .............R..
0x02c0 0185 cc0f 0004 0c95 da49 01bb 0003 0600 .........I......
0x02d0 00ae 6359 0c0c 95da 49cc 0f01 bb05 07ed ..cY....I.......
0x02e0 0000 014a bc93 9364 0000 0034 0000 0034 ...J...d...4...4
0x02f0 0000 014a bc93 92b0 0017 0852 c0a8 0185 ...J.......R....
0x0300 cc0f 0004 0c95 da49 01bb 0003 0600 00ae .......I........
0x0310 6359 0c0c 95da 49cc 0f01 bb02 07ed 0000 cY....I.........
0x0320 014a bc93 9364 0000 0034 0000 0034 0000 .J...d...4...4..
0x0330 014a bc93 92b0 0017 07f0 c0a8 01cc 007b .J.............{
0x0340 0004 c63c 16f0 007b 0003 1100 00ae 6359 ...<...{......cY
0x0350 0cc6 3c16 f000 7b00 7b05 07eb 0000 014a ..<...{.{......J
0x0360 bc93 9788 0000 0000 0000 0000 0000 014a ...............J
0x0370 bc92 acdc 0017 07f0 c0a8 01cc 007b 0004 .............{..
0x0380 c63c 16f0 007b 0003 1100 00ae 6359 0cc6 .<...{......cY..
0x0390 3c16 f000 7b00 7b02 07eb 0000 014a bc93 <...{.{......J..
0x03a0 9788 0000 0030 0000 0030 0000 014a bc91 .....0...0...J..
0x03b0 bbf0
<output omitted>
Note
For more information about the Cisco ASA capture command, see http://www.cisco.com/c/en/us/td/docs/security/asa/asa-command-reference/A-H/cmdref1/c1.html#pgfId-2147322.
Clearly, the Cisco ASA is sending the NetFlow packets to the NetFlow collector correctly. After reviewing the output of all the aforementioned commands, the network administrator logs in to the NetFlow collector (ELK server) and notices that its logstash NetFlow configuration file (logstash-netflow.conf in this example) was configured incorrectly. It had 10.1.1.1 for the NetFlow source instead of the Cisco ASA management interface IP address. The highlighted line in Example 7-49 shows the entry in the logstash-netflow.conf file that was configured incorrectly.
Example 7-49 Incorrectly Configured Logstash-netflow.conf file
input {
udp {
port => 9901
codec => netflow {
definitions => "/home/administrator/logstash-1.4.2/lib/logstash/codecs/
netflow/netflow.yaml"
versions => [9]
}
}
}
output {
stdout { codec => rubydebug }
if ( [host] =~ "10.1.1.1" ) {
elasticsearch {
index => "logstash_netflow5-%{+YYYY.MM.dd}"
host => "localhost"
}
} else {
elasticsearch {
index => "logstash-%{+YYYY.MM.dd}"
host => "localhost"
}
}
}
When troubleshooting NetFlow communication problems in the Cisco ASA, basic troubleshooting tools such as the capture command and other simple show commands can save you hours of troubleshooting. These are considered the “Swiss army knives” that can help during the troubleshooting of many communication and IP connectivity issues in the Cisco ASA.
Troubleshooting NetFlow in the Cisco NetFlow Generation Appliance
This section provides information about several commands that can prove useful when troubleshooting problems in the Cisco NetFlow Generation Appliance (NGA).
Gathering Information About Configured NGA Managed Devices
A managed device is a device that replicates network packets to the Cisco NGA data ports for monitoring and producing NetFlow packets to collector devices. For example, a Cisco NGA data port can be connected to a different managed device, such as a Cisco Nexus series switch. The NGA downloads internal information about the switch (managed device), so it can populate the input and output interface for flow records that are sent to collectors.
Note
If no managed device is configured for a particular data port, the NGA populates the input and output interface fields in flow records with a value corresponding to its own local data port on which the flow was received.
To view the details about the configured managed devices, use the show managed-device command, as shown in Example 7-50.
Example 7-50 show managed-Device Command Output
[email protected]# show managed-device
Managed Device: 10.1.1.10
ID: 1
Username: md-user
Dataport: 2,4
In Example 7-50, the IP address of the configured managed device is 10.1.1.10. The ID is the identifier of the managed device; in this case, the managed device ID is 1. The username used to communicate to the managed device is md-user and the data ports are 2 and 4.
Note
The data ports are configured with the dataport ports command. These are the data ports where NGA is receiving network traffic from the managed device. Each ports is a comma-separated string (for example, 2,4 for data port 2 and data port 4).
Gathering Information About the Flow Collector
You can obtain information about the configured flow collector using the show flow collector command. Before we review that command, let us look at all the options of the show flow command, as shown in Example 7-51.
Example 7-51 show flow Command Options
[email protected]# show flow ?
collector - Show flow collector
exporter - Show flow exporter
filter - Show flow filter
monitor - Show flow monitor
record - Show flow record
sampling - Show flow sampling information received at data ports
You can use the show flow command to display information about the following:
![]() All the configured collectors in the NGA
All the configured collectors in the NGA
![]() The configured exporter
The configured exporter
![]() Any flow filters configured in the device
Any flow filters configured in the device
![]() Information about the configured flow monitor
Information about the configured flow monitor
![]() Information about configured flow records
Information about configured flow records
![]() NetFlow sampling information received at any of the data ports
NetFlow sampling information received at any of the data ports
To display and analyze information about the flow collectors configured in the system, you can use the show flow collector command, as demonstrated in Example 7-52.
Example 7-52 show flow collector Command Output
[email protected]# show flow collector
Collector name: rtp-collector-1
Description:
IP address: 172.18.104.179
DSCP value: 0
Transport: UDP
Port number: 9995
Collector name: rtp-collector-2
Description:
IP address: 172.18.104.180
DSCP value: 0
Transport: UDP
Port number: 9995
[email protected]#
In Example 7-52, two flow collectors are configured (rtp-collector-1 and rtp-collector-2). The IP address of rtp-collector-1 is 172.18.104.179, and the IP address of rtp-collector-2 is 172.18.104.180. Both are configured to communicate using UDP port 9995.
Gathering Information About the Flow Exporter
The flow exporter name command is used to specify various parameters for an export session between the Cisco NGA and one or more collectors that the exporter will use to send NetFlow packets. The Cisco NGA flow exporter includes parameters such as the following:
![]() The version format of NetFlow packets to be sent
The version format of NetFlow packets to be sent
![]() How frequent the exporter sends template and option data
How frequent the exporter sends template and option data
![]() Destination name and a description of the exporter
Destination name and a description of the exporter
You can use the show flow exporter command to view and analyze the flow exporter configuration in the Cisco NGA, as shown in Example 7-53.
Example 7-53 show flow exporter Command Output
[email protected]# show flow exporter rtp-exporter
Exporter name: rtp-exporter
Description: Exporter in RTP NGA
Export version: v9
Template timeout: 20 minutes
Options timeout: 30 minutes
Policy: Multi-destination
Destination name: rtp-collector-1
In Example 7-53, the exporter name is rtp-exporter. The exporter is configured to export NetFlow Version 9 packets. The template timeout is set to 20 minutes, and the options timeout is set to 30 minutes. The policy is set to multi-destination.
Note
When the exporter policy is configured to multi-destination, the exporter sends the same NetFlow packet to all collectors set in the exporter. When the exporter policy is configured as a policy weighted-round-robin, the Cisco NGA load balances the NetFlow packets among collectors set in the exporter.
In this example, the destination name is rtp-collector-1.
Gathering Information About Flow Records
To gather information about specific flow records, you can use the show flow record command, as shown in Example 7-54.
Example 7-54 show flow record Command Output
[email protected]# show flow record rtp-record-1
Record name: rtp-record-1
Record type: IPv4
Record description: RTP record example 1
Number of match fields: 10
Match field: MAC source address
Match field: MAC destination address
Match field: Ethertype field
Match field: Input Interface
Match field: Output Interface
Match field: IPv4 destination address
Match field: IPv4 source address
Match field: IP protocol
Match field: Destination port
Match field: Source port
Number of collect fields: 7
Collect field: Packet count
Collect field: Byte count
Collect field: Maximum TTL/hop limit
Collect field: Minimum TTL/hop limit
Collect field: First timestamp
Collect field: Last timestamp
Collect field: TCP header flags
[email protected]#
As you can see in Example 7-54, the show flow record command displays the following information:
![]() The flow record name (rtp-record-1 in this example)
The flow record name (rtp-record-1 in this example)
![]() The flow record type (IPv4 in this example)
The flow record type (IPv4 in this example)
![]() The flow record description entered by the administrator
The flow record description entered by the administrator
![]() The number of match fields configured for such flow record (10 in this example)
The number of match fields configured for such flow record (10 in this example)
![]() The actual match fields
The actual match fields
![]() The number of collect fields configured for the flow record (7 in this example)
The number of collect fields configured for the flow record (7 in this example)
![]() The actual collect fields
The actual collect fields
Gathering Information About the Flow Monitor
In the Cisco NGA, the flow monitor is a conceptual device that takes network traffic from data ports and generates flow records based on parameters configured at the flow exporter and flow monitor. It subsequently sends the flow information to the exporter, which can apply filter rules, packs the flow records into NetFlow packets, and sends the NetFlow packets to collectors.
The Cisco NGA supports up to four active flow monitors and up to six flow collectors. You can use the show flow exporter command to display and analyze information about the configured flow monitor, as shown in Example 7-55.
Example 7-55 show flow monitor Command Output
[email protected]# show flow monitor rtp-monitor
Monitor name: rtp-monitor
Description:
Exporter name: example-exporter
Record name: example-record
Dataport: 2,3
Tunnel: Inner
Cache size: 40 %
Cache type: Standard
Cache active timeout: 1800 seconds
Cache inactive timeout: 15 seconds
Cache session timeout: Disabled
Monitor Status: Inactive
[email protected]#
Show Tech-Support
As in other Cisco devices such as Cisco IOS, Cisco IOS-XE, Cisco IOS-XR, Cisco NX-OS, and Cisco ASA, the Cisco NGA has its own version of the show tech-support command (show tech for short). This is the most comprehensive show command that is used for low-level troubleshooting in the Cisco NGA. The show tech command includes numerous device statistics, logs, and low-level information that can be useful for advanced users and for Cisco’s Technical Assistance Center (TAC).
Example 7-56 includes a short snippet of the show tech command.
Example 7-56 show tech Command Output
[email protected]# show tech-support
! NTP Server Configuration
! In this example two NTP servers are configured
NGA synchronize time to: NTP
NTP server1: 10.1.2.161
NTP server2: 10.1.2.162
NGA time zone:
Current system time: Sun Jul 26 16:58:46 UTC 2015
! The version of the NGA appliance. In this example, no patches have been
! installed on the system.
NGA application image version: 1.0(2) RELEASE SOFTWARE [fc2]
Product Id: NGA3240-K9
Disk 0 size: 999 GB
Disk 1 size: 3 GB
Installed patches:
No patches are installed on this system.
! IP address, DNS server, HTTP server, TACACS+, Telnet and SSH configuration
information
IP address: 10.1.1.215
Subnet mask: 255.255.255.0
IP Broadcast: 10.1.1.55
DNS Name: rtp-nga.cisco.com
Default Gateway: 10.1.1.1
Nameserver(s): 144.254.254.254
HTTP server: Disabled
HTTP secure server: Enabled
HTTP port: 80
HTTP secure port: 443
TACACS+ configured: No
Telnet: Disabled
SSH: Enabled
! IP address, DNS server, HTTP
SNMP Agent: rtp-snmp-02.cisco.com 10.1.5.14
SNMPv1: Enabled
SNMPv2C: Enabled
! Detailed file system and low level process information
sysDescr Cisco NetFlow Generation Appliance (NGA3240-K9), Version 1.0(2)
RELEASE SOFTWARE [fc2]
Compiled Oct 29 2012 19:50:40
Copyright (c) 2012 by Cisco Systems, Inc.
sysObjectID enterprises.9.1.1539
sysContact
sysName
sysLocation
NAM_TARGET=NFA_X520
NAM_TARGET_ID=13
MP=no
NAM_PROD_NO=NFA_X520
NAM_PROD_DESCR="Cisco NetFlow Generation Appliance (NFA_X520)"
NAM_VERSION="1.0(2) RELEASE SOFTWARE [fc2]"
NFA_MODEL=NGA3240-K9
NAM_PID=NGA3240-K9
NAM_SN=FCH1825V223
NAM_VID=V01
MEGARAID=1
NAM_LOCAL_DISK=/dev/sda
NAM_ROOT_PARTITION=/dev/sda1
NAM_NVRAM_PARTITION=/dev/sda2
NAM_STORAGE1_PARTITION=/dev/sda3
NAM_STORAGE_PARTITION=/dev/sda3
NAM_DISK=1002GB
NAM_DISK0=999GB
NAM_DISK1=3GB
PID TTY STAT TIME COMMAND
1 ? Ss 0:25 init [3]
2 ? S 1:29 [kthreadd]
2619 ? S<s 0:00 udevd --daemon
4694 ? Ss 0:00 /sbin/syslogd
4702 ? Ss 0:00 /sbin/klogd -x -c 4
4716 ? Ss 0:00 /usr/sbin/inetd
4723 ? Ss 0:00 /usr/sbin/sshd
4757 ? Ss 0:00 /usr/sbin/ntpd -u 102:102 -c /etc/ntp.conf
4768 ? Ssl 0:01 /usr/sbin/nscd
4832 ? Ss 0:00 /usr/sbin/atd
4852 ? Ss 0:00 /usr/sbin/cron
4862 ? Ssl 1105:26 /usr/local/nam/bin/mond -d
4864 ? Ss 0:00 /usr/local/nam/bin/devconfd
4866 ? S 0:00 /bin/bash /usr/local/nam/bin/rd_wd
4877 ? Ss 0:00 /usr/local/nam/bin/configd
4879 pts/0 Ss+ 0:00 /usr/local/nam/bin/cli -n
4882 ? Ssl 0:00 /usr/local/nam/bin/dmand/dmand
4888 tty1 Ss+ 0:00 /sbin/getty 38400 tty1
4889 tty2 Ss+ 0:00 /sbin/getty 38400 tty2
4891 ttyS1 Ss+ 0:00 /sbin/getty -L ttyS1 9600 vt100
5062 ttyS0 Ss+ 0:00 /sbin/getty -L ttyS0 9600 vt100
5106 ? Ss 0:11 /usr/local/apache/bin/httpd -DSSL -k start
5107 ? S 0:00 /usr/local/apache/bin/httpd -DSSL -k start
5108 ? S 0:00 /usr/local/apache/bin/httpd -DSSL -k start
5109 ? S 0:00 /usr/local/apache/bin/httpd -DSSL -k start
5110 ? S 0:00 /usr/local/apache/bin/httpd -DSSL -k start
5111 ? S 0:00 /usr/local/apache/bin/httpd -DSSL -k start
5121 ? S 0:00 /usr/local/apache/bin/httpd -DSSL -k start
5125 ? S 0:00 /usr/local/apache/bin/httpd -DSSL -k start
5126 ? S 0:00 /usr/local/apache/bin/httpd -DSSL -k start
5127 ? S 0:00 /usr/local/apache/bin/httpd -DSSL -k start
5170 ? S 0:00 /usr/local/apache/bin/httpd -DSSL -k start
10683 ? S 0:00 sleep 2m
10684 ? Ss 0:00 sshd: root@pts/1
10688 pts/1 Ss+ 0:00 -cli
10713 pts/1 R+ 0:00 /bin/ps ax
! Underlying Linux IP configuration information
Address HWtype HWaddress Flags Mask Iface
10.203.5.193 ether 00:00:0c:9f:f3:88 C eth0
eth0 Link encap:Ethernet HWaddr 1C:6A:7A:18:11:00
inet addr:10.203.5.215 Bcast:10.203.5.223 Mask:255.255.255.224
UP BROADCAST RUNNING MULTICAST MTU:1500 Metric:1
RX packets:146408 errors:0 dropped:0 overruns:0 frame:0
TX packets:481794 errors:0 dropped:0 overruns:0 carrier:0
collisions:0 txqueuelen:1000
RX bytes:42372760 (40.4 MiB) TX bytes:654152312 (623.8 MiB)
eth1 Link encap:Ethernet HWaddr 1C:6A:7A:18:11:01
BROADCAST MULTICAST MTU:1500 Metric:1
RX packets:0 errors:0 dropped:0 overruns:0 frame:0
TX packets:0 errors:0 dropped:0 overruns:0 carrier:0
collisions:0 txqueuelen:1000
RX bytes:0 (0.0 b) TX bytes:0 (0.0 b)
eth2 Link encap:Ethernet HWaddr 90:E2:BA:70:FF:28
UP BROADCAST RUNNING PROMISC MULTICAST MTU:1500 Metric:1
RX packets:0 errors:0 dropped:0 overruns:0 frame:0
TX packets:0 errors:0 dropped:0 overruns:0 carrier:0
collisions:0 txqueuelen:1000
RX bytes:0 (0.0 b) TX bytes:0 (0.0 b)
eth3 Link encap:Ethernet HWaddr 90:E2:BA:70:FF:29
UP BROADCAST RUNNING PROMISC MULTICAST MTU:1500 Metric:1
RX packets:0 errors:0 dropped:0 overruns:0 frame:0
TX packets:0 errors:0 dropped:0 overruns:0 carrier:0
collisions:0 txqueuelen:1000
RX bytes:0 (0.0 b) TX bytes:0 (0.0 b)
eth4 Link encap:Ethernet HWaddr 90:E2:BA:70:FE:D8
UP BROADCAST RUNNING PROMISC MULTICAST MTU:1500 Metric:1
RX packets:0 errors:0 dropped:0 overruns:0 frame:0
TX packets:0 errors:0 dropped:0 overruns:0 carrier:0
collisions:0 txqueuelen:1000
RX bytes:0 (0.0 b) TX bytes:0 (0.0 b)
eth5 Link encap:Ethernet HWaddr 90:E2:BA:70:FE:D9
UP BROADCAST RUNNING PROMISC MULTICAST MTU:1500 Metric:1
RX packets:0 errors:0 dropped:0 overruns:0 frame:0
TX packets:0 errors:0 dropped:0 overruns:0 carrier:0
collisions:0 txqueuelen:1000
RX bytes:0 (0.0 b) TX bytes:0 (0.0 b)
lo Link encap:Local Loopback
inet addr:127.0.0.1 Mask:255.255.255.255
UP LOOPBACK RUNNING MTU:16436 Metric:1
RX packets:7122 errors:0 dropped:0 overruns:0 frame:0
TX packets:7122 errors:0 dropped:0 overruns:0 carrier:0
collisions:0 txqueuelen:0
RX bytes:732348 (715.1 KiB) TX bytes:732348 (715.1 KiB)
! Active connection information (similar to the output of the netstat Linux command.
Active Internet connections (servers and established)
Proto Recv-Q Send-Q Local Address Foreign Address State
tcp 0 0 *:ssh *:* LISTEN
tcp 0 0 localhost:9911 *:* LISTEN
tcp 0 0 *:telnet *:* LISTEN
tcp 0 0 localhost:9914 *:* LISTEN
tcp 0 0 *:https *:* LISTEN
tcp 0 0 localhost:46147 localhost:9911 ESTABLISHED
tcp 0 0 localhost:38998 localhost:9911 ESTABLISHED
tcp 0 0 localhost:9911 localhost:46150 ESTABLISHED
tcp 0 0 localhost:46145 localhost:9911 ESTABLISHED
tcp 0 0 localhost:46150 localhost:9911 ESTABLISHED
tcp 0 0 localhost:676 localhost:9911 TIME_WAIT
tcp 0 0 localhost:46148 localhost:9911 ESTABLISHED
tcp 0 0 localhost:9911 localhost:46145 ESTABLISHED
tcp 0 0 localhost:9911 localhost:38998 ESTABLISHED
tcp 0 0 localhost:46149 localhost:9911 ESTABLISHED
tcp 0 0 localhost:9911 localhost:46147 ESTABLISHED
tcp 0 236 localhost:9911 localhost:688 ESTABLISHED
tcp 0 0 localhost:9911 localhost:46148 ESTABLISHED
tcp 0 0 localhost:9911 localhost:60524 ESTABLISHED
tcp 0 0 localhost:60525 localhost:9911 ESTABLISHED
tcp 0 0 localhost:9911 localhost:46149 ESTABLISHED
tcp 0 0 localhost:688 localhost:9911 ESTABLISHED
tcp 0 0 localhost:9911 localhost:60525 ESTABLISHED
tcp 0 0 localhost:60524 localhost:9911 ESTABLISHED
tcp 0 0 localhost:9911 localhost:46146 ESTABLISHED
tcp 0 0 localhost:46146 localhost:9911 ESTABLISHED
udp 0 0 mel-csxpod1-nga-02.cisc:ntp *:*
udp 0 0 localhost:ntp *:*
udp 0 0 *:ntp *:*
udp 0 0 *:snmp *:*
udp 0 0 *:41812 *:*
udp 0 0 *:53497 *:*
udp 0 0 *:57775 *:*
Active UNIX domain sockets (servers and established)
Proto RefCnt Flags Type State I-Node Path
unix 14 [ ] DGRAM 6027 /dev/log
unix 2 [ ACC ] STREAM LISTENING 6218 /var/run/nscd/socket
unix 2 [ ] DGRAM 16414 /usr/local/nam/bin/
devconfd_ipc_path
unix 2 [ ] DGRAM 357 @/org/kernel/udev/udevd
unix 2 [ ] DGRAM 25326
unix 2 [ ] DGRAM 24940
unix 2 [ ] DGRAM 15781
unix 2 [ ] DGRAM 1551
unix 2 [ ] DGRAM 15758
unix 2 [ ] DGRAM 2835
unix 2 [ ] DGRAM 2766
unix 2 [ ] DGRAM 6231
unix 2 [ ] DGRAM 15686
unix 2 [ ] DGRAM 6088
unix 2 [ ] DGRAM 6058
unix 2 [ ] DGRAM 6028
Active IPX sockets
Proto Recv-Q Send-Q Local Address Foreign Address
State
Linux mel-csxpod1-nga-02.cisco.com 3.0.0-nam #1 SMP PREEMPT Fri Jul 13 14:04:48 PDT
2012 x86_64 GNU/Linux
queue 0: rc=32768, rs=524288, bs=134217728 (order 9)
niantic_data_rx_resources: adapter 3, queue 0 (48): allocated 32768 pkts.
niantic_data_rx_resources: adapter 3, queue 1: rc=32768, rs=524288, bs=134217728
(order 9)
niantic_data_rx_resources: adapter 3, queue 1 (49): allocated 32768 pkts.
...
<and many many more logs>
As you can see in Example 7-56, the show tech command is very comprehensive, including tons of information that can be useful to troubleshoot installation, configuration, and communication issues in the Cisco NGA.
Additional Useful NGA show Commands
The following are several additional show commands that can prove useful when troubleshooting problems in the Cisco NGA:
![]() show audit-trail: Used to show the status of audit trail.
show audit-trail: Used to show the status of audit trail.
![]() show cache statistics cumulative monitor_name: Used to show statistic information at the internal cache level from processing network traffic received at NGA data ports.
show cache statistics cumulative monitor_name: Used to show statistic information at the internal cache level from processing network traffic received at NGA data ports.
![]() show cache statistics rates monitor_name: Displays flow stats information at the internal cache level with rate derived from the last minute.
show cache statistics rates monitor_name: Displays flow stats information at the internal cache level with rate derived from the last minute.
![]() show cdp settings: Displays Cisco Discovery Protocol (CDP) settings.
show cdp settings: Displays Cisco Discovery Protocol (CDP) settings.
![]() show collector statistics collector_name: Displays flow statistics at the flow collector level, both cumulative and last-minute rates. This displays how many packets and flows have been sent to each collector.
show collector statistics collector_name: Displays flow statistics at the flow collector level, both cumulative and last-minute rates. This displays how many packets and flows have been sent to each collector.
![]() show dataport statistics cumulative: Displays statistics at the data port level where network traffic arrives at NGA for processing.
show dataport statistics cumulative: Displays statistics at the data port level where network traffic arrives at NGA for processing.
![]() show dataport statistics rates: Displays statistics at the data port level with rates computed for the last minute.
show dataport statistics rates: Displays statistics at the data port level with rates computed for the last minute.
![]() show dataport statistics rates queues: Displays how balanced packets are at each data port queues. Generally, queues at the data ports should be fairly balanced for the best performance.
show dataport statistics rates queues: Displays how balanced packets are at each data port queues. Generally, queues at the data ports should be fairly balanced for the best performance.
![]() show exporter statistics exporter_name: Displays flow statistics at the flow exporter level.
show exporter statistics exporter_name: Displays flow statistics at the flow exporter level.
![]() show flow filter filter_name: Displays all flow filters configured in the system.
show flow filter filter_name: Displays all flow filters configured in the system.
![]() show inventory: Displays the product ID and serial number of NGA device.
show inventory: Displays the product ID and serial number of NGA device.
![]() show ip: Displays IP network settings.
show ip: Displays IP network settings.
![]() show log config: Displays logging of configuration done via config network ftp-url command.
show log config: Displays logging of configuration done via config network ftp-url command.
![]() show log patch: Displays logging results from patch commands.
show log patch: Displays logging results from patch commands.
![]() show log upgrade: Displays logging results from upgrade commands.
show log upgrade: Displays logging results from upgrade commands.
![]() show patches: Displays all patches that have been installed in the system.
show patches: Displays all patches that have been installed in the system.
![]() show snmp: Displays SNMP settings in the system.
show snmp: Displays SNMP settings in the system.
Summary
In this chapter, you learned many different commands, debugs, and tools that are useful when troubleshooting NetFlow problems in Cisco IOS, Cisco IOS-XE, Cisco NX-OS, and Cisco IOS-XR devices, as well as in the Cisco ASA 5500-X series Next-Generation Firewalls and the Cisco NetFlow Generation Appliances. The first step in understanding what show commands to use is to become familiar with them even during normal operations. Also, determine what debug commands to use by using them with caution. In the beginning of this chapter, several tips and information about debug commands were provided as a general guidance when using these types of commands.