
Neutrosophic hough transform for blood cells nuclei detection
Amira S. Ashour*; Yanhui Guo†; Ahmed Refaat Hawas* * Department of Electronics and Electrical Communications Engineering, Faculty of Engineering, Tanta University, Tanta, Egypt
† Department of Computer Science, University of Illinois at Springfield, Springfield, IL, United States
Abstract
Automatic blood cell (BCs) detection and nuclei detection are still challenging tasks in medical microscopic imaging systems due to their embedding in the cluttered and intricate smear. Because the BCs have an ellipsoid/circular shape, a circular Hough transform (HT) shape detector was proposed based on a neutrosophic set to extract the descriptive features of BC circular shapes in microscopic images. First, the Canny edge detector was employed to detect the edges in the microscopic image to form an edge image for further use of the HT to detect the BC. Afterward, the Hough transformed image was mapped in the neutrosophic set (NS) domain followed by the k-means clustering method to detect the nuclei within the BC images. Thus, the proposed method of two phases is called Hough transform with neutrosophic k-means (HNK) nuclei detection. The experimental results established the superiority of the proposed HNK compared to the classic HT with k-means without NS on 50 BC images in terms of the JAC, dice, sensitivity, specificity, and accuracy; it achieved 87%, 93%, 95%, 99%, and 98%, respectively.
Keywords
Canny detector; Hough transform; Neutrosophic set; k-means; Objects detection; Shape detection; Blood cells; Nuclei
1 Introduction
Microscopic images of the blood smear are regularly examined by hematologists for diagnosing blood disorders and diseases. These disorders indicate different diseases, which are mostly related to white blood cells (WBCs). Detection, recognition, and classification of blood cells and their diverse types have an excessive role in laboratory tests and the clinical diagnosis of blood diseases (Campo et al., 2011; Mohr & Liew, 2007; Ross et al., 2003; Yeoh et al., 2002). The main cell types include red cells, white cells (leukocyte), and blood platelets. The WBCs contain the cytoplasm and nucleus, where they include five categories: eosinophil, neutrophil, monocyte, lymphocyte, and basophil (Hiremath, Bannigidad, & Geeta, 2010). The nucleus is considered the core of WBCs and contain chromosomes, chromatin, and nucleolus. The cell's nucleus has significant features in the identification of the cell's type. Thus, to distinguish between the cytoplasm and nucleus of the WBC, the color, texture, morphology, and size are observed/measured. For diagnosing different blood diseases, blood tests are conducted by laboratory experts to investigate the blood samples under the microscope. These blood tests can be used for diagnosing different diseases as well as investigating the functionality of different body organs, such as the liver, thyroid, and kidney (Grimm, Neaton, & Ludwig, 1985; Hari, Prasad, & Rao, 2014; Hore et al., 2015; Neugebauer, Clement, Bocklitz, Krafft, & Popp, 2010; Padmanabhan et al., 2009; Piuri & Scotti, 2004; Shim et al., 2006; Yu et al., 2013). However, dissimilar kinds of blood smears may lead to inaccurate quantitative/qualitative information.
Traditional microscopic visual morphological inspection by the hematology experts is a tedious, inaccurate, expensive, and time-consuming task (Dey, Ashour, Ashour, & Singh, 2015; Mohapatra, Samanta, Patra, & Satpathi, 2011; Nazlibilek et al., 2014; Ongun et al., 2001a, 2001b; Poomcokrak & Neatpisarnvanit, 2008; Savkare & Narote, 2012; Suradkar, 2013; Terstappen & Loken, 1988; Theera-Umpon, 2005; Wu, Mei, & Lo, 2012). Moreover, the BCs have different types and subtypes that have a different shape and color, along with the different staining methods that also affect the appearance of the BC in the microscope sample. Consequently, several researchers have developed automated techniques for blood cell (BS) detection, counting, and classification (Allard et al., 2004; Angulo & Flandrin, 2003; Bacus & Weens, 1977; Bandekar, Wong, Clausi, & Gorbet, 2011; Di Ruberto, Dempster, Khan, & Jarra, 2002; Ghosh, Bhattacharjee, & Nasipuri, 2016; Guo, Zeng, & Wu, 2007; Habibzadeh, Krzyżak, & Fevens, 2013; Karunakar & Kuwadekar, 2011; Khan & Maruf, 2013; Nilsson & Heyden, 2005; Peltola, Toikka, Irjala, Mertsola, & Ruuskanen, 2007; Putzu & Di Ruberto, 2013; Rezatofighi & Soltanian-Zadeh, 2011; Riethdorf et al., 2007; Roy, Jin, Seo, Nam, & Seo, 2014; Savkare & Narote, 2011; Yang et al., 2004). Theera-Umpon (2005) proposed a fuzzy C-means procedure with morphological operations for segmenting the cytoplasm and nucleus of bone marrow WBC. Wang et al. (2007) identified the cell cycle stages in the images captured using time-lapse microscopy by detecting the cells using their shape and intensity information. Then, an online support vector machine (SVM) classifier was applied for cell staging identification.
Madhloom et al. (2010) implemented localization and segmentation of WBC nuclei. For separating the nucleus from the entire cell body, nucleus segmentation was applied using contrast stretching along with minimum filter, image arithmetic operation, and global threshold methods. This method achieved 85%–98% accuracy. Sinha and Ramakrishnan (2003) designed a blood cell counting method on the hue, saturation, and value (HSV) color space using a k-means clustering procedure for WBC segmentation for further cell categorization using the classification process. In this method, the texture, color, and shape features were extracted from the segmented nucleus and cytoplasm. In digital microscopic images, Hiremath et al. (2010) developed an automated method for identifying and classifying the WBCs, namely neutrophils, monocytes, and lymphocytes. A color-based segmentation scheme was applied with extracting geometric features from the segmented image to identify the different WBC types.
Markiewicz, Osowski, Marianska, and Moszczynski (2005) applied the SVM for automatic identification of the leukemia blast cells, where geometrical and texture features of the BCs were extracted. Othman and Ali (2014) isolated the leukocytes (WBCs) in the macroscopic images by segmentation and feature extraction using the shape feature moment. Prinyakupt and Pluempitiwiriyawej (2015) segmented the WBCs using thresholding, morphological properties, and ellipse curve fitting. Then, the feature extraction process was conducted on the segmented cytoplasm and nucleus regions followed by the sequential forward selection method using a greedy search algorithm to select the dominant features. Finally, naïve Bayes and linear classifiers were used in classification. Bergen, Steckhan, Wittenberg, and Zerfass (2008) localized erythrocytes in the BCs by combining pixel-wise classification with template matching, and then used the level-set method to extract the contours of the nucleus in the WBC regions. Mohamed, Far, and Guaily (2012) segmented BC images after enhancement using gray-scale contrast for automatic blood cell nuclei segmentation, where false objects were removed by determining the minimum size. Another method for WBC nucleus segmentation was proposed by Rezatofighi, Soltanian-Zadeh, Sharifian, and Zoroofi (2009) using the orthogonality theory and the Gram-Schmidt procedure.
Furthermore, Amin, Kermani, Talebi, and Oghli (2015) segmented cell nuclei from bone marrow and blood smears of normal individuals and acute lymphoblastic leukemia patients using a k-means algorithm. Afterward, from the segmented nuclei, statistical/geometric features were extracted for further classification to noncancerous or cancerous cells using a support vector machine. Ghosh, Das, Chakraborty, and Ray (2010) recognized the leukocyte using modified thresholding methods and fuzzy divergence. The nuclei were segmented using Cauchy, Gaussian, and Gamma distribution fuzzy membership functions for the image pixels. The results established the efficiency of using the Cauchy membership function for segmentation.
For malaria diagnosis, an automatic counting of infected RBCs was performed by Moallem et al. (2017) based on image segmentation and machine-learning methods. A preprocessing stage was employed to remove the WBCs using a WBC segmentation method based on the Chan-Vese level-set procedure for eliminating the boundaries of each WBC in the image. For each WBC, Dorini, Minetto, and Leite (2013) segmented the nucleus as well as the cytoplasm using the self-dual multiscale morphological toggle method for contour regularization. Then, a watershed transform was applied for boundary estimation of the nucleus. Afterward, cytoplasm region detection was performed using morphological transformations and granulometric analysis.
Moreover, for WBC segmentation, Li, Zhu, Mi, Cao, and Yao (2016) implemented a dual-threshold technique on a combination of HSV and RGB color spaces of the microscopic image. In the proposed dual-threshold procedure, the H component from the HSV color space image and the contrast stretch of the image's gray version were used to determine the optimal thresholds. Afterward, median filtering and morphological operations were employed for denoising. For the cytoplasm and nucleus of WBCs, a segmentation method was implemented by Zhang et al. (2014) by combining adjusted color space decomposition and k-means clustering.
Fatichah, Tangel, Widyanto, Dong, and Hirota (2012) proposed a self-supervised learning method based on initial unsupervised segmentation using a k-means approach to extract the foreground regions on the microscopic cell image followed by supervised segmentation refinement to train the SVM classifier for classifying each pixel of the image. Median color features were used to represent the topological structure. In addition, a weak edge enhancement operator was used to handle the fuzzy boundaries and to improve the segmentation accuracy. The Hough transform was employed by Cao, Zhong, Li, and Dong (2009) for detecting and localizing the red BCs (RBCs) in urine images. A Sobel operator was used for edge detection followed by the Hough transform for separating the RBC from the background. Then, the principal component analysis (PCA) was used to select the significant features for further classification using the linear discriminant analysis (LDA).
From the preceding extensive study, it is concluded that nucleus segmentation procedures were mainly based on morphological processes while pixel intensity threshold-based methods were employed for segmenting the cytoplasm (Sadeghian, Seman, Ramli, Kahar, & Saripan, 2009). Generally, for WBCs and nuclei segmentation, several approaches used color and feature extraction methods (Reta, Robles, Gonzalez, Diaz, & Guichard, 2010), active contours (Eom, Kim, Shin, & Ahn, 2006), and clustering techniques (Jiang, Liao, & Dai, 2003) while other methods used fuzzy morphological operations (Fatichah, Tangel, Widyanto, Dong, & Hirota, 2012).
Typically, in microscopic images of blood smears, there exist dissimilar shapes and sizes of the different WBC types as well as different texture characteristics of the cytoplasm and different morphological characteristic of the nucleus. Accordingly, in order to detect the nucleus from the microscopic image, a preextraction and detection of the WBC in the image is conducted. Thus, in the current chapter, the Hough transform (HT) was applied as it is considered an effective method for pattern recognition to extract unique features that describe the shapes, including lines, ellipses, and circles, as well as to detect the blood cells in the microscope images. However, the classic HT for circle detection suffers from several limitations, including the required large parameter space and low detection efficiency. In addition, the microscopic images may contain irregular illumination patterns that affect the microscopic image visualization and the detection performance. Moreover, a varied range of staining shades may be introduced during the staining process. All these artifacts lead to complicated segmenting of the WBC and their nuclei in the microscopic images.
Accordingly, the neutrosophic theory can be involved during the detection/segmentation processes to remove/reduce the effect of these artifacts and reduce the fuzziness from the microscopic images being segmented. In the present work, after detecting the WBCs from the background using HT detection of circular shapes, a neutrosophic set (NS) is then employed followed by k-means to detect the nucleus within the previously segmented WBC. Accordingly, the proposed method of HT-based NS with K-means nuclei segmentation is called HNK.
The structure of the remaining sections includes the methodology used in the proposed model in Section 2, followed by the experimental results and discussions in Section 3. Finally, the conclusions of the presented work are presented in Section 4.
2 Methodology
The microscopic image includes WBCs embedded in the blood smear, where the nuclei exist in the WBC. This study implemented a WBC detection procedure based on the circular Hough transform (CHT) with neutrosophic K-means (HNK) in blood cells images. Hence, the present method consists of two phases: the WBC detection phase using a Canny edge detector and the circular HT, and then the nucleus detection phase using the NS and K-means clustering for unsupervised segmentation.
The red channel is used instead of the gray-scale image to maintain image resolution. Also, this channel contains most of the information. The Canny edge operator is used to detect the circular shapes for further accurate circle shape detection using the Hough parameter space, which represents the interested WBC mask. The masked images are then mapped into the NS and that reduces the indeterminacy of the image. Subsequently, the image is segmented using the K-means method for final detection of the nucleus. Finally, the cell/nucleus detection is accomplished by the morphology operation.
2.1 White blood cell detection
Typically, a smooth transition in color exists in the microscopic images between the background and the region of interest. This identifies a low contrast between the WBC and the background. Because almost all the blood cells have elliptical shapes, which can be approximately considered a circular shape, this inspired the proposed method to apply the CHT (Atherton & Kerbyson, 1999; D'Orazio, Guaragnella, Leo, & Distante, 2004; Pedersen, 2007; Smereka & Dulęba, 2008) for detecting WBCs having an approximately circular shape. Additionally, in the present work, the amount of pixels to be processed by CHT was dramatically reduced by using Canny edge detection (Ding & Goshtasby, 2001).
2.1.1 Canny edge detection
The Canny edge detector is an edge detection operator that uses a multistage algorithm to detect a wide range of edges in images. It includes several steps, namely preprocessing for noise reduction using a 5 × 5 Gaussian filter, measuring the gradients to find the intensity gradient in the image, nonmaximum suppression, and thresholding with hysteresis. In the present work, the two key parameters of the Canny detector algorithm are the upper and lower threshold values. The lower threshold value is determined to find the faint pixels that are actually a part of an edge while the upper threshold value is used to determine the mark edges that are definite edges of the WBC.
2.1.2 Circular Hough transform
The CHT is a specialization of the Hough transform for feature extraction to detect circles. The main purpose of the CHT is to find circles in the image. The circle candidates are produced by voting in the Hough parameter space and then selecting the local maxima. In two-dimensional (2D) space, a circle can be described using the following expression:
where a and b are the coordinates of the circle's center and r is the radius of the circle. If a 2D point (x, y) is fixed, then the CHT parameters can be obtained according to Eq. (1) as follows:
Thus, the parameter space is three-dimensional (3D), namely (a, b, r), where all the parameters that satisfy (x, y) would lie on the surface of an inverted right-angled cone whose apex is at (x, y, 0). Typically, in the parameter space, to find the intersection point, an accumulator matrix is represented. Initially, the parameter space is divided into stacks using a grid. Then, an accumulator matrix is produced based on this grid, where the element in the accumulator matrix represents the number of circles in the parameter space. This number of circles is also called the voting number. Every element in the accumulator matrix is initially set to zero, then in the original space, each edge point can represent a circle in the parameter space and increase the voting number in this voting process. Afterward, in the accumulator matrix, the local maxima are found after voting. The local maxima positions are consistent with the circle centers in the original space. Hence, in the Hough space, a point can define a circle in the image domain; hereafter, an image Q in the image domain is mapped to the Hough space, represented by QHT.
2.2 Nuclei detection
In the preceding process, the CHT was used to detect the WBCs in the microscopic images. Afterward, in order to localize and detect the nucleus that exists inside the detected WBC, another detection process was employed on the QHT image for nucleus detection using NS followed by a clustering-based unsupervised segmentation procedure.
2.2.1 Neutrosophic CHT image
Neutrosophy theory has an outstanding impact for defining the indeterminacy in different information, including images, where the neutrosophic set (NS) is considered one of its methods. Typically, the NS is defined by three membership subsets to specify the truth, indeterminacy, and falsity degrees of T, I, and F, respectively, for every incident in the NS. These membership subsets are employed to map an input image to the NS domain producing the NS image. In the present work, the QHT is transformed into the NS domain to produce the CHT-NS-image QHT′, which can be represented as follows (Guo, Ashour, & Smarandache, 2018; Guo, Ashour, & Sun, 2017):
where THT, IHT and FHT represent the true, indeterminate, and false belonging to the bright pixel set in the Hough transformed image QHT when mapped to the NS domain. Assume W(x, y) and ![]() denote the intensity and the local mean values of the pixel (x, y). Therefore, the three subsets can be given by (Ashour, Guo, Kucukkulahli, Erdogmus, & Polat, 2018):
denote the intensity and the local mean values of the pixel (x, y). Therefore, the three subsets can be given by (Ashour, Guo, Kucukkulahli, Erdogmus, & Polat, 2018):

where β(x, y) is the absolute value ![]() . Accordingly, the value of IHT(x, y) is used to determine the indeterminacy of QHT(x, y). In the NS domain, the element distribution is defined by the NS image entropy as a summation of the entropies of the three subset entropies, which is given by:
. Accordingly, the value of IHT(x, y) is used to determine the indeterminacy of QHT(x, y). In the NS domain, the element distribution is defined by the NS image entropy as a summation of the entropies of the three subset entropies, which is given by:
where the entropies of the three subsets are expressed as follows:


where the three membership subsets, pTHT(i), pIHT(i), and pFHT(i) denote the probabilities of the elements. The deviations in THT and FHT are used to modify the element distribution in the image and the entropy of IHT to modify THT and FHT with IHT. By applying this procedure to the detected WBC image, the nucleus can be detected accurately with the use of the K-means clustering procedure, where K-means clustering has a significant role in different applications.
2.2.2 K-means clustering
The K-means clustering procedure groups the data points into K clusters and defines the center positions of each cluster (Celebi, Kingravi, & Vela, 2013; Kodinariya & Makwana, 2013; Likas, Vlassis, & Verbeek, 2003; Magidson & Vermunt, 2002). It iterates over steps until the sum of the squared errors in each group cannot be decreased any more. These steps are: (i) for each cluster, compute the mean value, and (ii) assign each point to the nearest cluster by calculating the distance of each point from the corresponding cluster's mean value. Typically, the K-means satisfies the following condition (Ashour, Hawas, Guo, & Wahba, 2018):

where dj and Zj are the number of pixels and the center of the jth cluster, respectively, as K is the total number of clusters. The K-means procedure aims to minimize D by satisfying the following condition:

In the dataset G = {gi, i = 1, 2, … , n}, gi is a sample in the d-dimensional space and C = {C1, C2, … , Cq} is the segment that fulfilled ![]() .
.
2.3 Proposed method for WBCs and nuclei detection
In the present work, the following procedure is applied, as illustrated in Algorithm 1.
Fig. 1 demonstrates the steps of the proposed method.

In Fig. 1, the ROI refers to the region of interest, which is the detected WBC.
3 Results and discussions
In the present chapter, a 50 WBC images were selected randomly from the dataset in (Zheng, Wang, Wang, & Liu, 2018). The corresponding ground-truth segmented images are also included in the used dataset, where the cytoplasms, nuclei, and background were marked. Fig. 2 illustrates the sample original microscopic images (Fig. 2A) from the used dataset with the corresponding ground-truth image (Fig. 2B).

3.1 While blood cell detection results
According to the proposed method phases, the Canny detector was applied initially to identify all edges in the red channel of the original microscopic images, as illustrated in Fig. 3 for the image number 172 in the dataset.

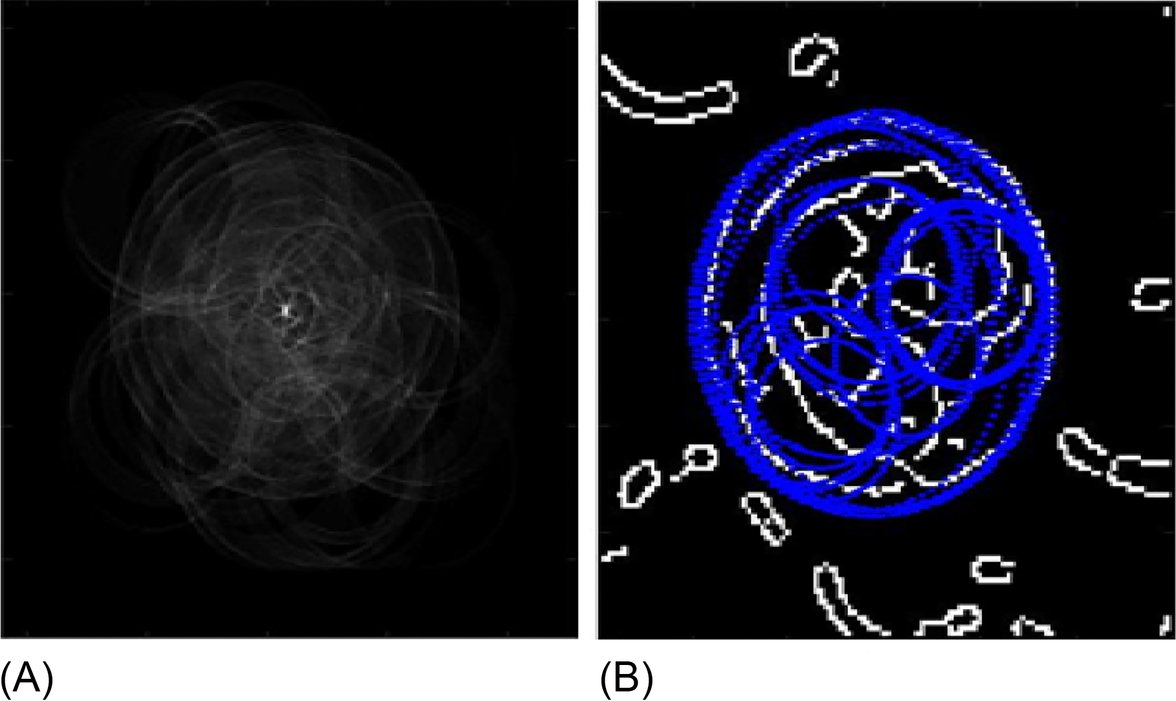
The edge-detected image is then input into the CHT, as reported in Fig. 4.
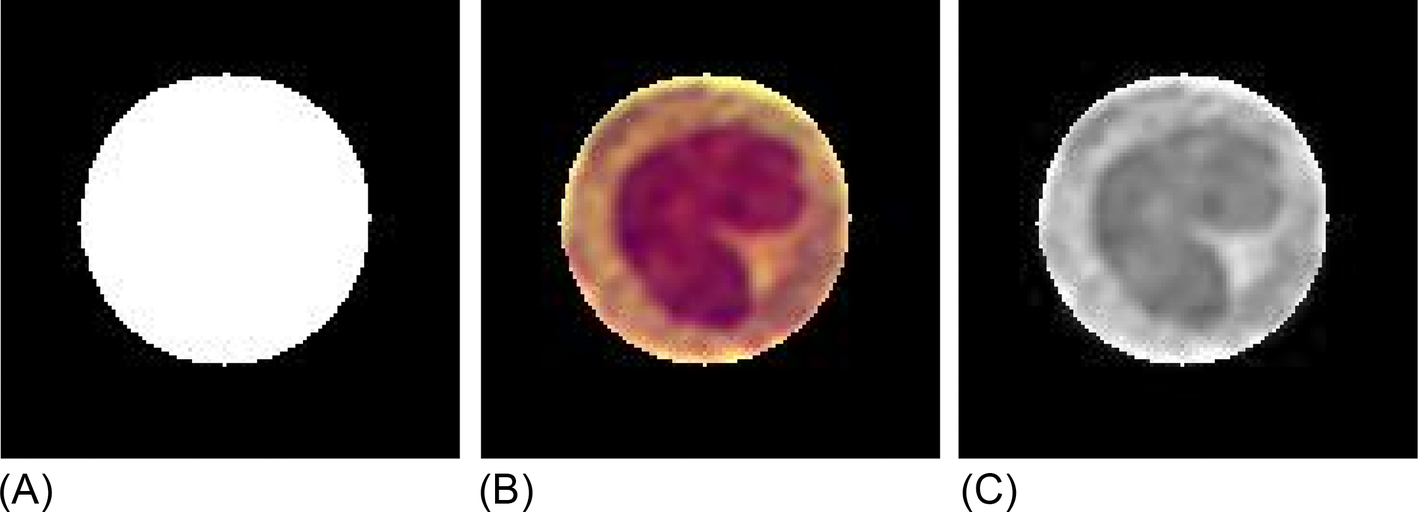
Then, the CHT image is used to generate a binary mask in order to detect the WBC by multiplying the original image with the generated binary mask, as shown in Fig. 5.
3.2 Nucleus detection results
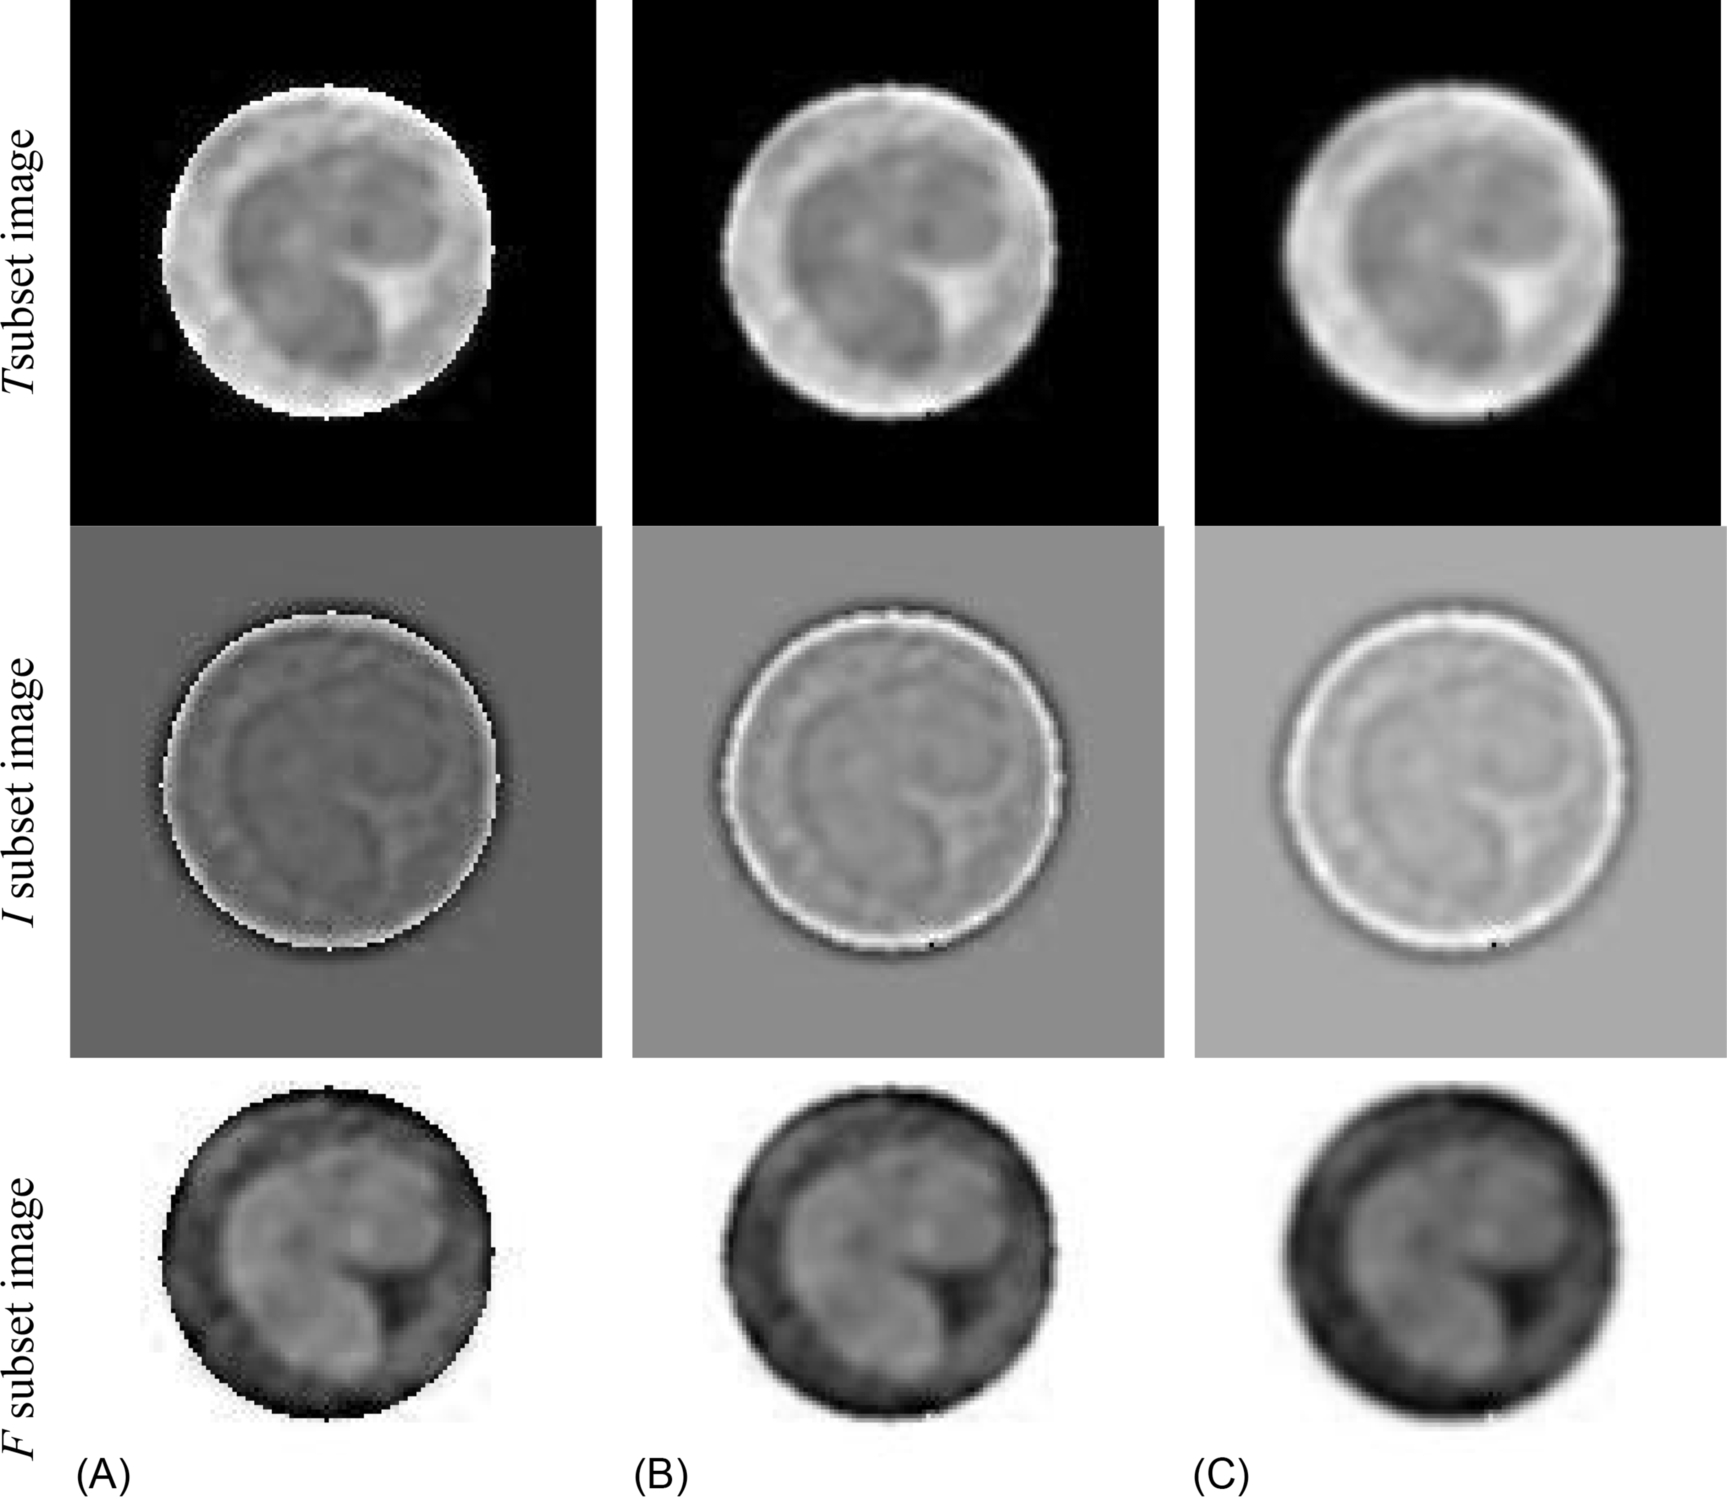
The detected WBC is then input into phase 2 in order to detect the nucleus in the WBC by mapping the CHT image to the NS domain yielding to the following image display steps in Fig. 6, followed by K-means clustering.
Afterward, the K-means clustering is applied to the NS output image, resulting in the segmented nucleus as illustrated in Fig. 7.

3.3 Comparative study
In order to evaluate the performance of the proposed method visually, Fig. 8 demonstrates the nucleus detection of five images from the dataset using the proposed HNK method compared to using CHT with K-means without using the NS (HT-K-means) method, using the NS without CHT and without K-means (NS) method, and using the K-means only without CHT and without the NS (K-means) method.

In Fig. 8, the red contour refers to the ground-truth image and the blue contour refers to the detected nucleus using the mentioned method. The results show that using NS improves the performance of the CHT by comparing Fig. 8C and F due to the ability of the NS to reduce the uncertainty. Additionally, Fig. 8 established the superiority of the proposed method compared to the other reported methods.
Finally, to evaluate the proposed HNK method for nuclei detection, the following evaluation metrics are measured, including the dice coefficient, JAC, specificity, sensitivity, and accuracy. These comparisons were conducted in terms of the performance evaluation metrics as reported in Table 1 and Fig. 9.
Table 1
| JAC (%) | Dice (%) | Sensitivity (%) | Specificity (%) | Accuracy (%) | |
|---|---|---|---|---|---|
| HT-K-means without NS | 81.46 | 89.21 | 94.99 | 97.57 | 97.31 |
| NS with K-means | 83.71 | 91.04 | 96.31 | 98.05 | 97.85 |
| K-means only | 83.51 | 90.46 | 90.67 | 98.94 | 98.03 |
| Proposed HNK | 87.14 | 93.10 | 95.08 | 98.88 | 98.44 |


Fig. 9 along with Table 1 reported the evaluation metrics of the proposed method of values 87%, 93%, 95%, 99%, and 98%, of the JAC, Dice, sensitivity, specificity, and accuracy, respectively.
4 Conclusions
Microscopic images have a significant role in the diagnosis of blood diseases and disorders. However, the automated detection of WBCs is still considered a challenging task due to several limitations, where the WBC embedded in a cluttered and complicated smear along with the staining effect on the image quality, which inspired several researchers. Because the WBC can be estimated as an ellipsoid/circular shape, a circular Hough transform was proposed in this chapter to recognize the WBC after using the Canny detector.
The proposed method was divided into two phases, namely, the WBC detection phase based on the CHT, followed by the nucleus detection phase using the NS and the K-means clustering to segment the nucleus. The experimental results established the superiority of the proposed method for detecting the WBC as well as the nucleus in the used dataset of different WBC images with a varying complexity range that was used to validate the effectiveness of the proposed method in terms of different evaluation metrics compared to several reported methods.