Debugging Mechanisms
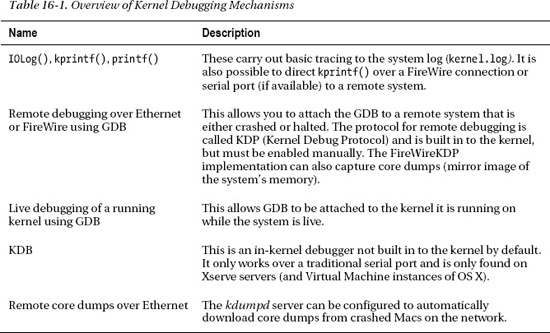
There are many debugging techniques; which one to use typically depends on the nature of the problem at hand. Here, we will look at some of the techniques that can help aid in debugging kernel problems. Table 16-1 provides a brief overview of some of the mechanisms we will discuss in this chapter.
Most of the preceding debugging technologies are included by default, but are not always enabled in the kernel by default because they may cause interference with the running kernel or hardware devices, or may pose a security risk, as it may be possible to obtain sensitive contents of the target’s memory.
Enabling debugging mechanisms or controlling the kernel’s debug behavior can be done by setting kernel boot arguments. Boot arguments can be set in two ways, either by using the nvram command or by adding it to the boot arguments key in /Library/Preferences/SystemConfiguration/com.apple.Boot.plist. There are a heap of available boot arguments, but we are most interested in the debug argument, which controls debugger and system debug behavior. The argument is an integer value and can consist of the flags shown in Table 16-2.
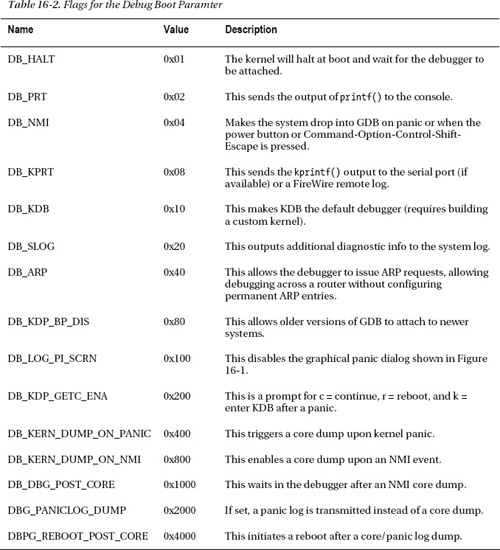
The values form a bitmask and you can combine multiple values together by ORing them. For example, to enable NMI, disable the graphical panic screen and enter the debugger upon panic. We can combine the values so that:
0x04 | 0x100 = 0x104
The value can be set in the com.apple.Boot.plist or using the nvram command:
$ sudo nvram boot-args=”original_contents debug=0x104”
To disable or remove debugging options, simply do the following:
$ sudo nvram boot-args=”original_contents”
If you have existing boot arguments set, this command will overwrite them, so be sure to query the boot-args argument first to prevent overwriting them.
Recovering from Crashes During Boot
Your extension may be installed in the /System/Library/Extensions directory and get loaded automatically during system boot. If there is a problem that causes the extension to crash repeatedly during system boot, the system can be recovered in the following different ways.
- Boot in safe mode by holding the shift key down after you hear the startup tone and release the key when the Apple logo appears. This should ensure only essential kernel extensions (KEXTs) are loaded and you will be able to remove your KEXT so the system can boot manually.
- Attach the system to another computer and boot it in target disk mode using a FireWire or Thunderbolt cable by holding down the T key during boot. You should then be able to remove the offending extension form the system’s disk.
- Boot into a different partition if one is available.
- If the offending KEXT is a driver for a piece of hardware, removing it from the system will likely prevent the driver from loading.
- Perform an NVRAM reset if you need to reset boot arguments.
If you are unsure what causes the crash, you can boot the system in verbose mode by pressing Command-V.
![]() Tip Details of startup key combinations supported by Intel-based Macs are available at
Tip Details of startup key combinations supported by Intel-based Macs are available at http://support.apple.com/kb/ht1533.
Tracing with IOLog()
We have already seen tracing in action throughout this book. Tracing involves strategically placing IOLog(...) statements in your code to print variables and to test if conditional blocks are triggered. IOLog() output eventually ends up in the kernel.log file. The kernel has quite a limited buffer for storing messages from IOLog(), so if you write a large amount of long messages too quickly, the buffer will wrap and you may overwrite data before the syslog daemon has the chance to store it to the log. This may cause confusion and lead to incorrect assumptions when expected output is not seen.
Many functions of your driver may end up being called hundreds or even thousands of times per second, so printing a message on each invocation may be counterproductive. Although the logging daemon has features to coalesce identical messages, this falls apart if there are slight variations between them. It also does nothing to prevent the buffer wrapping around and potentially overwriting some messages.
You can change the size of the system log buffer that IOLog() writes into by re-compiling the kernel or using the much simpler way of adding the kernel flag msgbuf=n, where n is the size of the buffer in bytes, to the kernel’s boot configuration property list com.apple.Boot.plist. This file is found in the /Library/Preferences/SystemConfiguration/ directory.
Even though a larger buffer may decrease the likelihood of data going missing, it doesn’t prevent the log from being flooded with messages when printing from functions in the “hot path” of the driver. To avoid this, you can use variations of the technique shown in Listing 16-1.
Listing 16-1. Limiting IOLog Output
static uint32_t        conditionCount = 0;

com_osxkernel_MyDriver::driverMethod()

{

    ...

    if (someCondition)

    {

        conditionCount++;

        if (conditionCount % 1000 == 0)

            IOLog(“condition has occurred: %u times
”, conditionCount);

    }

}
This will log the amount of times a condition occurs, but prints a message to the log only every thousandth time. If you wish to debug a primary interrupt filter, you can use a variant of this approach. However, the IOLog() call needs to be moved out of the primary interrupt filter routine to a place it can be safely called, for example, the secondary interrupt handler or a custom IOUserClient method.
If your driver has multiple instances, you may wish to print additional information so you can tell which instance is doing what. If you are in the context of an IOService, you can print the “this” pointer address to help uniquely identify each instance.
Should you always leave IOLog() statements in your driver code? Yes and no. Opinions differ on this, but it is definitely frowned upon for a driver to spam the system logs with unnecessary output that may hide other potentially important messages from other parts of the system. However, it may be acceptable to print a few messages about exceptional conditions. If you prefer to leave IOLog() statements in your code, you can prevent them from being outputted, using a conditional variable, which can be toggled on or off by a user space client. The problem with this is a slight increase in the executable size, as well as extra work to be done by the CPU in executing the conditional debug statements. The other approach is to use pre-processor directives, such as #ifdef DEBUG … #endif, so the statements will be compiled away from the resulting executable. Of course, there is also an option to leave most debug statements out entirely, which may make the code more readable. If a user reports a problem, the downside to the two last approaches is that there is no way to enable debugging once the driver is in the field, short of asking the user to install a debug version of the driver. A combination of all three is certainly also possible, but the general advice here is not to litter your code with debug logging, but to place them at strategic places where they are likely to be of use to you even for problems you didn’t anticipate.
While tracing using IOLog() seems like a primitive approach, it is often very effective in finding bugs. Of course, this approach works best when the system doesn’t actually crash so you can observe the behavior through the system log. However, if the system crashes, the syslog daemon will not be able to write the latest contents of the log buffer to the log file. Consequently, the output may be lost at the next reboot. There are ways to get around this, including remote tracing over FireWire, which is discussed later in this chapter.
Printing Stack Traces
The IOLog() function is good enough for many purposes; but in some cases, it is not enough to know a function is called. You also need to know the call stack that led to a call to your function as it may be called from multiple code paths. Printing the call stack can be achieved using the OSReportWithBackTrace() function, as demonstrated in Listing 16-2.
Listing 16-2. Using OSReportWithBackTrace() to Dump the Call Stack
void testFunc3() {

    IOLog("address of testFunc3: %p
", &testFunc3);

    OSReportWithBacktrace("OSReportWithBacktrace() called from testFunc3()");

}

void testFunc2() {

    IOLog("address of testFunc2: %p
", &testFunc2);

    testFunc3();

}

void testFunc1() {

    IOLog("address of testFunc1: %p
", &testFunc1);

    testFunc2();

}

bool com_osxkernel_MyDebugDriver::start(IOService * provider) {

    testFunc1();

    ….

}
The code in Listing 16-2 should give the following results:
address of testFunc1: 0x9ac280

address of testFunc2: 0x9ac250

address of testFunc3: 0x9ac220

OSReportWithBacktrace() called from testFunc3()

Backtrace 0x9ac26f 0x9ac29f 0x9ac2ee 0x543f60 0x542137 0x5426e9 0x5443d5

    Kernel Extensions in backtrace (with dependencies):

         com.osxkernel.MyDebugDriver(1)@0x9ab000->0x9acfff
You may notice the printed addresses of the test functions are similar, but not the same as the ones printed in the back trace. The addresses printed by IOLog() are relative to the start of each function; however, in the back trace, you instead see the address of where each test function is calling the next test function. The OSReportWithBacktrace() function also prints the start and end addresses of any KEXTs involved in the back trace. We see our KEXT is loaded at the memory address 0x9ab000 and you may notice that testFunc1(), testFunc2(), and testFunc3() are all within the address range of the MyDebugDriver. Using this information, we can also work out the offset where a function is located within its executable image by subtracting the address of a function from the base address, for example, for testFunc1(): 0x9ac280 - 0x9ab000 = 4736 bytes. You can then use the GDB debugger with the disassemble <offset> command.
Remote Tracing over FireWire
It is possible to redirect output from the krprintf() function over a FireWire connection to another system. This method is more robust than using IOLog(), as log output will be preserved on the remote system in the event of a crash. Another advantage of this approach is that it is available in the very early boot process, which is useful for debugging a driver that’s involved with the system boot process, such as storage and display drivers. It also allows debugging of shutdown and sleep events. Your driver does not need any special support or modifications to support outputting log information over FireWire.
Everything needed to configure remote logging over FireWire is already included in Mac OS X from versions 10.5 and above and there is no need to install additional KEXTs. You need two Macs to set this up. It is not necessary for both systems to run the same version of Mac OS X.
On the target machine, the machine you wish to send log output from, do the following.
$ sudo nvram boot-args="debug=0x8"
This boot option enables redirection of the kprintf() function so output will be mirrored to the FireWire interface as well as the system log. The system should be rebooted for this option to take effect. The next step is to connect a FireWire cable between the two systems. Unlike IOLog(), the kprintf() function is synchronous, which means by the time it returns, it will have transmitted the message over FireWire. The kprintf() disables interrupts until it completes, which can affect timing-related issues when used excessively. Because interrupts are disabled, the function may cause a crash if memory referenced by the functions arguments happens to be paged out.
![]() Caution It is recommended that both the target and debug machines have all other FireWire devices disconnected during debugging.
Caution It is recommended that both the target and debug machines have all other FireWire devices disconnected during debugging.
On the machine that will receive the debug output, run the fwkpfv command, which is the FireWire log viewer utility. If the target machine was connected correctly and the cable properly attached, you will receive debug output after a few seconds. The following example shows an extract from a session captured while the target machine boots:
Welcome to FireWireKPrintf. (viewer v2.6)

AppleFWOHCI_KPF: version 4.7.1 – init

u>626665 AppleFWOHCI_KPF: Time format-> Microseconds = 'u>clock_uptime_micro'

u>1141021 AppleUSBHub::setPowerState(0x4fbe200, 0 -> 4) took 301 ms

u>2065689 [Bluetooth::CSRHIDTransition] DeviceRequest error: e00002ed

u>2109928 AppleUSBHub::powerStateWillChangeTo(0x4f13200, AppleUSBHub, 4 -> 3) took 100 ms

u>2117294 AppleUSBHub::powerStateWillChangeTo(0x4f70e00, AppleUSBHub, 4 -> 3) took 100 ms

u>2130057 AppleUSBHub::powerStateWillChangeTo(0x4f70a00, AppleUSBHub, 4 -> 3) took 100 ms

…

…

…

u>20236388 Adding domain PPP (family 34)

u>24073549 kPEDisableScreen -1

u>24158956 kPEDisableScreen 1

u>25568081 initialize_screen: b=4645B000, w=00000690, h=0000041A, r=00002000, d=00000001

u>25568131 kPEEnableScreen 1

u>304129579 IOSCSIPeripheralDeviceType00::setPowerState(0x4fe3500, 3 -> 4) async took 351 ms

u>1070371211 IOSCSIPeripheralDeviceType00::setPowerState(0x4fe3500, 3 -> 2) async took 1153

ms
If you wish to log over FireWire from your own KEXT, you will have to use the kprintf() function to log with rather than IOLog(), which doesn’t use kprintf internally but rather calls printf(), which only goes to the kernel log. A strategy to deal with this is to create your own wrapper function for IOLog() and kprintf() that calls the former for a release build and the latter for a debug build.
Listing 16-3 shows an example of how to log using kprintf().
Listing 16-3. Logging Messages to a Remote Machine over FireWire Using kprintf()
#include <kern/debug.h> // Declares kprintf()

bool com_osxkernel_MyDebugDriver::start(IOService * provider)

{

        kprintf("%s::start - Hello FireWire Listeners
", getName());

        return true;

}
Running this yields the following on the remote system:
u>1071578492 com_osxkernel_MyDebugDriver::start - Hello FireWire Listeners
If the kernel crashes, you can also get the panic log through the FireWire log viewer. It is also possible to use FireWire to attach the GNU debugger remotely to the kernel, as we will see later in this chapter.
Remote Kernel Core Dumps
Mac OS X provides a mechanism for transmitting core dumps from a crashed (or hung) system to a remote machine over the network. A core dump is a binary image of the wired contents of the system’s memory. By capturing a core dump, we can retain evidence of the exact state the system was in at the time of the crash and we can use this image with the GDB to get stack traces for all threads in the system and examine memory contents as well as kernel data structures.
Conveniently, everything you need to enable core dumps is already present in Mac OS X. Only minor configuration is required. On the dump server, the machine that receives the core dumps from crashed machines, you need to activate the kdumpd daemon, as follows.:
# sudo vi /System/Library/LaunchDaemons/com.apple.kdumpd.plist
Change the Disabled key from true to false. If you wish, you can also configure the directory where dumps will be located. The default is /PanicDumps. The kdumpd daemon is started as follows:
# sudo launchctl load /System/Library/LaunchDaemons/com.apple.kdumpd.plist

# sudo launchctl start com.apple.kdumpd
The server uses UDP on port 1069, so you should ensure there is no firewall between the target machines and the server. The target and server do not need to be running the same version of Mac OS X.
![]() Note To use kdumpd, the target machine (the crashing system) needs to be connected to the network using Ethernet. It is not possible to use an AirPort device, as the driver for KDB (Kernel Debugging Protocol), which handles transmission of the dump, only works with Ethernet devices. When loaded, you can check where the kernel debugging driver is attached using IORegisteryExplorer and search for the driver named IOKernelDebugger.
Note To use kdumpd, the target machine (the crashing system) needs to be connected to the network using Ethernet. It is not possible to use an AirPort device, as the driver for KDB (Kernel Debugging Protocol), which handles transmission of the dump, only works with Ethernet devices. When loaded, you can check where the kernel debugging driver is attached using IORegisteryExplorer and search for the driver named IOKernelDebugger.
The kdumpd daemon is able to receive core dumps from multiple machines and will archive each dump with the machine’s IP address. If you work for a company that develops software that runs in the kernel, you can configure all your Macs to automatically send dumps to a central server when a crash occurs. This saves a lot of time when quality assurance testers encounter problems during testing, as engineering can simply start debugging the dumped image immediately.
![]() Caution Care should be taken to only to use kdumpd in trusted networks, as memory contents of the crashed system are transmitted unencrypted over the network and may contain sensitive information, such as passwords and private keys.
Caution Care should be taken to only to use kdumpd in trusted networks, as memory contents of the crashed system are transmitted unencrypted over the network and may contain sensitive information, such as passwords and private keys.
Configuring the target machine is equally simple and is done by setting kernel boot arguments either in /Library/Preferences/SystemConfiguration/com.apple.Boot.plist or using the nvram command, as follows:
# sudo nvram boot-args=”debug=0xd44 _panicd_ip=192.168.1.1”
The preceding instructs the kernel to dump core when it panics or if an NMI (non-maskable interrupt) event was triggered. The latter is highly useful in the cases where the system hangs completely and appears unresponsive but does not actually panic. In this case, you can use the power button on the computer to trigger the NMI event, which will start the core dump. During this time, the machine will be frozen and no processes will run. If the machine is responsive and you do this, the machine will simply resume as if nothing had happened after the core dump is transferred.
The _panicd_ip parameter specifies the IP address of the machine running kdumpd. If you plan on having a permanently running panic server, it is recommended this IP be static. It is not possible to use a hostname or DNS name for the server, as name resolution is not possible.
The following output will appear on the screen of the target machine if you press the power button:
Entering system dump routine

Attempting connection to panic server configured at IP 192.168.1.1, port 1069

Resolved 192.168.1.1’s (or proxy’s) link level address

Transmitting packets to link level address: 00:16:cb:a6:73:8b

Kernel map size is 4546437120

Sending write request for core-xnu-1699.22.73-192.168.1.2-2fe8a6d9

Protocol features: 0x1

Kernel map has 1389 entries

Generated Mach-O header size was 100224
The target machine will write dots (.) to the screen until the dump is complete. If it was an NMI event that triggered the dump, the system will resume; if it was a panic, the system will wait for a remote debugger to be attached.
KDB
The kernel supports an in-kernel debugger called KDB. KDB only supports debugging over the serial port. It is not included in the kernel build by default; therefore, you need to compile and install a custom kernel in order to use it. KDB has some applications for very low-level debugging where neither FireWire nor Ethernet is available. KDB requires a native serial port on the machine being debugged, which is only found on the now discontinued Xserve (although a serial port is available if Mac OS X is used under a virtual machine). For all intents and purposes, the GNU Debugger (GDB) is recommended; we only mention KDB here to avoid confusion with GDB.
Remote Debugging with GDB over Ethernet or FireWire
The kernel has support for using the GDB over Ethernet (IP/UDP) or FireWire connections. Again, this requires two computers running Mac OS X. While GDB is supported through Xcode, you cannot debug the kernel using Xcode; you will have to use the command-line interface. GDB is, however, part of Xcode. It is not necessary to install Xcode on the machine being debugged; it is only needed on the remote system (the client).
![]() Note Strictly speaking, it would be possible to use another operating system running GDB as the host to debug a Mac OS X target system. Although there is no documentation for doing this, some documentation suggests it is possible, however non-trivial, to configure.
Note Strictly speaking, it would be possible to use another operating system running GDB as the host to debug a Mac OS X target system. Although there is no documentation for doing this, some documentation suggests it is possible, however non-trivial, to configure.
The debugging support is built in to the kernel by default, unlike KDB. However, the debugging capabilities are disabled by default, but can easily be enabled by adding the appropriate boot arguments on the target machine, for example:
$ sudo nvram boot-args="debug=0x144 -v".
The “-v” (verbose) flag isn’t strictly necessary. It has the effect of disabling the grey screen with the Apple logo during boot and instead showing a text console, commonly found on UNIX and Linux systems, which shows log messages as the system boots. Once the boot arguments have been set, the system needs to be rebooted for the changes to take effect.
Configuring the Host Machine
Setting up the target is straightforward. However, the host machine requires a little more preparation. Before you can start debugging, you need to download the correct Kernel Debug Kit for the kernel version used by the target system. Apple doesn’t appear to publish a version for every build in a timely manner, so the target system would have to be downgraded or upgraded to match a published version of the Kernel Debug Kit. If you use the wrong version, GDB may fail to resolve the correct symbols and data structures and the results may be wrong and cause great confusion, for example, functions getting called that should not have.
![]() Tip Kernel Debug Kits are not part of Xcode and can be downloaded from
Tip Kernel Debug Kits are not part of Xcode and can be downloaded from http://developer.apple.com/hardwaredrivers/download/kerneldebugkits.html. This page contains legacy versions, while newer versions are published in the Downloads ![]() Developer Tools section on the Apple developer site. This page is restricted to members of the Mac developer program (there’s an annual fee to become a member).
Developer Tools section on the Apple developer site. This page is restricted to members of the Mac developer program (there’s an annual fee to become a member).
The Kernel Debug Kit contains the following:
- Debug version of the kernel (mach_kernel)
- Debug version of I/O Kit families and selected KEXTs
- Symbol files
- Various scripts
- Macros for GDB
![]() Caution Do not replace files on your system with files from the Kernel Debug Kit; they do not need to be installed on the target or host system. In fact, you do not need to install any files from the kit; you can access them directly through the mounted image.
Caution Do not replace files on your system with files from the Kernel Debug Kit; they do not need to be installed on the target or host system. In fact, you do not need to install any files from the kit; you can access them directly through the mounted image.
You can replace the default kernel (mach_kernel) of a Mac OS X system with the debug version found in the Kernel Debug Kit. This will help you get more accurate results and stack traces, as optimization has been disabled.
If you have the sources for the XNU kernel installed on the host system, it is possible to link this with the debugger, which allows you to see source code instead of assembly code in the debugger, though this is often not needed if you are only debugging your own extension (in which case you can link the source for your own extension only).
Attaching to the Remote Target
If you have set the appropriate boot arguments with the nvram command on the target system and have the Kernel Debug Kit ready on the host machine, you can now trigger an NMI event on the target system by pressing the system’s power button. This should cause the following text to appear on the top left corner of the screen:
Debugger called: <Button SCI>

ethernet MAC address: 00:16:cb:a6:74:8b

ip address: 192.168.1.1


Waiting for remote debugger connection.
Starting GDB and attaching to the remote target can be done using the following steps:
$ gdb -arch i386 /Volumes/KernelDebugKit/mach_kernel
The arch argument can specified if the debug host is running on a different architecture from the target system. For example, in this case, we are debugging a target running a 32-bit kernel on a system with a 64-bit kernel. You can also do the reverse by specifying x86_64.
(gdb) source /Volumes/KernelDebugKit/kgmacros
The preceding line will load specialized GDB macros, which will help you examine the state of the target system’s kernel. You can, for example, dump a list of running tasks or threads. Type help kgm to get a full list of available macros.
To attach to the target, use the following:
(gdb) target remote-kdp

(gdb) attach 192.168.1.1

Connected.

(gdb)
The preceding will attach to the remote target so we can begin our debugging session. We can then start issuing commands, for example, bt to get a stack trace, which will look something like the following:
#0  Debugger (message=0xba97e4 "Button SCI") at /SourceCache/xnu/xnu-

1504.15.3/osfmk/i386/AT386/model_dep.c:867

#1  0x00ba8de3 in ?? ()

#2  0x00556636 in IOFilterInterruptEventSource::normalInterruptOccurred (this=0x4eab980) at

/SourceCache/xnu/xnu-1504.15.3/iokit/Kernel/IOFilterInterruptEventSource.cpp:140

#3  0x00b73a50 in ?? ()

#4  0x00b72ccd in ?? ()

#5  0x00b85fc5 in ?? ()

#6  0x00b89621 in ?? ()

#7  0x0056ac20 in IOSharedInterruptController::handleInterrupt (this=0x4e9cd80,

nub=0x4e9cd80) at /SourceCache/xnu/xnu-1504.15.3/iokit/Kernel/IOInterruptController.cpp:727

#8  0x00bcf5bb in ?? ()

#9  0x00b66213 in ?? ()

#10 0x00b71911 in ?? ()

#11 0x00580d96 in PE_incoming_interrupt (interrupt=73) at /SourceCache/xnu/xnu-

1504.15.3/pexpert/i386/pe_interrupt.c:65

#12 0x002ab432 in interrupt (state=0x4e9dd20) at /SourceCache/xnu/xnu-

1504.15.3/osfmk/i386/trap.c:511

#13 0x002a1c2e in lo_allintrs () at cpu_data.h:397

#14 0x00225bba in processor_idle (thread=0x10bff0, processor=0x4cf0dac) at

/SourceCache/xnu/xnu-1504.15.3/osfmk/kern/sched_prim.c:2982

#15 0x0022698c in thread_select (thread=0x5e407a8, processor=<value temporarily unavailable,

due to optimizations>) at /SourceCache/xnu/xnu-1504.15.3/osfmk/kern/sched_prim.c:1327

#16 0x002275b0 in thread_block_reason (continuation=0, parameter=0x0, reason=<value

temporarily unavailable, due to optimizations>) at /SourceCache/xnu/xnu-

1504.15.3/osfmk/kern/sched_prim.c:1856

#17 0x00227654 in thread_block (continuation=0) at /SourceCache/xnu/xnu-

1504.15.3/osfmk/kern/sched_prim.c:1875

#18 0x464debbc in ?? ()
The command will show the kernel stack, which is the sequence of function calls the CPU was executing at the time of the NMI event. We can see in this case that the last thing the system did before we halted it was to respond to the NMI interrupt. If you are curious what the other CPUs (cores) were doing at the time, you can issue the command showcurrentstacks, which will print a stack trace for each CPU (core) in the system.
You can now set breakpoints or examine the state of the kernel. Issuing the continue command will resume the kernel. We will look at how GDB can be used in more detail later in this chapter.
Debugging Using FireWire
In addition to Ethernet, the Kernel Debugging Protocol can also be used over FireWire, using the FireWireKDP mechanism. The fwkdp tool can be used to help set the appropriate debug parameters, but you can also set them manually. FireWireKDP is also compatible with logging over FireWire and can be used to transmit core dumps to a remote system.
To configure FireWireKDP on the target system, you can do as follows:
$ sudo fwkdp --setargs

FireWire KDP Tool (v1.3)

Boot-args helper mode:

*** Would you like to enable kernel core dumps? y|[n] > y

Setting boot-args with 'sudo nvram boot-args="debug=0xd46 kdp_match_name=firewire

_panicd_ip=1.2.3.4"'

Setting boot-args... done.

Restart for the nvram changes to take effect.
![]() Tip The manual (man) page for
Tip The manual (man) page for fwkdp has more info.
On the host system, where you will run the debugger, you will need to run fwkdp as well. Be sure to start it in proxy mode. Once that is done, you can use GDB to debug in the same way as with Ethernet. The process of attaching to the remote target is nearly identical; the only major difference is that you attach to localhost, not the target’s IP address. Once the target system is rebooted, you can enter the debugger by pressing the power button to generate an NMI event as before, which should give the following results on the target’s screen:
Debugger Called: <Button SCI>

Entering system dump routine

Attempting connection to panic server configured at 1.2.3.4 port 1069

AppleFWOHCI_KDP: Darwin Kernel Version 10.8.0: Tue Jun 7 16:33:36 PDT 2011; root:xnu-

1504.15.3~1/RELEASE_i386

AppleFWOHCI_KDP: v4.7.3 configured as KDP sender/receiver.

Recevied a debugger packet, transferring control to the debugger

Transmitting packets to link level address: 00:1c:df:f7:e0:72

Kernel map size is 1187131392

Sending write request for core-xnu-1504.15.3-0.0.0.0-ff28cfb5

Kernel map has 850 entries

Generated Mach-O header size was 79932

Transmitting kernel state, please wait: ……

Total number of packets transmitted: 502848

Waiting for remote debugger connection.

Connected to remote debugger.
If all goes well, the fwkdp proxy running on the host will download the core file to its working directory. The core dump in the preceding example was named core-xnu-1504.15.3-0.0.0.0-ff28cfb5. After the core is downloaded, the remote system will wait for a debugger to be attached.
Live Debugging of a Running Kernel
A less known but powerful feature available in Mac OS X (since version 10.5) is the ability to attach the debugger to a running system. Live debugging requires you to enable support for the /dev/kmem character device file, which allows a user space process to read and write to the kernel’s memory address space. You can enable support for /dev/kmem with the following command:
$ sudo nvram boot-args=”kmem=1”
![]() Note The preceding command will clear existing boot arguments, so you would need to add this in addition to any other arguments you want, for example, to enable remote debugging or FireWire logging.
Note The preceding command will clear existing boot arguments, so you would need to add this in addition to any other arguments you want, for example, to enable remote debugging or FireWire logging.
You can test if it worked by checking that the /dev/kmem file is present after a reboot. The process of attaching to the live kernel is similar to that of attaching to a remote target. The steps are as follows:
$ sudo gdb /Volumes/KernelDebugKit/mach_kernel


(gdb) target darwin-kernel

(gdb) source /Volumes/KernelDebugKit/kgmacros

Loading Kernel GDB Macros package. Type "help kgm" for more info.


(gdb) attach

Connected.
At this point, you can examine the state of the kernel, for example, using the showcurrentthreads command.
Live debugging is useful in a number of cases, for example, if an application using your driver hangs in the kernel while executing a user client method. You can attach to the kernel and find out where the issue is. You can also examine the memory of your driver and its data structures. Live debugging can only be used when the system is operational and cannot be used to debug a crashed or deadlocked system.
Debugging Using a Virtual Machine
If you do not have a second machine available, it is possible to perform kernel debugging using a virtual machine. Software such as VMWare Fusion or Parallels desktop allows another copy of Mac OS X to run virtualized. Enabling the kernel debug features on the virtual machine can be done by putting the desired boot arguments in the/Library/Preferences/SystemConfiguration/com.apple.Boot.plist. Debugging hardware drivers may not be possible under a virtual machine, as you cannot use PCI or Thunderbolt devices directly under a virtual machine. However, it is possible to assign USB devices to a virtual machine instance. Mac OS X Lion is able to run as a virtualized instance, however, prior to that, only the server version of Mac OS X could be virtualized.
Debugging in the Kernel Using GDB
There are several ways GDB can be used to debug the kernel or KEXTs loaded into it, such as:
- Remotely over Ethernet
- Remotely over FireWire
- On a captured core dump file
- On a Live live system
- Using a virtual machine
Additionally, a kernel can drop into the debugger in the following ways:
- Because of a kernel panic
- Manually triggered NMI event
- Because the DB_HALT option was set to halt the system at boot and enter the debugger
- Programmatically in code by calling the
PE_enter_debugger()function
Programmatically entering the debugger is only possible with a remote debugging setup; live debugging cannot occur during boot, when the system is crashed, or halted with an NMI event, nor programmatically, as this stops the system until a remote debugger is attached and thereby the gdb instance running the debugging session as well.
Kernel GDB Macros
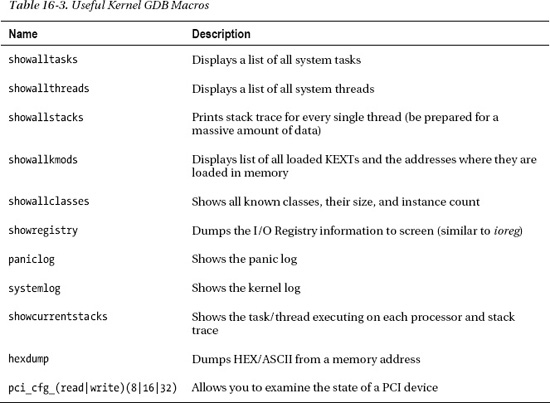
The Kernel Debug Kit comes with a wealth of helpful GDB macro functions, which greatly simplify the task of examining the kernel. The macros can help interpret common kernel data structures, such as task and thread descriptors, and memory-related data structures, such as VM maps. Furthermore, it provides functions for accessing PCI configuration space, I/O space, and un-translated access to physical memory. A small subset of available macros is shown in Table 16-3.
Creating Symbol Information for KEXTs
Before you can debug your own KEXTs in GDB, you need to generate symbol information for the KEXT. Because a KEXT is dynamically loadable, we have no way of knowing where in memory it will be located. Although our KEXT includes symbol information, the addresses of functions and data are relative to the KEXT binary. The absolute address of a function in a KEXT will be the kernel_load_address + relative_address once the KEXT is loaded.
Fortunately, the Kernel Debug Kit gives us a helping hand by providing a small script that helps generate the final symbol table containing the absolute addresses within the kernel address space. The script is called createsymbolfiles and can be used as follows:
$ /Volumes/KernelDebugKit/createsymbolfiles -a i386 -s ./ MyDebugDriver.kext

MyDebugDriver.kext appears to be loadable (not including linkage for on-disk libraries).


Enter the hexadecimal load addresses for these extensions

(press Return to skip symbol generation for an extension):


com.osxkernel.MyDebugDriver: 0x9b9000
The load address can be found in several places, for example, with kextstat, as follows:
$ kextstat

Index Refs Address    Size       Wired      Name (Version) <Linked Against>

  126    0 0x9b9000   0x3000     0x2000     com.osxkernel.MyDebugDriver (1) <5 4 3>
In the preceding case, the KEXT had no additional dependencies; however, in a real world situation, a KEXT may have dependencies on one or more other KEXTs, such as an I/O Kit family, in which case you will be prompted to enter their addresses as well. If you are debugging a crash dump from a remote system or directly debugging a crashed system, the load address of your extension and any dependencies will be found in the panic log if your extension was involved in the crash. Note that your KEXT may be given a different address each time it loads, so you will need to regenerate the symbol information each time.
The above is enough to get us basic symbol information, but it is restricted to symbolic names of functions only and is not able to give us source code line information. You can get this by configuring your extension’s debug information format, as shown in Figure 16-2.
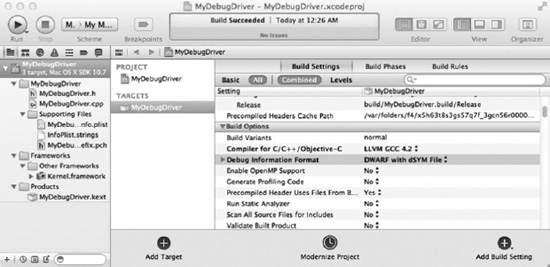
Figure 16-2. Setting the debug information format with Xcode
DWARF with dSYM creates a separate file for you containing a full set of symbols and information needed to map a code location back to a source code line. This information is normally embedded into an executable when doing a debug build; however, you can generate that information in an external file for release builds of the driver. It is good practice to archive this debug information for later use. This will make debugging easier if crashes should be reported by a user. The dSYM file (actually bundle) will be named MyDebugDriver.kext.dSYM in our case. The dSYM bundle should be placed together with the KEXT before the createsymbolfiles script is run.
Debugging KEXTs with GDB
In the following sections, we will analyze a crash caused by a hypothetical driver named MyDebugDriver. The header file specification for MyDebugDriver is shown in Listing 16-4.
Listing 16-4. MyDebugDriver Header File
class com_osxkernel_MyDebugDriver : public IOService

{

    OSDeclareDefaultStructors(com_osxkernel_MyDebugDriver);

public:

    virtual bool init(OSDictionary* dict);

    virtual bool start(IOService* provider);

    virtual void stop(IOService* provider);


    void testFunc1(UInt32 arg1, UInt32 arg2, UInt32 arg3, UInt32 arg4);

    void testFunc2(UInt32 arg1, UInt32 arg2, UInt32 arg3, UInt32 arg4);

    void testFunc3(UInt32 arg1, UInt32 arg2, UInt32 arg3, UInt32 arg4);


    static void  timerFired(OSObject* owner, IOTimerEventSource* sender);

private:


    IOTimerEventSource*     fTimer;

    int                     fVariable1;

    int                     fVariable2;

};
The driver starts a timer, from which testFunc1() is called, which in turn calls testFunc2(), which calls testFunc3(), which causes a kernel panic due to a null pointer dereference. Each function accepts four integers that have no significance (picked randomly) and are passed unchanged from the first function to the last. The values passed as arguments are 65261, 48879, 0, and 5380.
We have successfully generated a core dump from a crash system using the FireWire core dump mechanism and previously, we built symbol information for our driver using the correct load address. We are now ready to load it up in the GDB and get our hands dirty. The steps we need to perform to find the bug in our driver are as follows:
- Create a symbol file with the correct load address (see the last section)
- Start GDB and load the core dump
- Add symbol information from the kernel
- Load Kernel Debug Kit GDB macros
- Load our KEXT binary of MyDebugDriver into GDB
- Load symbol information for MyDebugDriver (if GDB cannot find them in the same location as the KEXT)
- Tell GDB the location of the source code for MyDebugDriver (optional)
Following is a complete debug session for MyDebugDriver:
$ gdb -c core-xnu-1504.15.3-0.0.0.0-fb3a74d3

GNU gdb 6.3.50-20050815 (Apple version gdb-1704) (Thu Jun 23 10:48:29 UTC 2011)

…

This GDB was configured as "x86_64-apple-darwin".

#0  0x002b1e3e in ?? ()

(gdb) add-symbol-file /Volumes/KernelDebugKit/mach_kernel

add symbol table from file "/Volumes/KernelDebugKit/mach_kernel"? (y or n) y

Reading symbols from /Volumes/KernelDebugKit/mach_kernel...Reading symbols from /Volumes/KernelDebugKit/mach_kernel.dSYM/Contents/Resources/DWARF/mach_kernel...done.

done.

(gdb) source /Volumes/KernelDebugKit/kgmacros

Loading Kernel GDB Macros package.  Type "help kgm" for more info.
The preceding sequence of commands loads the core dump file, adds symbol information for the kernel from the Kernel Debug Kit, and finally loads the GDB macros, which must be loaded after the kernel symbol information to initialize properly.
We can now issue the backtrace command to see where the system crashed, as follows:
(gdb) backtrace

#0  0x002b1e3e in Debugger (message=0x5dd7fc "panic")

#1  0x0021b837 in panic (str=0x59e3d0 "Kernel trap at 0x%08x, type %d=%s, registers:
CR0:

0x%08x, CR2: 0x%08x, CR3: 0x%08x, CR4: 0x%08x
EAX: 0x%08x, EBX: 0x%08x, ECX: 0x%08x, EDX:

0x%08x
CR2: 0x%08x, EBP: 0x%08x, ESI: 0x%08x, EDI: 0x%08x
E"...) at /SourceCache/xnu/xnu-

1504.15.3/osfmk/kern/debug.c:303

#2  0x002abf6a in panic_trap [inlined] () at :1052

#3  0x002abf6a in kernel_trap (state=0x46ee3e10) at /SourceCache/xnu/xnu-

1504.15.3/osfmk/i386/trap.c:1001

#4  0x002a1a78 in trap_from_kernel () at cpu_data.h:397

#5  0x009ba0b7 in last_kernel_symbol ()

#6  0x009ba356 in last_kernel_symbol ()

#7  0x009ba3b8 in last_kernel_symbol ()

#8  0x009ba45b in last_kernel_symbol ()

#9  0x005571d5 in IOTimerEventSource::timeoutAndRelease (self=0x2a17b0, c=0x5022071) at

/SourceCache/xnu/xnu-1504.15.3/iokit/Kernel/IOTimerEventSource.cpp:122

#10 0x00230235 in thread_call_thread (group=0x863ea0) at /SourceCache/xnu/xnu-

1504.15.3/osfmk/kern/thread_call.c:848
Because we have not yet loaded our KEXT, symbols #5–#8 are showing up as bogus, as the debugger is unable to resolve the addresses of the functions to their symbolic names. To fix this, we will load the MyDebugDriver KEXT into GDB along with its symbol information, as follows:
(gdb) add-kext MyDebugDriver.kext

Reading symbols from com.osxkernel.MyDebugDriver.sym...Reading symbols from

MyDebugDriver.kext.dSYM/Contents/Resources/DWARF/MyDebugDriver...done.

(gdb) directory MyDebugDriver/

Source directories searched: MyDebugDriver:$cdir:$cwd
We have now loaded the driver along with its symbol information and informed GDB of the location where it should look for the source code of MyDebugDriver. The location of the kernel’s own source code is hard wired into the debug kernel image. If you wish to show the source code in GDB, you need to create a symlink for the location where you downloaded the XNU source to the directory: /SourceCache/.
Let’s try the backtrace command again with the KEXT and symbols loaded, as follows:
(gdb) backtrace

…

#5  0x009ba0b7 in com_osxkernel_MyDebugDriver::testFunc3 (this=0x4e80f80, arg1=65261,

arg2=48879, arg3=0, arg4=5380) at MyDebugDriver.cpp:14

#6  0x009ba356 in com_osxkernel_MyDebugDriver::testFunc2 (this=0x4e80f80, arg1=65261,

arg2=48879, arg3=0, arg4=5380) at MyDebugDriver.cpp:21

#7  0x009ba3b8 in com_osxkernel_MyDebugDriver::testFunc1 (this=0x4e80f80, arg1=65261,

arg2=48879, arg3=0, arg4=5380) at MyDebugDriver.cpp:27

#8  0x009ba45b in com_osxkernel_MyDebugDriver::timerFired (owner=0x4e80f80, sender=0xb63adc0)

at MyDebugDriver.cpp:64

…
That’s much more readable. We have now identified the exact call stack and we can see which methods in our in our driver that was involved, down to the file and line number. We can also see the arguments that were passed to the methods and that they correspond to the values we picked earlier. Let’s examine the crash further by jumping to the fifth stack frame, the location where the crash occurred, as follows:
(gdb) frame 5

#5  0x009ba0b7 in com_osxkernel_MyDebugDriver::testFunc3 (this=0x4e80f80, arg1=65261,

arg2=48879, arg3=0, arg4=5380) at MyDebugDriver.cpp:14

14                     thisWillNotWork->fVariable1 = arg3;

Current language:  auto; currently c++

(gdb) print thisWillNotWork

$1 = (com_osxkernel_MyDebugDriver *) 0x0
I think we found the problem! We are trying to assign a value to the member variable fVariable1 but the object is not initialized. We can also list the source code of testFunc3(), as follows:
(gdb) list com_osxkernel_MyDebugDriver::testFunc3,15

9      void com_osxkernel_MyDebugDriver::testFunc3(UInt32 arg1, UInt32 arg2, UInt32 arg3, UInt32 arg4)

10     {

11         if (arg3 == 0)

12         {

13             com_osxkernel_MyDebugDriver *thisWillNotWork = NULL;

14             thisWillNotWork->fVariable1 = arg3;

15         }
Well, that would never work! We have found our bug, which appears to be triggered only when the third argument passed is set to zero.
If you only have symbol information and lack the debug information required to map addresses to a specific source code location, you can use the disassemble command in GDB to show a dump disassembly of the method from its address. Let’s look at the disassembly of testFunc3(), as follows:
(gdb) disassemble 0x009ba0b7

…

0x009ba09f <testFunc3Emmmm+35>:     mov    %eax,-0x1c(%ebp)

0x009ba0a2 <testFunc3Emmmm+38>:     mov    -0x18(%ebp),%eax

0x009ba0a5 <testFunc3Emmmm+41>:     cmp    $0x0,%eax

0x009ba0a8 <testFunc3Emmmm+44>:     jne    0x9ba0ba <testFunc3Emmmm+62>

0x009ba0aa <testFunc3Emmmm+46>:     movl   $0x0,-0x20(%ebp)

0x009ba0b1 <testFunc3Emmmm+53>:     mov    -0x18(%ebp),%eax

0x009ba0b4 <testFunc3Emmmm+56>:     mov    -0x20(%ebp),%ecx

0x009ba0b7 <testFunc3Emmmm+59>:     mov    %eax,0x54(%ecx)

0x009ba0ba <testFunc3Emmmm+62>:     add    $0x18,%esp

...
While this looks very uninviting if you are not familiar with assembly, you will be able to infer a number of things by comparing the disassembly to the original source code. For example, the cmp instruction compares the value of the eax register against the constant value $0x0, which we can correctly guess corresponds to the if statement on line 11.
Although we have already found the source of the problem, let’s pretend for a moment we are curious as to why a zero value was passed for the third argument. Perhaps our driver used an internal state to calculate the value passed to testFunc3(). In this case, we could continue our examination by looking at the state of the driver was in at the time of the crash. Because testFunc3() is a member method of the com_osxkernel_MyDebugDriver, we know that a pointer to the class instance is always passed automatically to the member function as the this pointer. We can dereference the this pointer address from the previous stack trace as follows:
(gdb) print *(com_osxkernel_MyDebugDriver*)0x4e80f80

$9 = {

  <IOService> = {

    <IORegistryEntry> = {

      <OSObject> = {

        <OSMetaClassBase> = {

          _vptr$OSMetaClassBase = 0x9baa00

        },

        members of OSObject:

        retainCount = 65537

      },

      members of IORegistryEntry:

      reserved = 0x4e71a40,

      fRegistryTable = 0xb693800,

      fPropertyTable = 0x503a400

    },

    members of IOService:

    reserved = 0x0,

    __provider = 0x4d17f00,

…….

  },

  members of com_osxkernel_MyDebugDriver:

  fTimer = 0xb63adc0,

  fVariable1 = 2,

  fVariable2 = 4,

  static gMetaClass = {

    <OSMetaClass> = {

      <OSMetaClassBase> = {

        _vptr$OSMetaClassBase = 0x9ba980

      },

      members of OSMetaClass:

      reserved = 0xb63ba00,

      superClassLink = 0x85fac8,

      className = 0x4e5b5a0,

      classSize = 92,

      instanceCount = 1

    }, <No data fields>},

  static metaClass = 0x9ba000,

  static superClass = 0x9ba020
We can now examine the internal state of our driver instance and we can see the values of its member variables fVariable1 and fVariable2. We can also see how many instances of our class exist from the meta class information and determine the retain count of the driver.
Understanding Kernel Panic Logs
A panic log can be found in the /Library/Logs/DiagnosticReports/ directory after a crash or can be obtained by extracting it from a core dump or a remote GDB session to a crashed target. As a kernel programmer, you might be expected to analyze kernel panic logs sent from customers’ computers, which you will rarely have, physical access to. Furthermore, the customer may be reluctant or unable to assist you in getting a core dump. It is therefore vital to be able to understand and extract as much information as possible from the logs. Let’s start to look at the panic log and what information we can extract from it. A panic log for the MyDebugDriver crash discussed in the previous sections is shown in Listing 16-5.
Listing 16-5. Panic Log from MyDebugDriver Crash
panic(cpu 1 caller 0xffffff80002c268d): Kernel trap at 0xffffff7f81345570, type 14=page fault,

registers:

CR0: 0x000000008001003b, CR2: 0x0000000000000090, CR3: 0x0000000000100000, CR4:

0x0000000000000660

RAX: 0x0000000000000000, RBX: 0x0000000000000000, RCX: 0x0000000000000000, RDX:

0x000000000000beef

RSP: 0xffffff808e973e80, RBP: 0xffffff808e973ea0, RSI: 0x000000000000feed, RDI:

0xffffff801ab61100

R8:  0x0000000000001504, R9:  0x000000000000beef, R10: 0x0000000000000000, R11:

0x0000000000001504

R12: 0xffffff7f8134591a, R13: 0xffffff800c81d200, R14: 0xffffff800c81d200, R15:

0xffffff800b735880

RFL: 0x0000000000010246, RIP: 0xffffff7f81345570, CS:  0x0000000000000008, SS:

0x0000000000000010

CR2: 0x0000000000000090, Error code: 0x0000000000000002, Faulting CPU: 0x1


Backtrace (CPU 1), Frame : Return Address

0xffffff808e973b40 : 0xffffff8000220702

0xffffff808e973bc0 : 0xffffff80002c268d

0xffffff808e973d60 : 0xffffff80002d7a3d

0xffffff808e973d80 : 0xffffff7f81345570

0xffffff808e973ea0 : 0xffffff7f813458b6

0xffffff808e973ed0 : 0xffffff7f81345914

0xffffff808e973f00 : 0xffffff7f813459f4

0xffffff808e973f40 : 0xffffff800063bc61

0xffffff808e973f70 : 0xffffff800023dafc

0xffffff808e973fb0 : 0xffffff8000820057

      Kernel Extensions in backtrace:

         com.osxkernel.MyDebugDriver(1.0)[FF6F45C8-68F8-3150-9C43-

99A2F19B3FB1]@0xffffff7f81345000->0xffffff7f81348fff


BSD process name corresponding to current thread: kernel_task

Boot args: debug=0xd44 _panicd_ip=192.168.1.1 panicd_ip=192.168.1.1


Mac OS version:

11A511


Kernel version:

Darwin Kernel Version 11.0.0: Sat Jun 18 12:56:35 PDT 2011; root:xnu-

1699.22.73~1/RELEASE_X86_64

Kernel UUID: 24CC17EB-30B0-3F6C-907F-1A9B2057AF78

System model name: MacBook5,1 (Mac-F42D89C8)


System uptime in nanoseconds: 200305435891999

last loaded kext at 200285007562702: com.osxkernel.MyDebugDriver  1 (addr 0xffffff7f81345000,

size 16384)

last unloaded kext at 187374587106276: com.apple.driver.AppleUSBCDC     4.1.15 (addr

0xffffff7f8133d000, size 12288)

loaded kexts:

com.osxkernel.MyDebugDriver  1

com.apple.driver.AppleUSBDisplays   302.1.2

com.apple.driver.AppleIntelProfile  83

com.apple.filesystems.afpfs 9.8
The panic log in Listing 16-5 was generated on a different system than before. This system is running a newer version of Mac OS X Lion, which only runs the 64-bit version of the kernel. The panic log consists of the following elements:
- The type of panic/problem that occurred and the CPU (core) number it occurred on
- A dump of the CPU state (register values)
- Back trace of what the CPU was doing at the time of the crash
- Kernel extensions involved in the crash and their dependencies (none above)
- The name of the process (task) that caused the crash
- Kernel build and version numbers
- System model
- Information about recently loaded/unloaded KEXTs
- A complete list of KEXTs loaded
The first thing you may notice is that the panic was caused by a page fault, which gives us a clue about what to look for later in our code. It is often useful to look at the task that caused the problem as well. In this case, our driver was executing in kernel context (kernel_task) when the crash occurred and not on the behalf of a user space thread.
First let’s look at the back race and try to prove that our driver was indeed involved. There is a very good chance that it was, as our driver is listed as being part of the back trace. You will also notice two addresses after our driver: 0xffffff7f81345000->0xffffff7f81348fff. This is the load address where the instructions and data for our KEXT were loaded into the kernel’s address space. To determine which functions on the stack belong to our driver, we can simply look for addresses on the stack that are within that range. Four addresses can be identified—0xffffff7f81345570, 0xffffff7f813458b6, 0xffffff7f81345914, and 0xffffff7f813459f4.
We already know from earlier that they will most likely correspond to testFunc3(), testFunc2(), testFunc1(), and timerFired().
![]() Tip In the previous back trace, the first address in the column is the address of the stack frame entry, while the second address is the return address, which is the point where execution returns to when the previous function call completes. It’s the return address that is interesting to us in this case. You may notice that the stack frame addresses contain increasing addresses and are all within a single page in this case. If the values look random and all over the place, it is likely the stack frame has been corrupted and the back trace may then be useless as the information cannot be trusted.
Tip In the previous back trace, the first address in the column is the address of the stack frame entry, while the second address is the return address, which is the point where execution returns to when the previous function call completes. It’s the return address that is interesting to us in this case. You may notice that the stack frame addresses contain increasing addresses and are all within a single page in this case. If the values look random and all over the place, it is likely the stack frame has been corrupted and the back trace may then be useless as the information cannot be trusted.
Assuming we had no clue what functions the addresses corresponded to within our driver, we can employ a simple trick. By simply subtracting the address of one of the functions from the load address, we can determine the offset of the function in the executable image of the driver, as follows:
0xffffff7f81345570 - 0xffffff7f81345000 = 1392 bytes
We now know that the function is 1392 bytes from the start of the KEXT and assuming we have the executable image (the exact version and build that was involved in the crash) of the driver available, we can do the following:
$ gdb MyDebugDriver.kext/Contents/MacOS/MyDebugDriver

GNU gdb 6.3.50-20050815 (Apple version gdb-1704) (Thu Jun 23 10:48:29 UTC 2011)

This GDB was configured as "x86_64-apple-darwin"...

(gdb) disassemble 1392

Dump of assembler code for function _ZN27com_osxkernel_MyDebugDriver9testFunc3Ejjjj:

0x0000000000000540 <testFunc3Ejjjj+0>:       push   %rbp

0x0000000000000541 <testFunc3Ejjjj+1>:       mov    %rsp,%rbp

0x0000000000000544 <testFunc3Ejjjj+4>:       sub    $0x20,%rsp

0x0000000000000548 <testFunc3Ejjjj+8>:       mov    %rdi,-0x8(%rbp)

0x000000000000054c <testFunc3Ejjjj+12>:      mov    %esi,-0xc(%rbp)

0x000000000000054f <testFunc3Ejjjj+15>:      mov    %edx,-0x10(%rbp)

0x0000000000000552 <testFunc3Ejjjj+18>:      mov    %ecx,-0x14(%rbp)

0x0000000000000555 <testFunc3Ejjjj+21>:      mov    %r8d,-0x18(%rbp)

0x0000000000000559 <testFunc3Ejjjj+25>:      mov    -0x14(%rbp),%eax

0x000000000000055c <testFunc3Ejjjj+28>:      cmp    $0x0,%eax

0x000000000000055f <testFunc3Ejjjj+31>:      jne    0x576 <_ZN27com_osxkernel_MyDebugDriver9testFunc3Ejjjj+54>

…

End of assembler dump.

(gdb) info line *1392

Line 14 of "MyDebugDriver.cpp" starts at address 0x569

<_ZN27com_osxkernel_MyDebugDriver9testFunc3Ejjjj+41> and ends at 0x576

<_ZN27com_osxkernel_MyDebugDriver9testFunc3Ejjjj+54>.
And we have found the location of the crash! A full description of CPU registers is outside the scope of this book, but suffice it to say they contain a wealth of useful information. We will discuss how we can use register information to retrieve function arguments in the next section. The processor in the panic log was running in 64-bit mode. The x86_64 has a larger amount of registers available than i386 systems, and local variables are usually passed in general purpose registers instead of the stack.
![]() Tip Technical Note 2063 discusses how to debug and understand kernel panics in much more detail and includes debugging panic logs from PowerPC systems:
Tip Technical Note 2063 discusses how to debug and understand kernel panics in much more detail and includes debugging panic logs from PowerPC systems: http://developer.apple.com/library/mac/#technotes/tn2063/_index.html.
x86-64 Calling Conventions
A calling convention is a scheme for how functions are passed their arguments. The calling convention depends on the programming language, operating system, architecture, and compiler. Understanding the calling convention used can help us decode the register state when a crash occurs. For example, on Mac OS X running a 64-bit executable or kernel, the System V AMD64 ABI convention is used (note that Windows uses a different calling convention, so the register usage will be different). On Mac OS X for a 64-bit task, the register assignments for function call arguments are shown in Table 16-4.
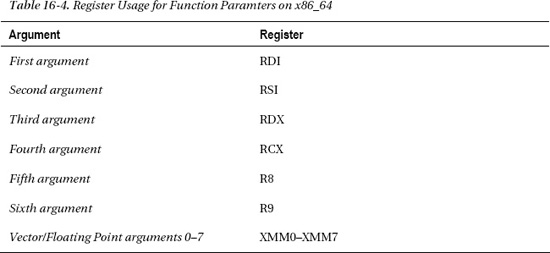
If a function takes more than six arguments, the remaining arguments will be passed on the stack. One thing to consider when examining C++ code is that a non-static C++ member method always passes the this pointer as the first argument, so the actual first argument to the method is passed in RDI whereas the this pointer will be put in the register RSI.
Let’s look at the registers in the panic log shown in Listing 16-5 and see if we can work out which arguments were passed to our function by examining the register state, as follows:
- RDI: 0xffffff801ab61100 (this pointer)
- RSI: 0x000000000000feed (decimal = 65261)
- RDX: 0x000000000000beef (decimal = 48879)
- RCX: 0x0000000000000000 (decimal = 0)
- R8: 0x0000000000001504 (decimal = 5380)
As you can see, the register contents from Listing 16-5 match exactly the four arguments passed to testFunc3(): 65261, 48879, 0, and 5380. We can also see that the first argument looks like a pointer and is likely to be the this pointer representing the current instance of MyDebugDriver.
Assuming testFunc3() was a longer and more complicated method and that the crash happened further down in the function, it is possible that the registers may have been reused and overwritten at the point of the crash. In that case, you may not be able to recover the original values of the arguments.
Diagnosing Hung Processes with Activity Monitor
The Mac OS X activity monitor shown in Figure 16-3 can be helpful in diagnosing kernel problems.
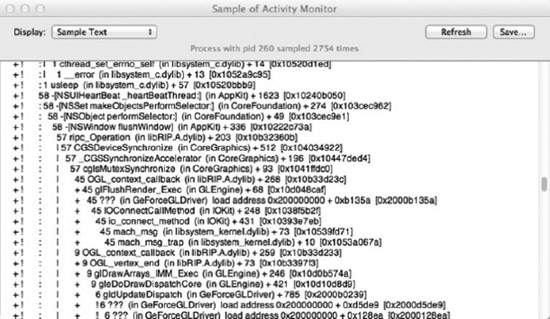
Figure 16-3. Sample process output from Acitivty Monitor
Any task shown in the Activity Monitor can be sampled (except the kernel_task), which will generate call graphs for all the threads of that task during the sample period. This is useful from a kernel debugging point of view in that you are able to see if a process has threads that are calling in to your driver through system calls like IOConnectCallMethod(). If a process is hung, force quitting it will start the Crash Reporter, which will give you a more detailed log, including the kernel stack of a thread if it is currently running in the kernel. The sample process function can also help you determine performance issues and find where an application is spending the most time.
Finding Memory and Resource Leaks
Preventing memory and resource leaks is particularly important for extensions that can be dynamically loaded and unloaded during runtime. A handy tool to detect leaks is the ioclasscount utility, which shows the instance count of each known class (loaded into the kernel). Typical output will look like the following:
CHUDUtils = 1

com_apple_AppleFSCompression_AppleFSCompressionTypeZlib = 1

com_apple_BootCache = 1

com_apple_driver_AudioIPCDevice = 1

com_apple_driver_AudioIPCEngine = 1

com_belkin_f2cd0007_adapter = 0

com_osxkernel_MyDebugDriver = 5

com_vmware_kext_KeyboardState = 1

com_vmware_kext_UsbDevice = 2

com_vmware_kext_UsbPortArbiter = 1

.....
It shows that our driver has been retained (retain()) five times. The driver’s free() function will not be called until the retain count reaches zero, even if the hardware device it controls is removed. This will prevent the kernel extension from being completely unloaded. The retain count typically increases for each user space application that opens the driver, or it can increase because another driver or ancillary support class used by the driver calls retain() on it. Failure to balance a call to retain() with a call release() will result in a leak. The ioclasscount utility can be used without changes to kernel boot parameters; it is not installed on a system by default, but is installed as part of the Xcode distribution. It can be copied onto a system without Xcode for debugging purposes. A driver that has been unloaded and has all references to it released (retain count = 0) will be unloaded by the kextd daemon. Although the reference count has dropped to zero, it may take up to a minute for the KEXT to be fully unloaded.
If you are able to live debug the kernel using GDB, you can use macros such as showallclasses or showregistry, as follows:
(gdb) showallclasses

…

1    x    84 bytes com_vmware_kext_VmmonService

2    x    80 bytes com_vmware_kext_UsbDevice

1    x   104 bytes com_vmware_kext_UsbPortArbiter

1    x   136 bytes com_vmware_kext_UsbPortArbiterUserClient

1    x   132 bytes com_vmware_kext_KeyboardState

1    x    92 bytes com_osxkernel_MyDebugDriver

....

(gdb) showregistry

...

      +-o com_osxkernel_MyDebugDriver  <object 0x0703e680, id 0x1000007a9, vtable 0xcbc980,

!registered, !matched, active, busy 0, retain count 5>

...
![]() Tip The
Tip The zprint and showioalloc macros can further assist in tracking memory usage.
To further help debug reference counting bugs, it is possible to override OSObject::taggedRetain(const void *tag) and OSObject::taggedRelease(const void *). For example, print a message or print a back trace of the caller’s stack to help identify where the leak comes from.