
4
Dynamic Modelling
LEARNING OBJECTIVES
At the end of this chapter, you should be familiar with concepts and usage of
Static characteristics of a system. Use of UML static diagrams such as class, object and package diagrams.
Events and States in a system and their role in depicting dynamic behaviour.
Use UML diagram to design the system using OOPS concepts.
4.1 Introduction to Static and Dynamic Modelling
While modelling an object, we are interested in two aspects. The first is the structure. When we say structure, we mean it is defined at compile time. We can also call this a static characteristic. For example, when we define a class, it includes attributes, behaviour in terms of attributes, links and associations, and some complex structures such as class within a class definition. We use class diagrams, object diagrams and package diagrams to describe the static characteristics of a system model.
Objects are instances of classes. Classes have attributes and behaviour. We are aware that instances are created at run-time, and these objects have a specific lifetime. They also undergo changes based on messages received during an object's lifetime. Methods or functions, as they are otherwise called, are responsible for an object's behaviour. Attributes hold values that can be changed during the lifetime of an object.
State of an object is defined as current values held by the attributes of an object. It is the result of behavioural changes of an object till that particular instance.
In this chapter, we would concentrate on static and dynamic modelling of object. Firstly we provide over view of UML, a language used for describing the behaviour of objects. We have used class diagrams, object diagrams, package diagrams to describe the static characteristics of a system modelling. We will also introduce dynamic modelling through study of collaboration diagrams, sequence diagrams, activity diagrams, and state transition diagrams etc.
4.2 Lifetime of an Object
Objects are dynamic entities. They are created at run-time as per the need of the program when the program is under execution. We say an object is instantiated. Constructor does this job of instantiation and also allocates initial values to the attributes of an instance of a class. Objects have attributes and behaviour. An object can communicate with other objects by passing messages. An object passes information about its state to others through get and set functions that are defined in a class. Get functions that return a value of attributes are also called assessors. Set functions that allow attributes to be modified are also called mutators.
Objects in Java use references to uniquely identify the instance of an object, whereas C++ uses pointers and references.
Once the object completes the role assigned to it, it has to be deleted from the memory so that the freed memory can be dynamically allocated to other objects. This is done through garbage collector in Java. Garbage collector is a program initiated by the Java run-time system to remove objects that are no longer required. In C++, programmers can explicitly remove an object through the use of delete function.
4.3 Unified Modelling Language – A Tool for OOAD
4.3.1 Overview of UML
The Unified Modelling Language (UML), is used as a graphical tool in object-oriented analysis and design (OOAD) methodology to model a software-based system under development.
When do we resort to modelling?
- When we would like to model the system and study its behaviour.
- When we further wish to simulate the system and study its performance and operations.
- When the system under development is complex and not a trivia.
- When the cost of development of a software system is prohibitive.
What do we look in a modelling system?
- It should closely follow the development model we choose, for example, the Waterfall model.
- It should be graphical in nature.
- It should model all facets of Software Development Life Cycle.
- It should accommodate all popular and well-accepted theories of object-oriented technologies such as those of Grady Booch, James Rambaugh and Ivar Jacobson.
The UML, founded by a consortium of industries such as Hewlett-Packard (HP), International Business Machines (IBM), Oracle, etc., under the aegis of a controlling group called Object Management Group (OMG), satisfies all the aforementioned criteria and is indeed an industry standard for software development. The UML can be effectively used to conceptualise, modify, construct and deliver an object-oriented software system, including full-fledged documentation.
The term “Unified” in UML implies that UML unifies the theories of three leading scientists at a software company called Rational Software, Grady Booch (Booch methodology), James Rumbaugh (object-modelling technique [OMT]) and Ivar Jacobson (use cases and objectory), into a rational unified process (RUP). Later, RUP was merged with development methodologies such as Booch methodology, OMT and object-oriented software engineering (OOSE).
4.3.1.1 Modelling
The UML is a graphical representation of a system under development. In addition, it also contains documentation such as use cases that are used for developing the system. The UML has two different views as described below:
- Static view: It provides the structure of the system under development in terms of objects, attributes and operations. These aspects are depicted by class diagrams and object diagrams.
- Dynamic view: It depicts the behaviour of the system. It includes collaboration diagrams, sequence diagrams, activity diagrams and state transition diagrams.
The UML Version 2.2 has 14 diagrams, seven static diagrams and seven behavioural diagrams. Behavioural diagrams include four interaction diagrams.
4.3.1.1.1 Structure Diagrams
Structure means the essential things that must be present so that the system can function as per specification. For example, the backbone and jaw are essential in human body to maintain the erect posture and to chew the food. Structure diagrams, as they depict the elements that are present in the system, represent the architecture of the system as shown below:
- Class diagram: It describes classes, their attributes and relationships among the classes.
- Component diagram: It shows the decomposition of software into components and the interdependencies between these components.
- Composite structure diagram: It describes the internal structure of a class and the collaborations that this structure enables.
- Deployment diagram: It describes the hardware used in system implementations, execution environments and artefacts deployed on the hardware.
- Object diagram: It is an instance of a class diagram at a particular instant of time.
- Package diagram: It describes how a system is split into logical groupings by showing the dependencies among these groupings.
- Profile diagram: It shows stereotypes as classes with <<stereotype>> and packages as <<profile>> stereotype. The symbol is
 and indicates that the meta model is extended by a stereotype.
4.3.1.1.2 Behaviour Diagrams
Behavioural diagrams depict the functionality of the system. The different types of behaviour diagrams are shown:
- Activity diagram: It shows the overall flow of control.
- UML state machine diagram: It depicts the states and state transitions of the system.
- Use case diagram: It describes the functionality provided by a system in terms of actors.
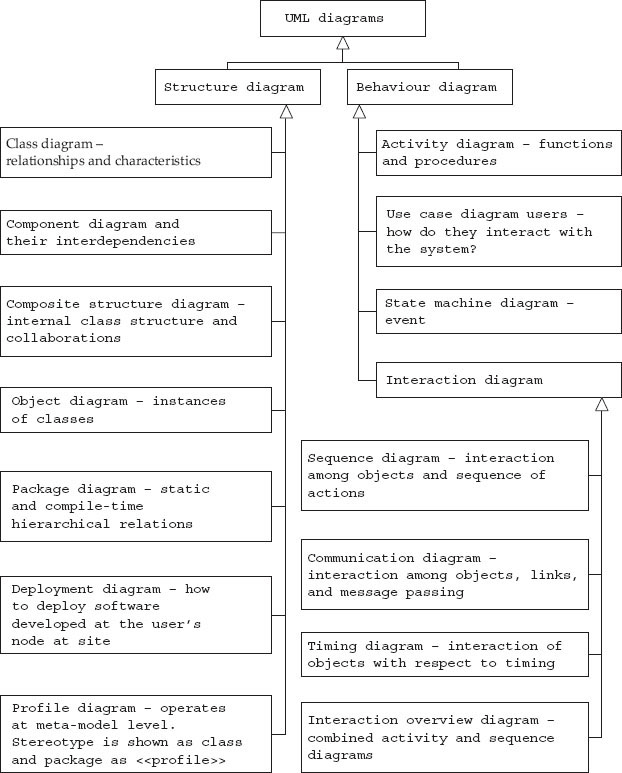
4.3.2 Classification of UML Diagrams
The classification adopted by UML is shown in Figure 4.1. Class, object and package diagrams depict the structure and static characteristics. Use case diagrams, interaction diagrams, state diagrams and activity diagrams, on the other hand, depict behavioural modelling. In Chapter 2, we have dealt in detail with structure. In the following sections, we discuss dynamic behaviour.
4.4 User Requirements – Use Cases
We want to produce a system that the user wants. Once the system is produced, users interact with it to produce the desired result. So we need some description on how to go about it. Use cases typically provide such description. Use cases describe what the system does from the point of view of an external user. They provide a sequence of steps describing the interaction between the system and the user. This sequence of steps is called a scenario.
For example, for an automated library information system in a college, a scenario could be as follows (Fig. 4.2): A student browses online the catalogue of books available in the library and selects the accession number of the book he or she wishes to borrow from the library. The issue subsection of the automated system checks the entitlement of the student and confirms the issue of the book to the student. The system issues an authorization slip to the issue gate by email. The student carries the book to the issue gate, where the in-charge affixes the authorization slip on the inside-cover page.
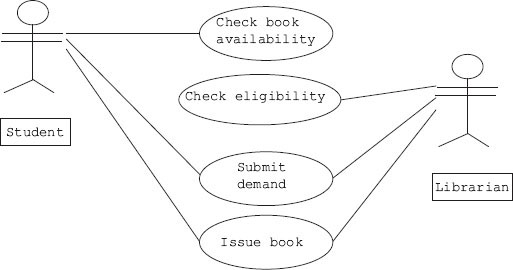
Figure 4.2 Use cases in an issue section of a library system
A second scenario can be that authorization fails because the student has exceeded the limit of borrowing.
A third scenario could be that a student has failed the identification checks.
There are three scenarios described for borrowing a book from the library; but the goal of the student in all three scenarios is the same, i.e. borrowing a book. So, we can now say that a use case is a collection of different scenarios but with a common goal.
In a use case, we call users as actors. An actor can be a human being, a device, or a software module. For example, banking software system manager, customer, smoke sensor and software agent working in the background are all actors. A use case can have several actors and conversely one actor can use several use cases. An actor is shown as a stick and a use case as an oval. The UML has a use case diagram that shows how use cases are related to each other.
As a second example consider the case of a student enrolling for a third semester course.
The actors and use cases involved in this example are shown in Figure 4.3.
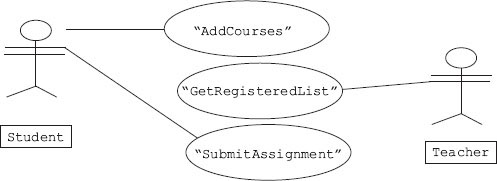
Use cases explain functional requirements of a system under study. Each use case is required to be described in detail before implementing. A scenario explaining the step-by-step procedure of how the user gets what he or she wants out of a system is given below:
Gautam enrols for third semester course. A step-by-step procedure in shown below:
- Gautam goes to the registration window and enters his identification details.
- Computer gives a list of things Gautam can do.
- Gautam selects registration for third semester courses.
- The screen shows the list of courses and open electives.
- Gautam selects courses and open electives.
- The system confirms Gautam's registration for third semester.
- Gautam logs out.
Each use case will have a primary actor that calls on the use case to deliver the functionality expected. A use case can have another use case defined inside. Each step in a use case is an interaction between the actor and the system. In addition, each use case can have preconditions, a guaranteed result, and also a trigger that sets the use case into action.
4.5 Architecture and Domain: What Are They?
In any real-world problem, we have users and their wants and needs. Accordingly, we define objects and their interactions, i.e. we decide architecture. Users’ world is called Domain.
4.5.1 Architecture
We have users of the system and use cases. We have classes in the software we are developing. Classes are a reflection of the real-world client (users) and what they want (use cases). Based on clients and their real-world interactions, we define interaction between objects and classes as links and associations to deliver functionality. This arrangement is termed as architecture.
We can define architecture as a depiction of objects and their attributes together with the operations these objects perform to meet user specifications or needs.
4.5.2 Domain
The clients and their interactions exist in the real world. Class is a conceptual model that maps real-world problems to software. The users’ world is called domain.
We will show the users domain and our architecture as a collection of square boxes that contain names of the objects (Fig. 4.4). We will also show their links and associations by drawing interconnecting lines. As we have studied in Chapter 2, we can also amplify by specifying role names and multiplicities. In Example 4.2, we consider domain and architecture of a college.

Figure 4.4 Domain and architecture diagram for a college
The square boxes you see are called entities. For a complex project, attributes of each entity is maintained in a table. This table is called a data dictionary. Before the advent of the objectoriented programming paradigm, these diagrams were also called entity-relation diagrams.
In order to get an insight into which object does what, it is advisable to list out the sequence of steps for the entire process. Let us revisit the overall sequence of operations for the registration process we have discussed in Example 4.1, with amplification shown to registration process as shown below:
- Gautam goes to the registration window and enters his identification details.
- Computer gives a list of things Gautam can do.
- Gautam selects registration for third semester courses.
3.1 Add a course.
3.2 Delete the course already added (update).
- The screen shows the list of courses and open electives.
- Gautam selects courses and open electives. He has the option of adding a course or dropping a course as update feature.
- The system confirms Gautam's registration for third semester.
- Gautam logs out.
Then for each step in this sequence of steps, we can prepare a sequence diagram or a communication diagram and/or timing diagram. What each object does is an important issue for the user. UML provides sequence diagram and communication diagrams to solve this issue. Timing diagram is a variation of the sequence diagram that specifies against time base.
4.6 Sequence Diagram
Users are represented by stick figure. Each object is represented by a square box (object representation). A vertical line is drawn from each object to represent the activity base line. Arrows emanating from each vertical line show the object sending a message or calling a function belonging to some other object.
In Figure 4.5, we show the sequence diagram. The actor understudy is a third-year student. The course coordinator would like to drop or delete Gautam's name from section K. The sequence of activities is as follows:
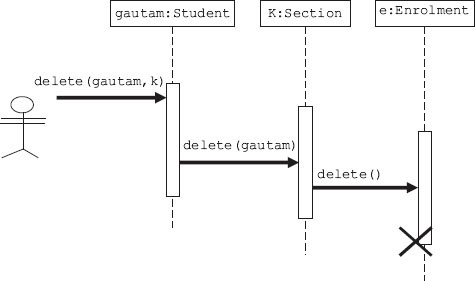
Figure 4.5 Sequence diagram for deleting a name from registration process
4.7 Collaboration (Communication) Diagram
Earlier, communication diagrams were known as collaboration diagrams. These are essentially the same as sequence diagrams except in the case of communication diagrams. The time of occurence of messager, called time ordering, is shown explicitly by numbering the messages as shown in Figure 4.6. Each message in a collaboration diagram has a sequence number. The top-level message is numbered 1. Messages at the same level (sent during the same call) have the same decimal prefix but different suffixes of 1, 2, etc., according to when they occur.
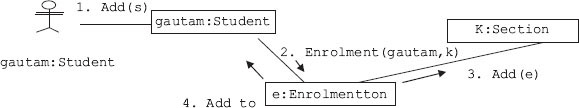
The key elements of a communication diagram are
- Objects as classifier: They are shown as rectangular boxes. The object-role rectangles are labelled with either class or object names (or both). Class names and object names are separated by colons (:).
- Connector: This is a line indicating a message.
- Named arrow: This represents the sender, receiver.
In order to read the collaboration diagram, simply start at the message numbered as 1 and follow numbers. In Figure 4.6, we have used a simple numbering scheme. However, UML uses a nested numbering system such as
Simple numbering scheme: 1, 2, 3, 4, …
Nested UML numbering: 1, 1.1, 1.1.1, 1.1.2, …
Collaboration diagrams convey the same information as sequence diagrams; but they focus on object roles instead of the times that messages are sent.
4.8 Events and State
Class diagrams are static in nature and depict the links and associations between classes. They cannot be used to depict the behaviour of objects during objects’ lifetime.
Objects have behaviour and state. The state of an object is defined by current values of attributes. We have further learnt that access specifiers like getters and setters can change the values of attributes. We can say that some events trigger the process of changing the values of attributes and thereby change the state of an object.
Note that a state diagram describes behaviour of class objects. Therefore, all objects share a single state diagram. But the path object follows in the state diagram is specific to an instance of the object.
The state chart notation has been developed in computer science as part of theory of automatic machines called the automata theory. This science has been adopted by UML to depict the way in which an object changes. Each change in behaviour is modelled as a change in state.
A state diagram represents events and states. When an event occurs, transition to the next state depends on current state and event. The state diagram shows these changes in states and allows changes that cause the change of state. As an example let us see how a student enrols in a college. The state diagram is shown in Figure 4.7.
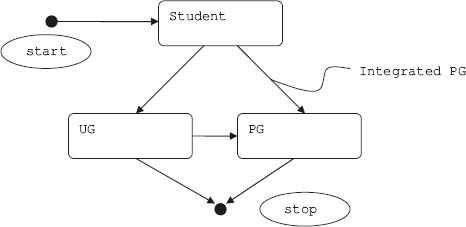
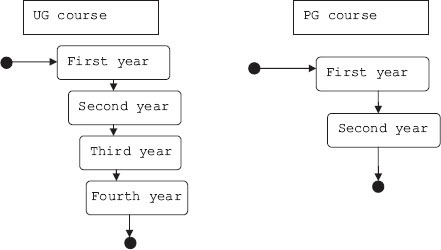
Figure 4.7b Student undergoing UG/PG courses
In a state diagram, observe that start and stop are shown as black blobs. Each state is shown as a rectangle with rounded corners. Change in state means that the object has changed its behaviour. For example, a student when he or she undergoes the undergraduate (UG) course, i.e., first- to fourth-year courses, and qualifies, then he or she becomes a UG. A student can enrol either for UG course or directly for an integrated postgraduate (PG) course. Each arrow represents a change.
We can add a lot of additional information on the state chart diagram:
- It can be labelled with the name of the function that causes the change.
- Add operations or events or conditions that trigger changes in the object's state.
- Add operations to be executed while entering and leaving the state.
We are now ready to define a dynamic model as a collection of all state diagrams that interact with each other with interacting events.
In online banking, there are the following distinct states:
- Logging into the system by entering username and password
- Validating username and password
- Getting username and transaction password
- Validating username and transaction password
From each state, transactions emerge. Transactions are shown as arrows going from one state to another state. Events that trigger transition from one state to another are shown next to the arrows. In Figure 4.8, in our system we have two self-transitions that occur when the user enters invalid username or password. Till user does not enter tab key or enter key the cursor remains and dot is displayed to maintain secrecy of data being entered.
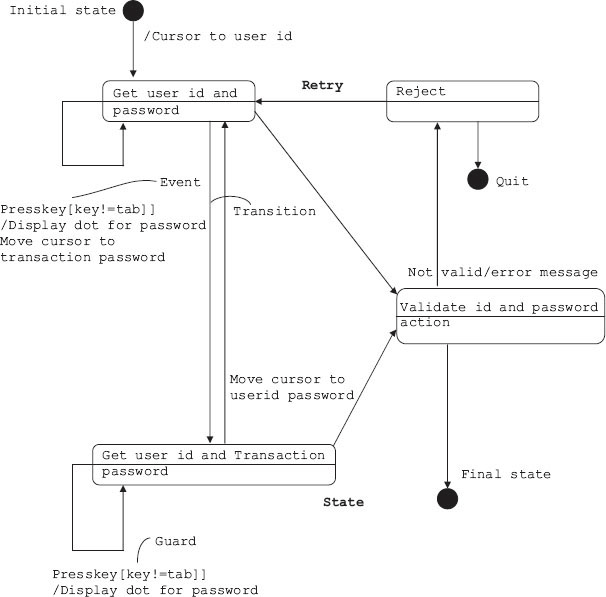
Figure 4.8 State diagram for Internet banking
The Internet banking system obtains user id and Internet password and validates them. If they are found to be correct, user can enter transaction details. The system, as a double safety measure, asks for user id and transaction password. These entries are also subjected to validation. If they are found to be correct, final state is reached wherein user can attend to his or her transaction or it is rejected.
The start and stop are shown as black circles and are dummy states. Each state can have an action. The object performs the action, and as a result of this action the object can change its state.
4.8.1 Activity/Action and Operations
States perform activities. It can be a single activity or a sequence of activities. The notation used is “Do X1”. If a state has “Do X1” mentioned in rectangular box, it means that on entry it will do activity X1.
On the other hand, an action signifies immediate operation. Operations are indicated with a “/”. For example, we have shown / Display Dot as operation in the Internet banking example in Figure 4.8.
Action can also be used to generate other events. For example, from an idle state, by right clicking the mouse button, we can generate a help menu. On release, the help menu can be removed. The state diagram is shown in Figure 4.9.
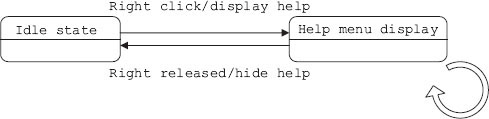
Figure 4.9 Example of internal actions
4.8.2 Nested State Diagrams
We have learnt that states perform activities. Activities can be broken down into subactivities. Now, if each subactivity represents a state, we can say state is a collection of substates and we can call the structure as a nested state diagram.
As an example, consider the cool-drink vending machine installed at your campus. The main activities involved in obtaining a cool drink from the machine are as follows:
- User enters token.
- Validate token.
- User selects brand of cool drink.
- Dispense the drink.
The vending machine model is presented in Figure 4.10. The main states shown are as follows:
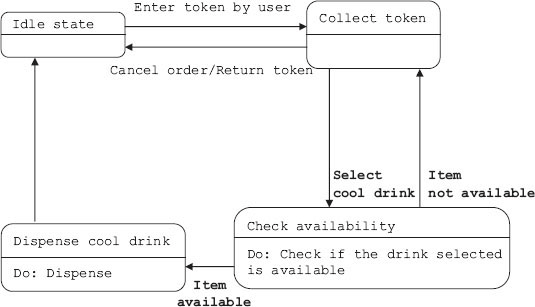
- Collect token from the user.
- Check availability.
- Dispense item.
The state diagram contains an activity called dispense item and an event called select cool drink. We will expand and show these two through nested state diagrams. Figures 4.11a and 4.11b show nested state diagrams.
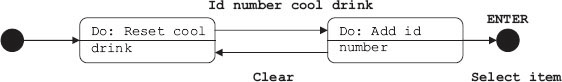
Figure 4.11a Expanded state diagram for the event select item
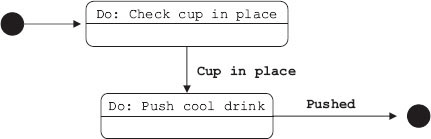
Figure 4.11b Expanded state diagram for dispense item
For selecting an item from an available list of cool drinks, user has to enter the identification number for the cool drink selected. He or she will have the option of cancelling the entry and re-entering the number. On pressing ENTER, the item gets selected and is registered for dispensing.
4.9 Activity Diagram
A state chart diagram tells us about an object undergoing a process. An activity diagram shows the flow of activities in a single process. It shows the way in which each activity is dependent on other activities. Therefore, we can define activity as a diagram showing the flow of activities and their interdependence on one another.
For explaining the concept of activity diagram, we choose the same example of interbank money transfer through the Internet as in Example 4.3.
The classes involved in the case of interbank money transfer through the Internet are user, client computer system and bank. The activities concerning each class are shown as rounded rectangles in a separate column called swim lane. The salient features of an activity diagram are as follows:
- Swim lane identifies the object responsible for carrying out a particular activity.
- Each activity gives rise to a single transition, and each transition connects to the next activity.
- A transition, sometimes based on decision box, may branch into two or more transitions.
- Each transition coming out is indicated using a guard expression ([]).
- A branch and a subsequent merge are indicated using a shallow diamond.
- Sometimes, a transition may fork into parallel activities and later merge. These are shown as solid bars in Figure 4.11.
Example 4.4: Activity diagram for online Internet banking
In money transfer using online banking, the activities involved are shown below:
- User logs into the system by entering username and password.
- Bank server (bank) validates username and password.
- User enters amount and transaction password (IPIN) and transfer details.
- Bank validates transaction password.
- On successful validation of IPIN, bank checks availability of funds.
- Bank transfers the amount to destination account.
- On confirmation from destination bank's server, bank debits the account.
- The transaction details and fund balance are displayed.
- User logs out.
The activity diagram in Figure 4.12 is self-explanatory and follows the list of activities described above. There are two lanes, one for bank server and another for client machine.
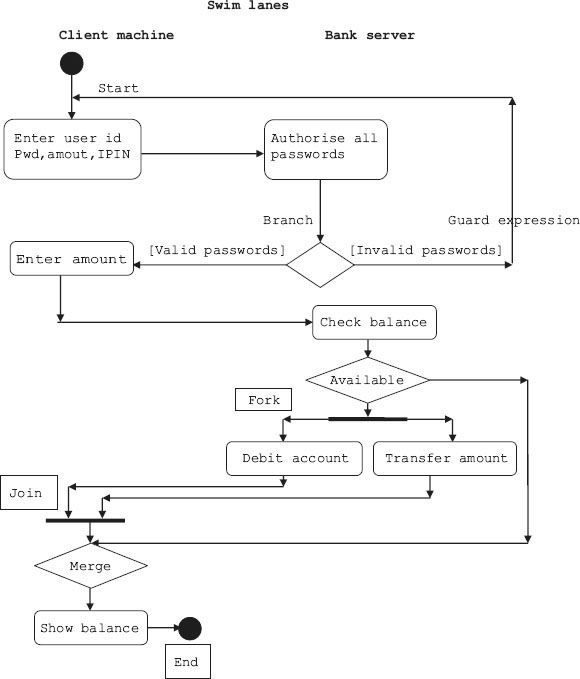
![]() White diamond is used to indicate branching, and guard expressions are enclosed in [].
White diamond is used to indicate branching, and guard expressions are enclosed in [].
![]() A thick line is used to indicate fork, i.e., to initiate more than one activity such as debit account as well as transfer amount. Same symbol is used for join activity also.
A thick line is used to indicate fork, i.e., to initiate more than one activity such as debit account as well as transfer amount. Same symbol is used for join activity also.
4.10 Packages and Components – A Way to Organize Large and Complex Projects
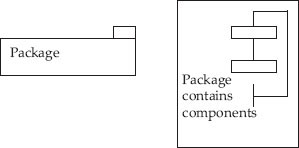
You are familiar with files and folders. In order to organize your work, you open folders and within folders you store files. Package is like a folder. We can store all our classes in this folder called package directly. If the number of classes is very large, then classes can be grouped into components and components into packages (Fig. 4.13).
Components contain classes. They provide pluggable interfaces to users. We will use plug and socket concept to denote an interface. For example, in Figure 4.14, Application module provides interface to students’ module.
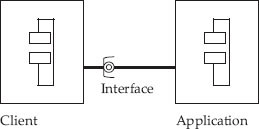
Figure 4.14 Notation for components
If we code the classes in components, then these coded classes are called artefacts. Artefacts is the name given by UML to files. There can be several file types. For example, source code, library file called .h file in C++ notation, executable file. Figure 4.15 makes the concept clear. Here, we show a source called Student.cpp and a library called Student.h and corresponding object modules with extension .obj. The standard artefacts used are the following: <<executable>>, <<document>>, <<file>>, <<library>>, <<script>> and <<source>>.
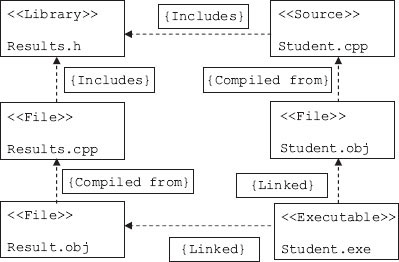
Figure 4.15 Components (artefacts) in a project
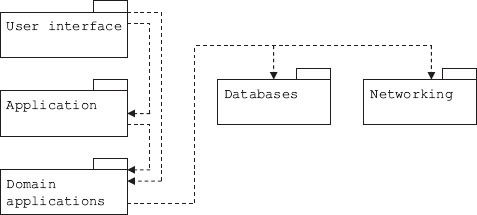
In Figure 4.16, we show how packages are interconnected with dependencies. Dotted arrows show dependencies of a package on other packages.
4.11 Component and Deployment Diagram
Deployment diagrams depict the physical configuration of software and hardware. We are aware that in object-oriented technology, class diagrams depict the structure of the application and interactions among them through various relationships such as inheritance.
We are further aware that class contains member functions that contain all the code modules required to achieve functionality.
A component is defined as code module. An application such as online shopping contains several components. An application will have a user interface.
Hardware is a collection of nodes. Components reside on the nodes.
Remote nodes are interconnected using networking hardware such as transmission control protocol (TCP)/Internet protocol (IP).
Thus, there is a need to group all the above in a single diagram, which is called a component and deployment diagram, which is shown in Figure 4.17.
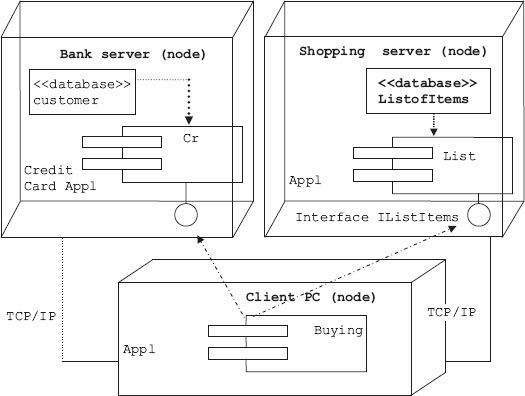
Figure 4.17 Component and deployment diagram for online
4.12 Summary
- Modelling consists of structural modelling and behavioural modelling. Structural modelling is also called static modelling. Behavioural modelling is also called dynamic modelling.
- Class diagrams, object diagrams and package diagrams describe the static characteristics of a system modelling.
- State of an object is defined in terms of current values held by attributes of an object. It is the result of behavioural changes of the object till that particular instance.
- The UML is used as a graphical tool in OOAD methodology to model a software-based system under development. It accommodates all the popular and well-accepted theories of object-oriented technologies such as those of Grady Booch, James Rambaugh and Ivar Jacobson.
- Use cases provide a sequence of steps describing the interaction between a system and user. This sequence of steps is called a scenario. Use cases explain the functional requirements of the system under study.
- Sequence of steps can be represented in a sequence diagram.
- Sequence diagram with time ordering of events/activities is called timing diagram or communication diagram.
- We can define architecture as the depiction of objects and their attributes together with the operations performed by these objects to meet user specifications or needs.
- Communication diagrams were earlier known as collaboration diagrams. These are essentially same as sequence diagrams; but in the case of communication diagrams, time ordering is shown explicitly by numbering the messages.
- Dynamic model is the collection of all state diagrams that interact with each other with interacting events.
- States perform activities. An action is immediate operation. An action can also be used to generate other events.
- Activity diagram shows the flow of activities and their interdependence on one another. The activities concerning each class are shown as rounded rectangles in a separate column called swim lane.
 White diamond is used to indicate branching, and guard expressions are enclosed in [].
 A thick line is used to indicate fork, i.e., to initiate more than one activity.
- Package is like a folder. We can store all our classes in this folder directly. If the number of classes is very large, then classes can be grouped into components and components, in turn, into packages.
- Deployment diagrams depict the physical configuration of software and hardware.
- A component is defined as a code module. Hardware is a collection of nodes. Components reside on the nodes.
Exercise Questions
Objective Questions
- State diagram specifies
- State of the object during its lifetime
- State of the object at current state
- State of the object in current use case
- State of the object across all use cases
- i and iii
- i and ii
- i and iii
- i, ii and iv
- State of the object is defined by
- Current attributes
- Result of all transitions till current state
- Behaviour of the object
- Methods
- i and iii
- i and ii
- i and iii
- i, ii and iv
- Which of the following statements are true in respect of state diagram?
- State diagram depicts events
- State diagram depicts state
- The transition to next state depends on current state
- Change in state means change in behaviour
- i and iii
- i, ii and iv
- i and iii
- i, ii and iv
- Dynamic model means collection of all state diagrams TRUE/FALSE
- The UML
- Unifies the theories of Booch, Rumbagh and Ivar Jacobson
- Unifies development methodologies such as OOSE, OMT and Booch
- Unifies SASD and OOAD
- Unifies RUP and development methodologies
- i and iii
- i and ii
- i and iii
- i, ii and iv
- UML 2.2 has ------------ number of diagrams
- 12
- 13
- 14
- 15
- UML 2.2 static view has ------------ number of diagrams
- 6
- 7
- 8
- 9
- UML 2.2 dynamic view has ------------ number of interaction diagrams
- 4
- 7
- 5
- 3
- The following is not part of static diagram
- Class diagram
- Use case diagram
- Object diagram
- Package diagram
- i
- ii
- ii and iv
- i, ii and iii
- In use cases, which of the following statements are true?
- Users are called actors
- Use cases are sequence of steps
- Use case contains scenarios
- Use case means architecture
- i
- ii
- ii and iv
- i, ii, iii and iv
- Which of the following is true in respect of sequence diagram?
- Actor is represented by a stick figure
- Objects are represented by oval
- Vertical line represents activity
- Horizontal arrow represents messages
- i and ii
- ii
- i, iii and iv
- i, ii, iii and iv
- Which of the following is true in respect of communication diagram?
- They are also called collaboration diagrams.
- They are same as sequence diagrams.
- They are sequence diagrams with time ordering of activities.
- They concentrate on object role rather than on time at which communication is sent.
- i and ii
- ii
- i, iii and iv
- i, ii, iii and iv
- Which of the following is true in respect of activity diagram?
- Activity diagram depicts object undergoing a process.
- Activity diagram is flow of activities in a single process.
- It is flow of activities and their interdependence on one another.
- They concentrate on object role rather than on the time when communication is sent.
- i and ii
- ii
- i, iii and iv
- i, ii and iii
- Which of the following is true in respect of activity diagram?
- White diamond means branching
- Thick line indicates fork
- Fork means initiation of one activity
- [] are for guard expression
- i, ii and iv
- ii
- i, iii and iv
- i, ii and iii
- Which of the following is true in respect of packages and components?
- Packages contain components
- Components contain classes
- Files in UML are called artefacts
- Files, library and script are part of artefacts
- i, ii and iv
- ii
- i, ii, iii and iv
- i, ii and iii
- Deployment diagram includes configuration
- Software
- Software and hardware
- Hardware
- Server details
Short-answer Questions
- Explain the term “Unified” in Unified Modelling Language.
- Define architecture and domain.
- List the names of diagrams that are part of static view of UML.
- List the names of diagrams that are part of dynamic view of UML
- Explain composite structure diagram and profile diagram of UML.
- Distinguish sequence and communication diagrams.
- Explain the terms event and state.
- Explain the terms activity, action and operations.
- Explain nested state diagrams.
- What is dynamic modelling?
- Explain the terms packages and components.
Long-answer Questions
- Explain in brief UML static and dynamic diagrams.
- Explain use cases with an example.
- Explain the terms architecture and domain
- What are sequence diagrams? Explain the concept with an example.
- What are communication diagrams? Explain the concept with an example.
- Explain event and state.
- Explain nested state diagrams with an example.
- What are the various artefacts in a project?
Assignment Questions
- Write history and background for the development of UML as an OOAD tool.
- Explain dynamic modelling. What aspects of a project can be understood better with this model?
- Use case represents architecture. Justify the statement.
- Develop use case diagram for ATM banking operation.
- Develop a state chart diagram for online Internet shopping.
- Draw a state diagram for online checking of the results declared by university.
- Develop the activity and deployment diagram for the Problem 6.